Weather and Climate Toolkit - Batch Processing
The Weather and Climate Toolkit (WCT) may be used for batch processing by following
the instructions below. All options are controlled with an XML configuration file.
Data Exporter Instructions
XML Configuration File
KMZ Export
Batch Processing Tips
Batch/Command-Line Map Creation
WCT Exporter Instructions:
Top of page 1) Download the WCT distribution:
| Windows | STABLE (Version 4.8.1) | |
| Mac OS/X | STABLE (Version 4.8.1) | |
| Unix/Linux | STABLE (Version 4.8.1) |
Also - download this example Batch Processing Project Example, which contains example scripts, color maps and a recommended project structure. To upgrade the WCT version, unzip the latest version from the above links into the /wct-batch/software directory and adjust script variables accordingly.
2) Unzip the WCT distribution:
Unix/Mac:
         wct-4.8.1.zip
          |
          |-- wct -- dist         (Main distribution libraries)
               |---- lib          (Supporting libraries)
               |---- wct-export   (Batch Data Export script)
               |---- wct-viewer   (Viewer User Interface script)
               |---- wctBatchConfig.xml  (Example config file)
Windows:
         wct-4.8.1-win32.zip
          |
          |-- wct -- dist             (Main distribution libraries)
               |---- lib              (Supporting libraries)
               |---- wct-export.bat   (Batch Data Export script)
               |---- wct-viewer.bat   (Viewer User Interface script)
               |---- wct.exe          (Viewer User Interface executable)
               |---- wctBatchConfig.xml  (Example config file)
3) Write or modify the XML configuration file:
This file is described in detail
below.
4) Run 'wct-export' from command line (DOS, Terminal or Unix Shell):
From the command-line or script, run 'wct-export' with the following arguments:wct-export <in> <out> <format> <config>
- <in> = Input URL, filename or directory. If directory, then all supported files in directory are processed. A URL must be for a specific file, not a directory.
- <out> = Output file or directory for processed files. If a directory, then the output files use the input filename. The directory must already exist or it will be treated as a file.
- <format> = Output format (use one of the following abbreviations). shp=Shapefile, wkt=Well-Known Text, asc=Arc/Info ASCII Grid, flt=Arc/Info Binary Grid, nc=NetCDF, tif=8-bit grayscale GeoTIFF, tif32=32-bit real value GeoTIFF, csv=Comma-Separated Text File (Alphanumeric-Only), rnc=Raw NetCDF, json=GeoJSON
- <config> = XML configuration file for export options. This may be a file or URL.
5) List file options...
The Exporter may also be run with a list of input files and destination directories:
wct-export <listfile> <format>
- <listfile> = Listfile with format of infile/dir/url,outfile/dir,config-xml-file/url.
Example Listfile - <format> = Output format (use one of the following abbreviations). shp=Shapefile, wkt=Well-Known Text, asc=Arc/Info ASCII Grid, flt=Arc/Info Binary Grid, nc=NetCDF, tif=GeoTIFF, csv=Comma-Separated Text File (Alphanumeric-Only), rnc=Raw NetCDF, json=GeoJSON
6) Example command line arguments:
a) Download latest N1R product from the National Weather Service (NWS) and save as a Shapefile using the specified config file.
<in> = http://weather.noaa.gov/pub/SL.us008001/DF.of/DC.radar/DS.p19r1/SI.kgsp/sn.last
<out> = D:\Nexrad_Viewer_Test\Batch\output
<format> = shp
<config> = D:\Nexrad_Viewer_Test\Batch\wctBatchConfig.xml
b) Process all files in C:\ViewerData\HAS999900001\ to NetCDF using the specified config file.
<in> = C:\ViewerData\HAS999900001\
<out> = D:\Nexrad_Viewer_Test\Batch\output
<format> = nc
<config> = D:\Nexrad_Viewer_Test\Batch\wctBatchConfig.xml
c) Process all files in listfile to GeoTIFF using the specified config files.
<listfile> = D:\Nexrad_Viewer_Test\Batch\listfile.txt
<format> = tif
Top of page
Weather and Climate Toolkit XML Configuration File
Download example configuration file: wctBatchConfig.xml
There is documentation inside this file explaining the various options and configurations.
Top of page
Command-Line KMZ Export Examples
As of version 3.7.0, the creation of KMZ files from the 'wct-export' script is supported. The KMZ files created from 'wct-export' are a zipped bundle of files containing a rendered .png image file (not a data file), a KML file (XML format) describing the geolocation of the image, and finally associated legend and logo images. Because of this additional information, a KMZ export requires some additional configuration compared to a simple data export. The <kmlExportOptions> section in config file wctBatchConfig.xml has documentation for the additional configuration parameters. There is also additional documentation regarding the palette files for defining color maps, as well as sample scripts, below.
Palette/Color Map Configuration:
The Toolkit uses a simple text file to define the color maps. The text file palette can be configured to represent continuous data, discrete categories of data, classifed ranges of data and filtered value ranges (by setting unwanted values to fully transparent). Hint: Remember to uncomment the default palette location of 'NONE' in the default wctBatchConfig.xml file.
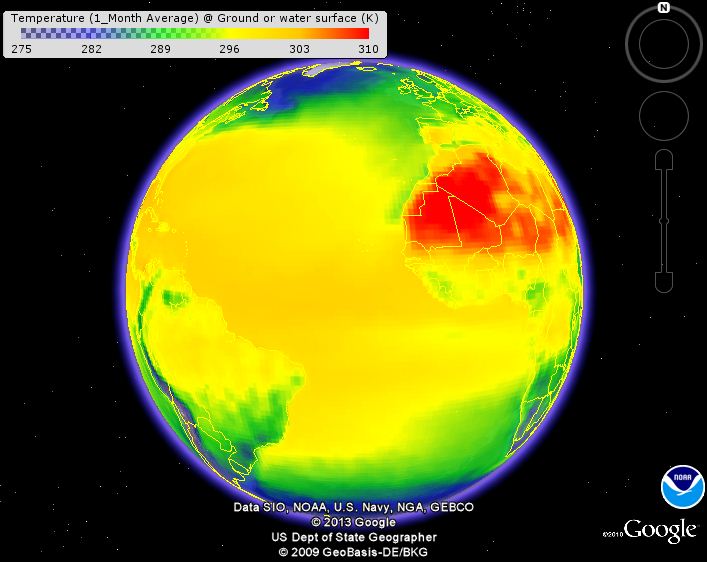
Example 1) This example based on the 'rainbow.wctpal', which is bundled with the Batch Processing Project Example. The default rainbow palette has been modified to add some transparency at the lower value range and fit the dynamic range of temperature in units of Kelvin.
#       VALUE  R    G     B    A
Color:  275     0     0  124  75
Color:  282     0     0  255  105
Color:  289     0   255    0  155
Color:  296   255   255    0  255
Color:  303   255   200    0  255
Color:  310   255     0    0  255
In this example, all values less than or equal to 275 will be colored as (0, 0, 124, 75) and all values greater than or equal to 310 will be colored as (255, 0, 0, 255) in RGBA. The colors in between the defined values will be interpolated. Below is an example of the resulting KMZ file in Google Earth:

KMZ output using 'rainbow-example.wctpal' example color map.
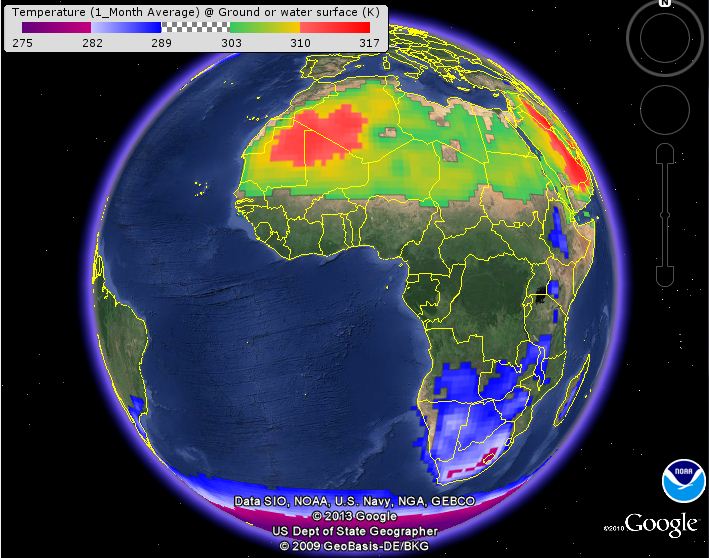
Example 2) This example builds upon the first example by defining classified ranges of data.
#       VALUE  R    G     B    A
# category 1
Color:  275   200     0  124  255
Color:  282   200     0  124  255
# category 2
Color:  282     0     0  255  255
Color:  289     0     0  255  255
# category 3 (transparent range)
Color:  289     0     0  255  0
Color:  303   255   255    0  0
# category 4
Color:  303   255   200    0  255
Color:  310   255   200    0  255
# category 5
Color:  310   255     0    0  255
Color:  317   255     0    0  255
In this example, the colors between the value ranges are interpolated, however using the same color for the start and end of the range will show the range as a solid color.

KMZ output using 'rainbow-example-filter.wctpal' example color map.
Example 3) This example builds upon the previous example by combining interpolated color ranges and defined ranges.
#       VALUE  R    G     B    A
# category 1
Color:  275    100     0  124  255
Color:  282    200     0  124  255
# category 2
Color:  282    200   200  255  255
Color:  289     0     0   255  255
# category 3 (transparent range)
Color:  289     0     0  255  0
Color:  303   255   255    0  0
# category 4
Color:  303    55   200  100  255
Color:  310   255   200    0  255
# category 5
Color:  310   255    100  100 255
Color:  317   255     0    0  255

KMZ output using 'rainbow-example-filter-interp.wctpal' example color map.
Top of page
Batch Processing Tips
1. Output Redirection
'>' will redirect all output (standard out and standard error)
'1>' will redirect standard out
'2>' will redirect standard error
To redirect to nowhere (disable) the output, use 'NUL' on Windows and '/dev/null' on Linux and Mac.
Examples:
-
Ignore all output:
Windows: [ command arguments ] >NUL
Linux: [ command arguments ] >/dev/null
-
Ignore standard output and send error messages to screen:
Windows: [ command arguments ] 1>NUL
Linux: [ command arguments ] 1>/dev/null
-
Ignore standard output and send error messages to file:
Windows: [ command arguments ] 1>NUL 2>errors.log
Linux: [ command arguments ] 1>/dev/null 2>errors.log
2. Data cache directory
By default, the WCT will cache data files to the location defined by the java.io.tmpdir default java property. On Windows this is usually the same as the %TMP% environment variable. On Mac and Linux, this is usually '/tmp'
Here are two examples of how to change this default location:
- Modify the wct-export script to set the java.io.tmpdir value. In the script, you would add the following command before the '-classpath' part of the java command that initiates the WCT.
java -mx3500m -Djava.awt.headless=true -Djava.io.tmpdir=/new/path/ -classpath "%WCT......
- Use the _JAVA_OPTIONS environment variable to modify the default value of java.io.tmpdir. On Windows, do this in the environment variables manager. On Mac/Linux, this may be set in the .bash_profile by adding:
export _JAVA_OPTIONS=-Djava.io.tmpdir=/new/tmp/dir
Top of page
Batch/Command-Line Map Creation
1. Choose a command-line GIS package to generate maps
Example Open-Source packages include FWTools/Mapserver/GDAL, NCL and R
Example Proprietary packages include Matlab and IDL.
2. Example with FWTools/Mapserver/GDAL
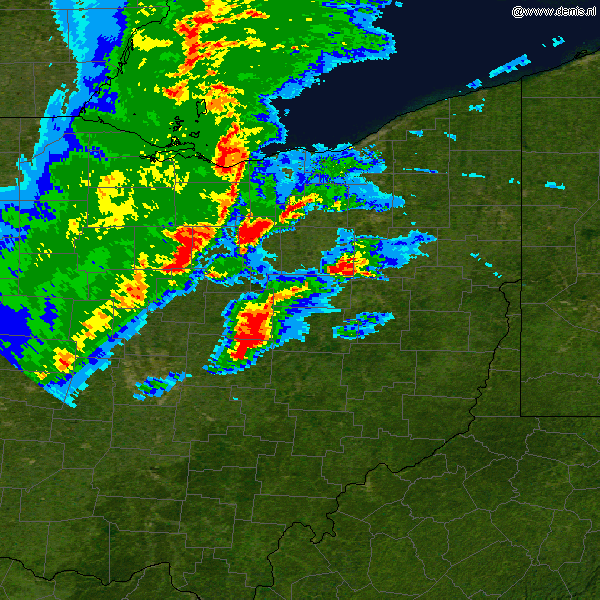
Using the Mapserver utiltiy 'shp2img', you can create complex map images with a single command-line call and a Mapserver configuration file (map file).
Check out the example Unix script and Mapserver Map File to see how the image below was created.
The states and county shapefiles were downloaded from the NOAA/NWS AWIPS Shapefile Database. The map background is the NASA Blue Marble image downloaded from a Web Map Service (WMS).

Top of page
Please contact Steve Ansari ( Steve.Ansari@noaa.gov ) if you have specific questions or comments about this software.
http://www.ncdc.noaa.gov/wct/batch.php
Created by Steve.Ansari@noaa.gov
Last Updated Monday, 17-May-2021 10:30:51 EDT by Steve.Ansari@noaa.gov
Please see the NCEI Contact Page if you have questions or comments.
Created by Steve.Ansari@noaa.gov
Last Updated Monday, 17-May-2021 10:30:51 EDT by Steve.Ansari@noaa.gov
Please see the NCEI Contact Page if you have questions or comments.