Application Images
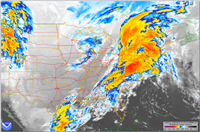
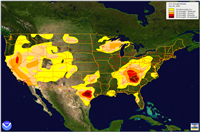
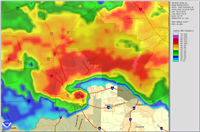
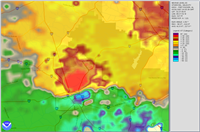
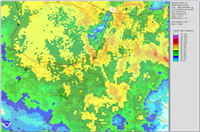
These images show data exported from the Toolkit in different external applications.
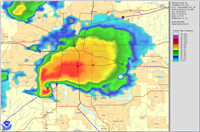
Moore, OK 2013 Tornado:
NEXRAD Level-II Reflectivity volume scan and derived isosurfaces viewed in Google Earth.
The Camtasia Studio video content presented here requires JavaScript to be enabled and the latest version of the Macromedia Flash Player. If you are you using a browser with JavaScript disabled please enable it now. Otherwise, please update your version of the free Flash Player by downloading here.
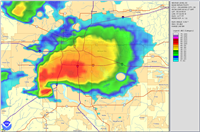
Moore, OK 2013 and 1999 Tornado Comparison:
NEXRAD Level-II Reflectivity derived isosurfaces viewed in Google Earth.
The Camtasia Studio video content presented here requires JavaScript to be enabled and the latest version of the Macromedia Flash Player. If you are you using a browser with JavaScript disabled please enable it now. Otherwise, please update your version of the free Flash Player by downloading here.
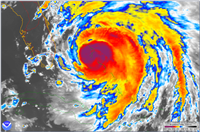
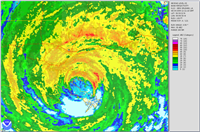
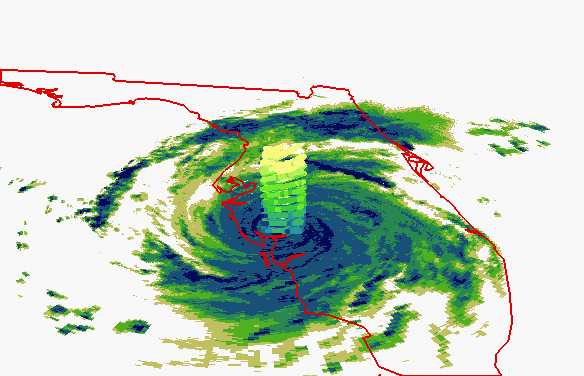
Hurricane Charley (2004):
3-D Enabled Point Shapefile NEXRAD Level-II Reflectivity export viewed in ESRI ArcScene.
Heights in image are not to scale. (Click to animate)
http://www.ncdc.noaa.gov/wct/mediarss/index.php
Created by Steve.Ansari@noaa.gov
Last Updated Monday, 17-May-2021 10:30:51 EDT by Steve.Ansari@noaa.gov
Please see the NCEI Contact Page if you have questions or comments.
Created by Steve.Ansari@noaa.gov
Last Updated Monday, 17-May-2021 10:30:51 EDT by Steve.Ansari@noaa.gov
Please see the NCEI Contact Page if you have questions or comments.
