The data presented in this drought report are preliminary. Ranks, anomalies, and percent areas may change as more complete data are received and processed, but they will not be replaced on these pages.
|
Contents Of This Report: |

|
National Drought Overview

|
|
Percent area of the U.S. very warm, very cold, very wet, or very dry for January-December 2017. Very warm and very wet are defined as temperatures or precipitation in the upper tenth percentile of the historical record. Very cold and very dry are defined as temperatures or precipitation in the lowest tenth percentile of the historical record.
The atmospheric circulation patterns of 2017 varied considerably from month to month (upper-level 500-mb circulation anomaly maps over North America for January, February, March, April, May, June, July, August, September, October, November, December). But when integrated across seasons and over the year (upper-level 500-mb circulation anomaly maps over North America for January-March, April-June, July-September, October-December), one can see above-normal circulation anomalies occurring more often over the contiguous U.S. (CONUS) than below-normal circulation anomalies. The above-normal circulation anomalies are associated with upper-level ridging, and ridges are usually associated with above-normal temperatures and below-normal precipitation. Below-normal circulation anomalies are associated with cooler-than-normal temperatures. With near- to above-normal circulation anomalies dominating much of the country for much of the year, warmer-than-normal temperatures tended to dominate in most months (standardized temperature anomaly maps for January, February, March, April, May, June, July, August, September, October, November, December). Above-normal temperatures enhance evapotranspiration which worsens drought conditions, especially in the summer months. Evapotranspiration was above-normal during 2017, especially in the central to eastern CONUS. Several regions of the country experienced very dry conditions beneath the transient ridges from month to month and, in many cases, the dryness was exacerbated by enhanced evapotranspiration (Palmer Z Index maps for January, February, March, April, May, June, July, August, September, October, November, December). Severe drought developed in those areas where dryness persisted for several months.
But the extreme circulation anomalies also resulted in very wet episodes during some months in some regions. These wet events mask some of the dry episodes on the statewide-scale and seasonal-scale analyses. They also resulted in a year that was characterized by both wet and dry extremes, sometimes in different parts of the country during the same month, and at other times in the same part of the country during different months.
The year started out on the wet side, with over a third of the CONUS experiencing very wet anomalies (monthly precipitation totals at the 90th percentile of the historical record or wetter) during January. A fourth was very wet in April and a fifth very wet in August. For most months from January to October, 10 to 20 percent of the CONUS experienced very wet conditions. During the first five months of the year, only February had more than ten percent of the CONUS experiencing very dry precipitation anomalies (at the tenth percentile of the historical record or drier). Extreme dryness occurred more frequently beginning in June, with more than ten percent of the CONUS very dry in June, July, September, and October. The spigot turned off during last two months of 2017, with a fourth or more of the CONUS very dry in November (25.8 percent) and December (30.1 percent) and less than five percent of the CONUS very wet during these two months. When averaged together, the wet and dry anomalies resulted in the 21st driest November and ninth driest December in the 1895-2017 historical record.
Unusual warmth characterized most of 2017. All but four months (May, September, October, and December) had about 20 percent or more of the CONUS experiencing very warm temperature anomalies (at the 90th percentile of the historical record or warmer), six had more than 30 percent very warm, and two had more than half of the country very warm — February (67.7 percent) and March (51.7 percent). Only May had less than ten percent very warm. And only one month (August) had more than one percent of the country experiencing very cold temperature anomalies (at the tenth percentile of the historical record or colder), and that was only 17.4 percent of the CONUS very cold. When averaged across the country, the cold and warm temperature anomalies resulted in a top ten warmest month for February (second warmest), March (ninth warmest), July (tenth warmest), and November (tied for eighth warmest).

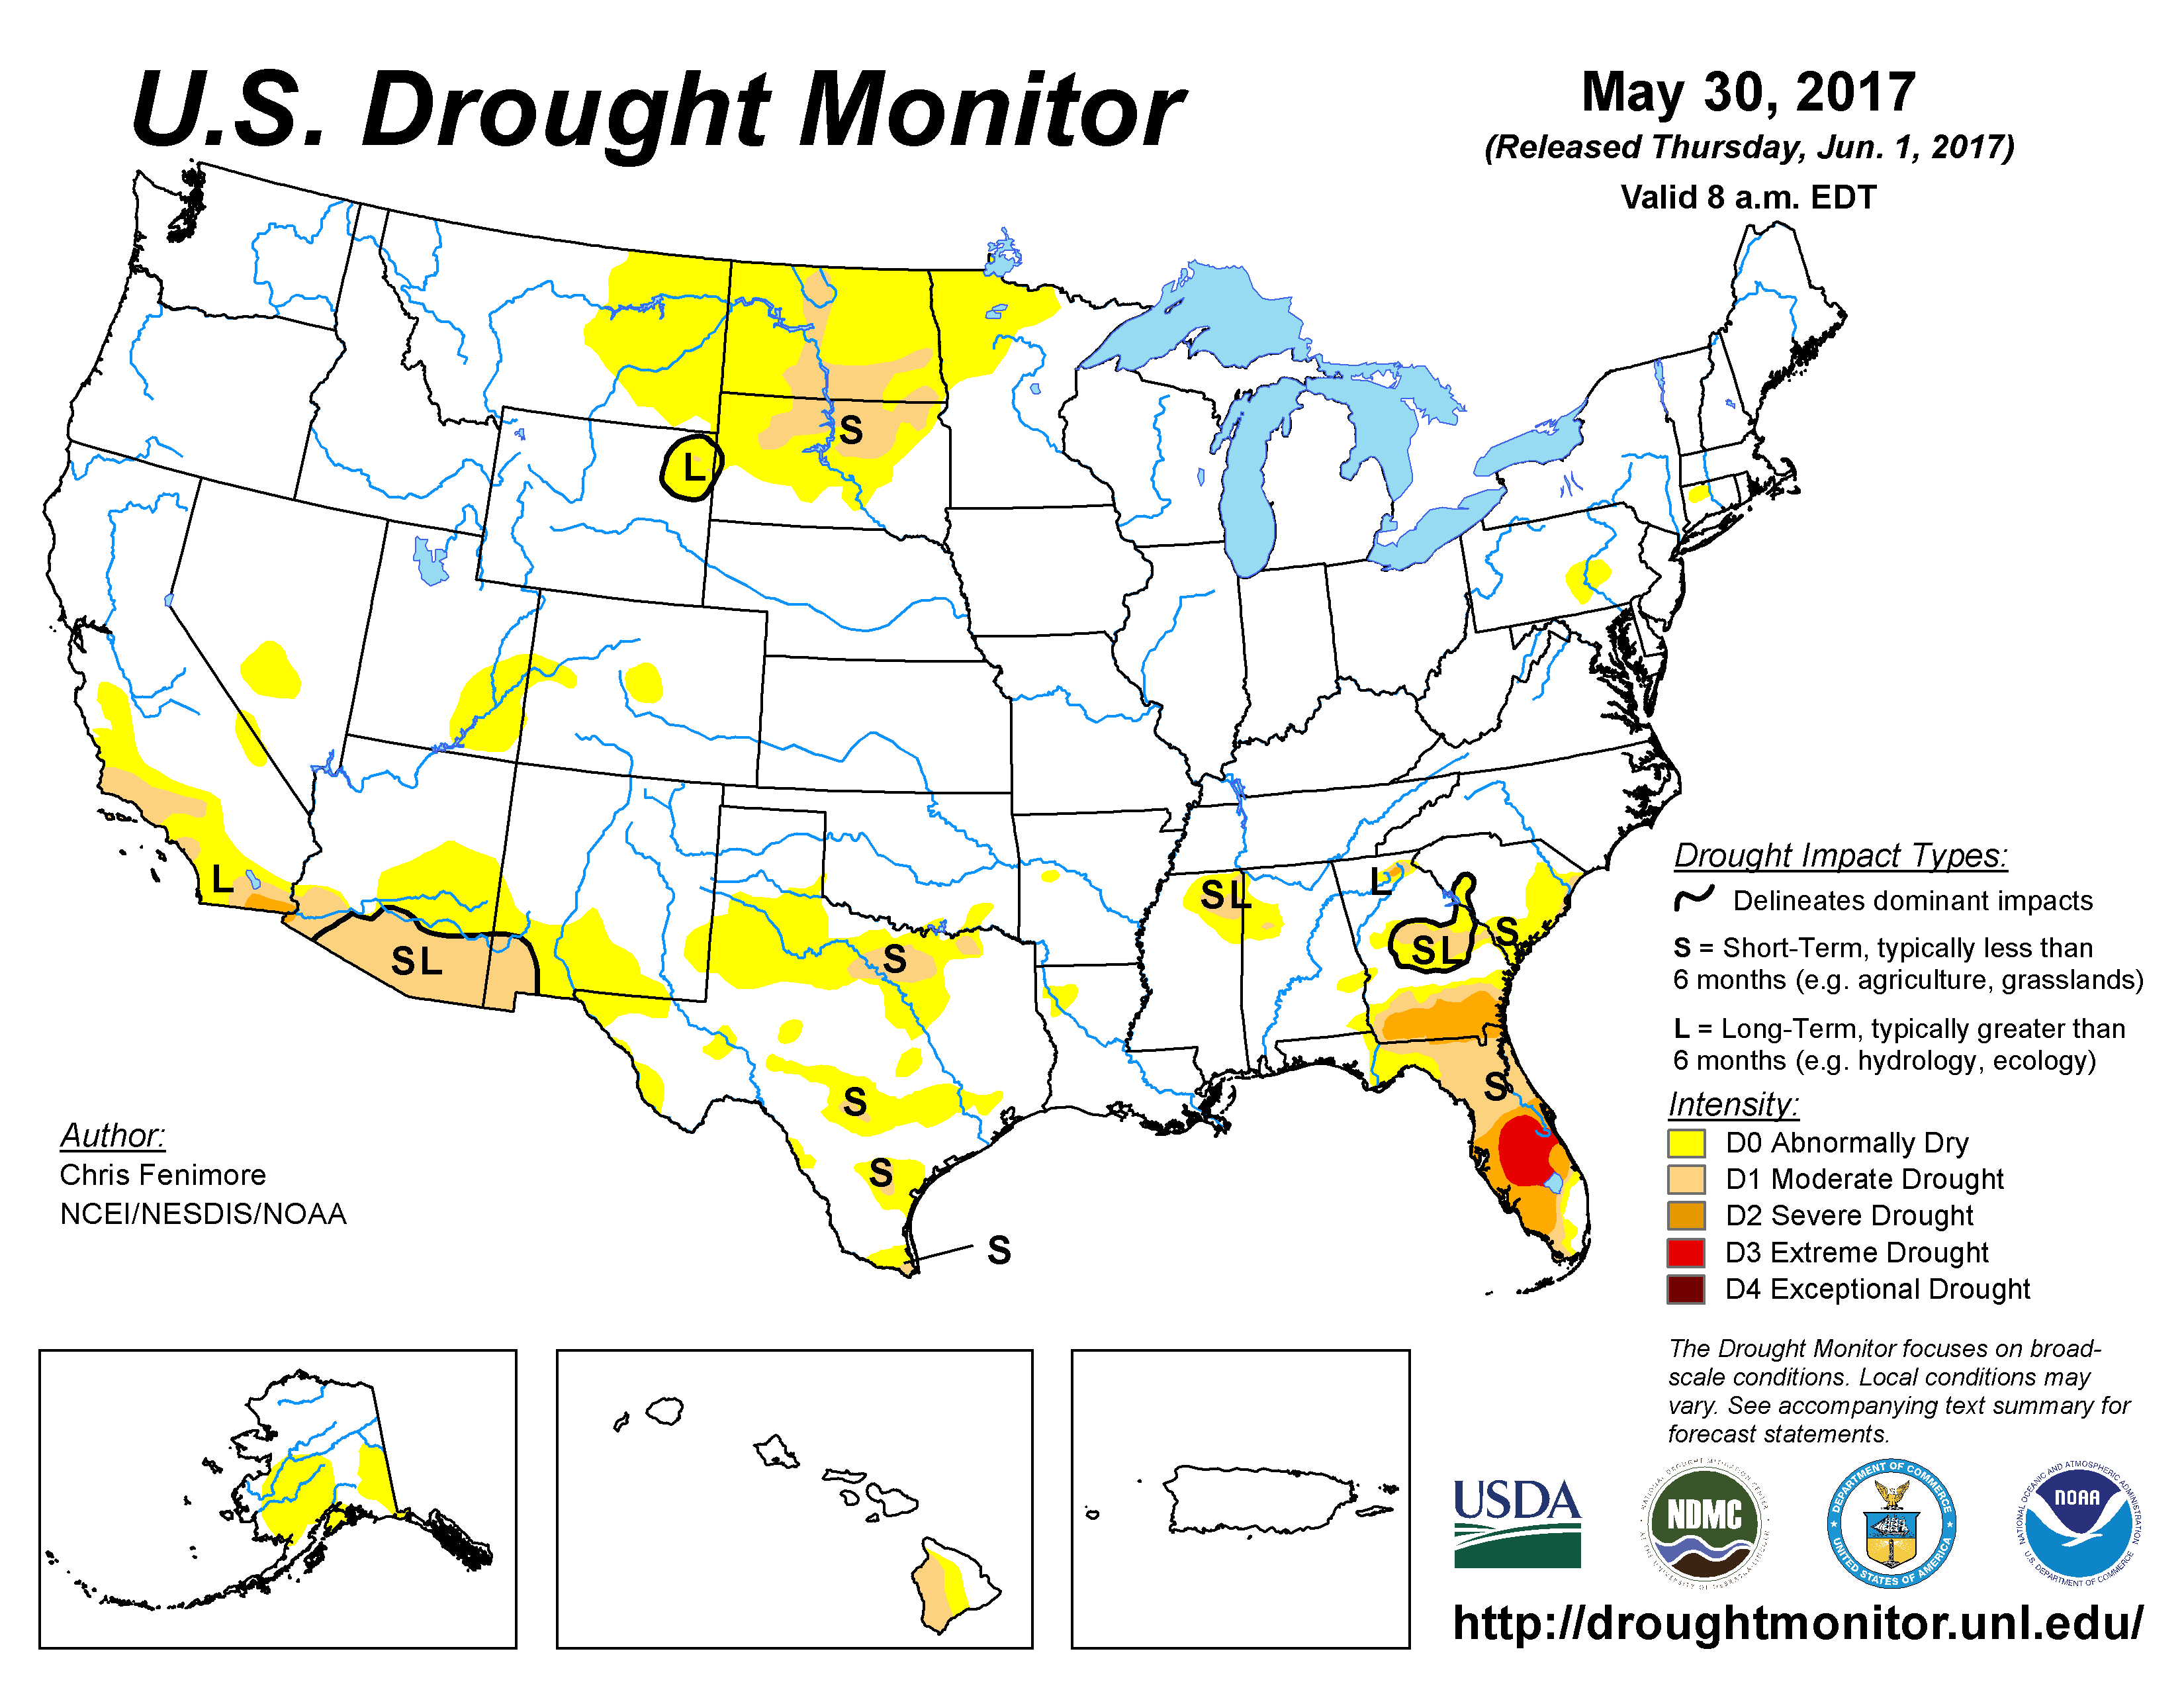
On a national scale, broadly speaking, during 2017 drought waxed, then waned, then waxed again. The year began with drought lingering in parts of the West, Plains, Southeast, and Northeast, covering about 22.5 percent of the CONUS according to U.S. Drought Monitor (USDM) statistics. Abundant winter and spring precipitation reduced or eliminated drought in all of these areas so that, by late spring, drought remained in only a few parts of the Southwest, northern Plains, and Southeast. The minimum drought area was reached on May 23 when 4.5 percent of the CONUS was affected by moderate to exceptional drought, which is a record low in the 1999-2017 USDM record. But dry conditions, coupled with unusually hot temperatures, plagued many areas during the summer and autumn. As noted earlier, hot temperatures increase evapotranspiration which makes droughts worse. The northern Plains were especially hard hit, with Montana, North Dakota, and South Dakota becoming the epicenter of the summer drought. By the end of summer, drought and dryness were spreading into the Pacific Northwest and Midwest (mainly Iowa), but they were all but eliminated from the Southeast. During the autumn months, wet conditions helped shrink drought some in the northern Plains, but dryness returned to the southern half of the country with drought returning or expanding in the Southwest, southern Plains to Lower Mississippi Valley, and Southeast. By the end of December, drought continued in these regions, with drought and abnormal dryness expanding across the Great Plains, further into the Midwest, and up the coast into the Mid-Atlantic region and parts of the Northeast, covering 27.7 percent of the CONUS.
Palmer Drought Index* monthly statistics, which go back to the beginning of the 20th century, indicate that 7.2 percent of the CONUS was in moderate to extreme drought by the end of January. The national drought area expanded during the late winter and early spring, reaching a peak of 15.6 percent by the end of March. It dropped to 4.9 percent by May, stayed below 10 percent during the summer, then rose to 24.8 percent by the end of December.

|
|
*This drought statistic is based on the Palmer Drought Index, a widely used measure of drought. The Palmer Drought Index uses numerical values derived from weather and climate data to classify moisture conditions throughout the contiguous United States and includes drought categories on a scale from mild to moderate, severe and extreme.
The Palmer Z Index incorporates moisture supply (precipitation) and moisture demand (evapotranspiration) to depict the total moisture status each month. The Palmer Z Index maps below show the monthly moisture status for each month in 2017:
 |
 |
 |
 |
 |
 |
 |
 |
 |
 |
 |
 |
[top]
Regional Drought Overview
Northern Plains:
|

|

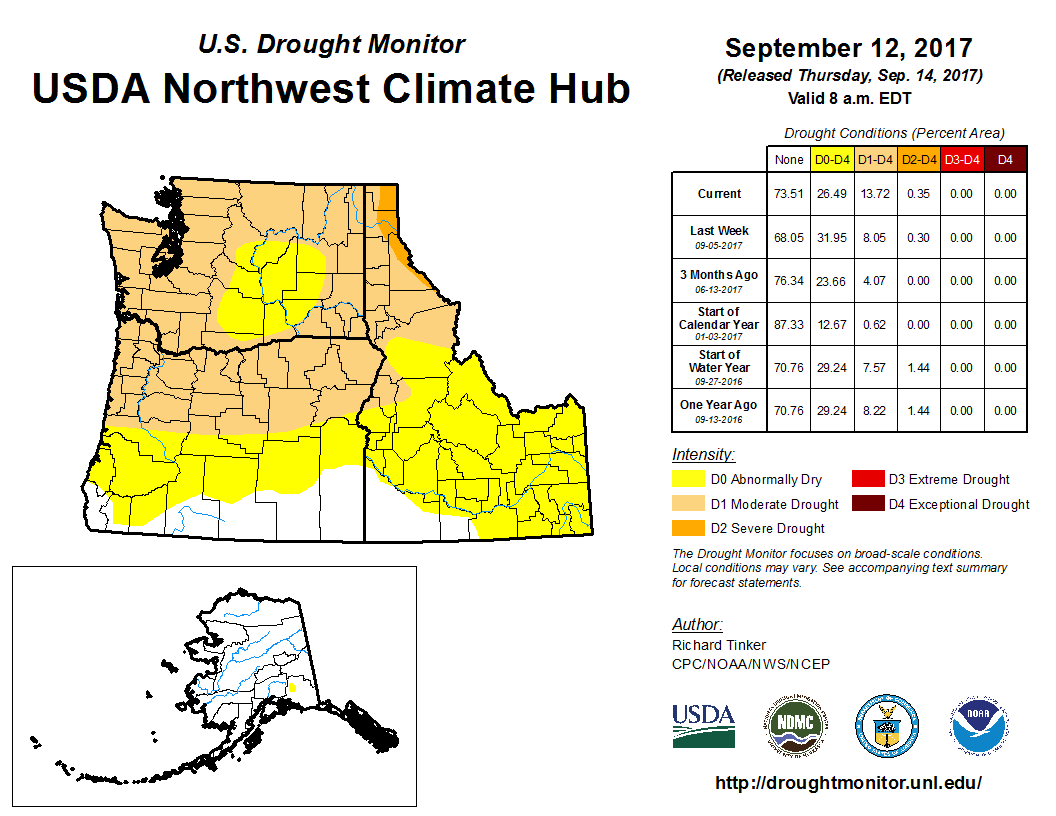
September 12, 2017 USDM map showing Northern Plains drought.
The northern Plains began 2017 with 16.0 percent of the region in moderate to exceptional drought. Beneficial spring precipitation all but eliminated drought (0.1 percent) by May 16, although 13.1 percent of the region continued abnormally dry. But summer heat and dryness brought a rapid expansion of drought, with 46.5 percent of the region in moderate to exceptional drought by September 12. There was some contraction of drought in some parts of the region after that, but 2017 ended with 32.0 percent of the northern Plains in drought on January 2, 2018.
Montana and the Dakotas were the epicenter of the northern Plains drought in 2017, and in Montana the northeast climate division was hardest hit. Montana had the driest July-August, second driest June-August and May-August, sixth driest April-August, eighth driest March-August, and 12th driest November-August. North Dakota had the third driest March-July and January-July, sixth driest December-July, ninth driest November-July, and 11th driest October-July. South Dakota had the 13th driest March-July and 16th driest January-July.
| Northeastern Montana (climate division 6) had record dry conditions for much of 2017, especially through August. Record dry periods included all time periods from November 2016-August 2017 through June-August 2017. Even October 2016-August 2017 was the third driest such period on record. Even with wetter conditions after August 2017, northeastern Montana still had the driest May-December and March-December. Also remarkable is the 2017 dryness followed several years of unusual wetness. |
|
The unusual heat combined with the exceptional dryness resulted in a rapidly declining Palmer Hydrological Drought Index (PHDI), which integrates moisture supply and demand over time. The PHDI for northeast Montana reached extreme drought levels (a value of -4.90) by August 2017. While this severity level rivals the droughts of the 1930s, 1950s-60s, and 1980s, the duration of dryness in 2017 was much shorter than those other extreme droughts. The PHDI for adjacent southwest North Dakota (climate division 7) also rapidly declined in 2017 (reaching a value of -5.43 by July), which also rivaled the 1930s and 1980s droughts.

|

|
As summarized by the High Plains Regional Climate Center:
- Wet and dry conditions were both present throughout the region during 2017. Much of the High Plains experienced a wet winter, and the southern portion of the region had a wet spring as well. Meanwhile, the summer was dry for most, and the fall brought both wet and dry conditions. The major precipitation stories of the year included the high snowpack in the Rockies and the Northern Plains drought. Mountain snowpack was plentiful throughout Wyoming and Colorado, and spring runoff caused streams to flood. However, the Dakotas and Montana experienced drought, which developed during the late spring and peaked during the summer, impacting crops and livestock. In the Northern Plains, spring wheat did not fare well due to summer drought conditions. The drought dried up pastureland and created a hay shortage, forcing ranchers to find alternative feed or sell off livestock.
- The High Plains had a mix of wet and dry conditions in 2017. For instance, Alamosa, Colorado and Goodland, Kansas had their 6th wettest and 8th wettest years on record, respectively, while it was the 3rd driest year on record for Grand Junction, Colorado and Dickinson, North Dakota, and 8th driest for Rapid City, South Dakota. June, November, and December brought below-normal precipitation to much of the region, causing drought development and expansion.
- Contrary to 2016, drought was an issue in the region in 2017, impacting several areas but particularly the Northern Plains. At the beginning of the year, abnormally dry or drought conditions (D0-D4 intensity categories on the USDM map) were impacting about half of the High Plains region, including eastern Wyoming, western South Dakota, eastern Colorado, southwestern and central Nebraska, and western Kansas. This depiction changed very little throughout the winter months, and then conditions began to gradually improve throughout the spring, thanks to heavy precipitation in drought-stricken areas. Then, extremely dry conditions caused drought to develop in May in the Dakotas and eastern Montana, expanding and intensifying rapidly in June and July. In August, cooler and wetter weather provided some relief, while heavy rains in September vastly improved conditions. However, dryness returned in October, and with frozen soils and the growing season over, conditions changed very little throughout the rest of the year. Impacts from the drought were mostly agricultural in nature, as field crops were damaged and the lack of feed forced ranchers to sell off their livestock. The drought also contributed to an active wildfire season, particularly in Montana where over 1 million acres were burned. By the end of the year, 80 percent of the High Plains region was experiencing abnormally dry or drought conditions.
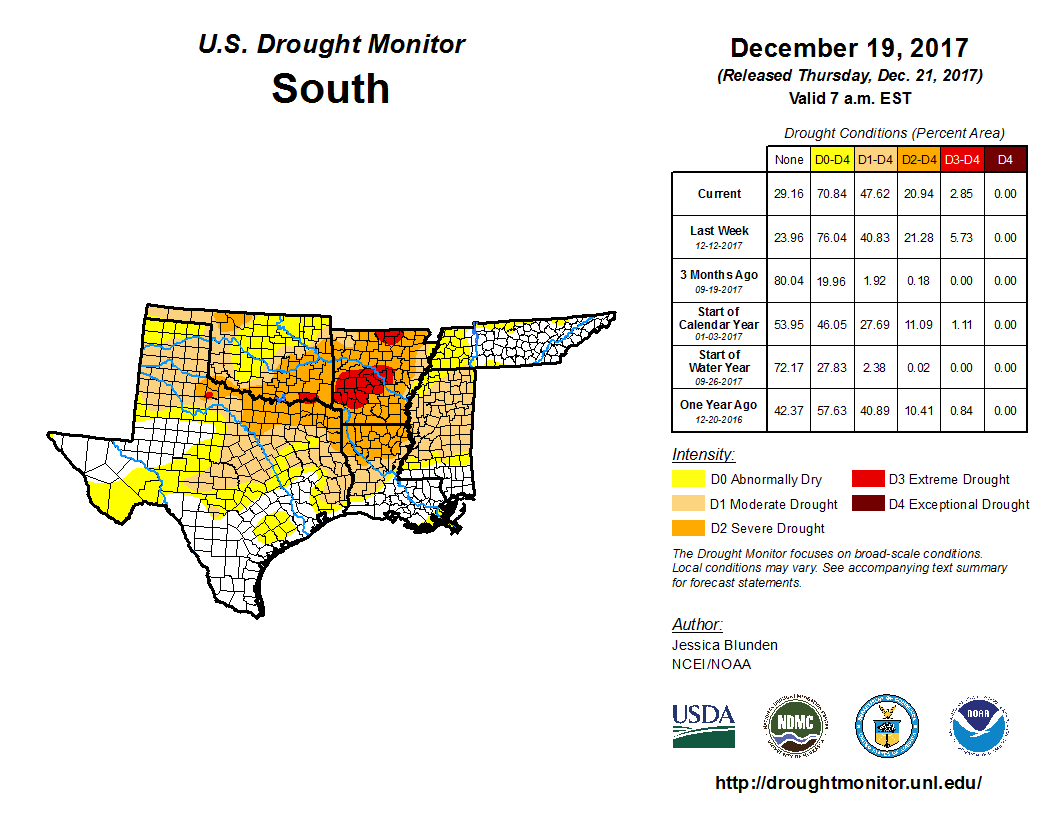
Southern Plains to Lower Mississippi Valley:
 |
The year began with about a fourth (27.7 percent) of the southern Plains to Lower Mississippi Valley experiencing moderate to extreme drought. By April the drought area had dropped below 10 percent, reaching a minimum of 0.4 percent on August 29. But very dry conditions during the autumn and early winter rapidly expanded the drought area, reaching a peak of 47.6 percent of the region on December 19.
| Arkansas had the driest September-November; Louisiana the fourth driest September-December; Oklahoma the ninth driest November-December and fifth driest November; Mississippi the third driest November; and Texas the 12th driest October-November. |

|
Western Oklahoma and parts of Arkansas were especially dry. Oklahoma climate division 1 had the driest November-December, division 2 the fifth driest November-December, division 4 the sixth driest November-December, and division 9 the seventh driest September-December. Arkansas climate divisions 4, 5, 7, and 8 had the driest September-November; divisions 2 and 9 the second driest September-November; division 3 the sixth driest September-November; and division 1 the seventh driest September-December.

|

|
As summarized by the Southern Regional Climate Center:
- The 2017 annual precipitation totals indicate that precipitation for the year varied spatially over the Southern region, but the values do not provide a clear picture of how precipitation varied temporally over the year. This is mostly because many areas within the region experienced periods of wet conditions, which were interrupted with dry spells and in the case of the fall, wide-spread drought. The year started drier than normal for the northern part of the region. March was a dry month for most of the region and abnormally dry conditions expanded into the southern part of the region. In April, much-needed rain came into the region and caused most of the region to return back to normal conditions. This was also the case in May; however, only Texas and Oklahoma experienced a drier than normal month. Conditions in June were slightly wetter than normal with Mississippi recording its fifth wettest June on record (1895-2017). July brought slightly drier conditions for the southern states (Texas, Louisiana, and Mississippi). In August, Hurricane Harvey made landfall and stalled over Texas, causing historic rainfall amounts throughout the region. All states, except Tennessee, recorded one of their top ten wettest Augusts on record. Texas had its wettest August on record while Louisiana had its second wettest. In fall, drought conditions developed across much of the northern and central part of the Southern region, and by the end of November, extreme drought conditions were present in Arkansas. Welcomed rainfall in December helped alleviate some of the extreme drought conditions. By the end of the year, the amount of drought increased from approximately 49.54 percent areal coverage in the region to just under 74 percent.
- The Southern region experienced a drier than normal autumn during September through November 2017. Autumn 2017 in the Southern region ranked as the 12th driest, with a regional total of 5.58 inches of precipitation. Arkansas had its driest autumn on record (since 1895) and Louisiana had its fifth driest autumn on record. Three other states had drier than normal autumns as well: Texas (16th driest), Oklahoma (35th driest), and Mississippi (23rd driest). Central Louisiana, western Arkansas, southern Mississippi, eastern Oklahoma, and northeastern and southeastern Texas received less than 25 percent of normal precipitation for September. Most of Louisiana and Arkansas received 25-50 percent of normal precipitation. Louisiana had its driest September on record and Arkansas had its eighth driest September on record. Parts of western Tennessee, northern and central Mississippi, northeastern, central and southern Arkansas, northern, central, and southwestern Louisiana, south central Oklahoma, and central, southern, and western Texas received 50 percent or less of normal precipitation during October. There were a few areas of 5 percent or less of normal precipitation in central and western Texas and the panhandle of Oklahoma. Precipitation values for the month of November were below normal for most of the Southern region. All of Arkansas and Oklahoma, most of Louisiana and Mississippi, and parts of Tennessee and Texas received 50 percent or less of normal precipitation. There were a few areas of 5 percent or less of normal precipitation in northern, western, and southern Texas, southeastern Louisiana, and northern and southeastern Oklahoma. In November, four states had one of their top ten driest Novembers ever recorded: Arkansas (fourth), Louisiana (tenth), Mississippi (third), and Oklahoma (fifth).
Mid-Mississippi Valley:
The Mid-Mississippi Valley (located in the western portions of the Midwest region) experienced drought at times during 2017. The year began with 4.5 percent of the Midwest region in moderate drought. The drought area peaked at 13.6 percent on March 21 before rapidly declining to zero by the end of April. Drought returned in June, peaking again at 11.9 percent on October 3. The year ended with 9.5 percent of the Midwest region in moderate to extreme drought.
|

|
Iowa, Missouri, and Illinois were the epicenter of the Midwest drought. Missouri had the fifth driest September, sixth driest November-December, seventh driest February, and ninth driest September-December. But the dryness had its origins in late 2016, with December 2016-February 2017 ranking eighth driest, November 2016-February 2017 sixth driest, and October 2016-February 2017 fifth driest. Illinois had the fourth driest August-September, fifth driest September, seventh driest December, and ninth driest February. Iowa had the fifth driest December and sixth driest November-December. The drought area peaked at 79.2 percent of Missouri on March 21, 44.6 percent of Iowa on August 15, and 17.1 percent of Illinois on March 7-28.
As summarized by the Midwest Regional Climate Center:
- Drought in the Midwest during 2017 was limited in areal coverage but still intense in a few locations. The year began with moderate drought mostly in Missouri. Drought expanded to a peak at 13 percent of the Midwest in March before spring rains wiped out all Midwest drought. In early May, there was no drought and no abnormally dry areas in the region for the first time since May of 2002. Late summer and fall saw new drought development around the region with southern Iowa having extreme drought from mid-August to early October. Areal coverage peaked at about 12 percent of the region in early October when scattered areas of drought touched every Midwest state except Kentucky. In the last three months of 2017, drought expanded in Missouri and neighboring parts of Iowa and Illinois while ending in other parts of the Midwest except in north central Minnesota.
Southwest:
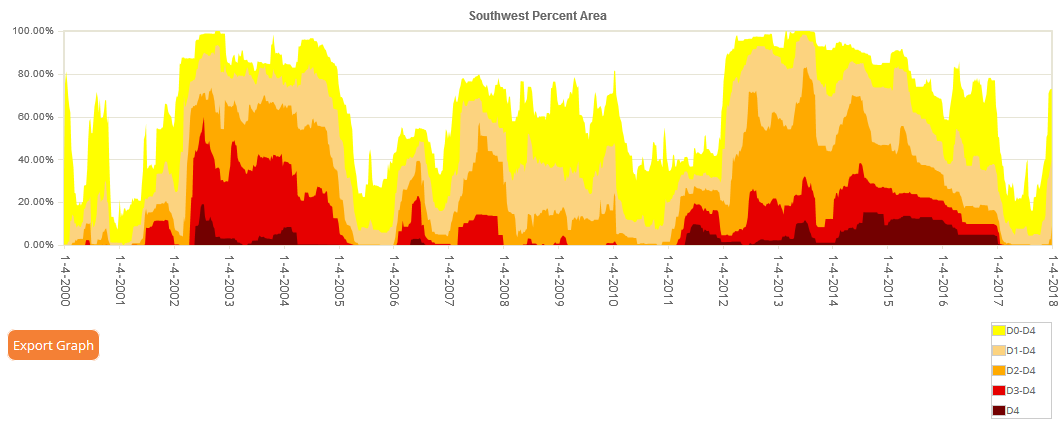 |
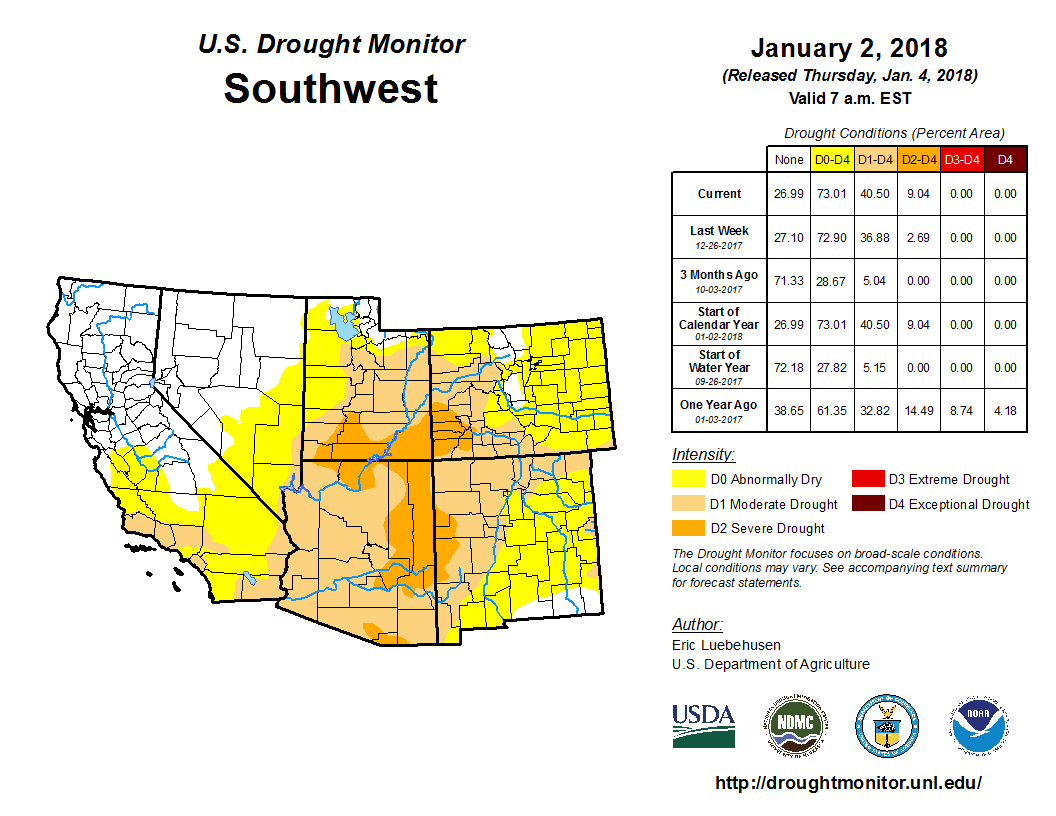
The Southwest began 2017 with 32.8 percent of the region in moderate to exceptional drought. Beneficial winter and spring precipitation shrank the drought area to 4.6 percent of the region by May 2, 2017. This broke a nearly 7-year period of drought, as the last time the drought area for this region was comparable to this value occurred on November 2, 2010 with 7.2 percent. Drought expanded a bit during the summer, reaching 8.7 percent of the region by July 11, and contracted again in the early fall. But the normal late fall and early winter precipitation failed this year, with drought expanding to 40.5 percent of the region by January 2, 2018.

|

|
California had the second driest December and 14th driest October-December in 2017, Nevada the ninth driest October-December, Utah the fifth driest October-December, Arizona the fourth driest October-December, Colorado the seventh driest October-December, and New Mexico the sixth driest November-December.
As summarized by the Western Regional Climate Center:
- The West experienced extreme weather and climate events in 2017. The exceptionally wet winter of 2016/2017 alleviated some of the impacts of one of the worst droughts on record in California and Nevada while producing widespread flooding and landslides. A record hot summer produced hazardous fire conditions and the heat, combined with dry conditions, caused severe drought to develop in Montana. Heat extremes and many large and destructive fires impacted the West throughout summer and well into autumn.
- At the start of the year, drought conditions persisted into a sixth year across the southern two-thirds of California and western Nevada. Approximately 63% of California and 34% of Nevada were experiencing moderate to exceptional drought conditions. The first two months of 2017 were much wetter than normal owing to many atmospheric rivers making landfall on the West Coast. As soils became saturated through the season, mudslides, landslides and flooding began to occur in many areas of the West. These impacts began in January in northern California and the Sierra Nevada, damaging homes and causing prolonged closures of many major roads. In spite of the negative impacts of this anomalously winter, by March, none of Nevada and only 8% of California were classified as having moderate or worse drought conditions. With an above normal snowpack, most of California's reservoirs filled above historical average by the end of the snow melt season. April 1 snowpack was more than 175% of normal in the Sierra Nevada, more than 125% of normal in the Cascades and central Rockies, and near normal in the northern Rockies.
- Areas of Montana east of the Rockies typically see their wettest months of the year during the spring and summer. However, this year, conditions were much drier than normal. Glasgow reported its driest year in a 70-year record at 6.64 in (169 mm), 57% of normal. A lack of precipitation combined with above normal temperatures produced severe drought conditions. In June, the Montana governor declared a drought emergency in 19 counties in eastern Montana and on two Native American reservations. Range and pasture conditions were poor, and various crops such as oats, spring wheat, and sugar beets were suffering. By mid-August, 90% of the state was categorized as moderate to extreme drought in the USDM. The autumn season brought above normal precipitation to the region, providing some relief. At the end of the year, 52% of the state was categorized as moderate or worse drought conditions.
- The onset of autumn precipitation favored the Northwest and northern California, leaving the Southwest drier than normal. Additionally, the southern tier of the West did not experience the plentiful precipitation of the preceding wet season, and monsoon rains were lackluster for many locations. Arizona and New Mexico observed their warmest September-November on record, and Arizona reported its third driest such period. The hot and dry conditions allowed for moderate to severe drought conditions to persist or expand across Arizona, southern Utah, the Four Corners Region, and coastal southern California during autumn.
- During December, a stubborn area of high pressure settled over the West, keeping much of the region drier than normal. December is typically the wettest month of the year at Blue Canyon in California's Sierra Nevada, but this year it only received 0.88 in (22 mm) of precipitation, 8% of normal. This dry start to the wet season raised concerns about a return to drought conditions for California, Nevada, and persistence and expansion of existing drought conditions across the Southwest in 2018.
Pacific Northwest:
| July, August, and September were dry across parts of the Pacific Northwest, especially Washington state which had the third driest July-September on record. Drought peaked at 13.7 percent of the region on September 12 before fading away by November. |
|
Southeast:
 |
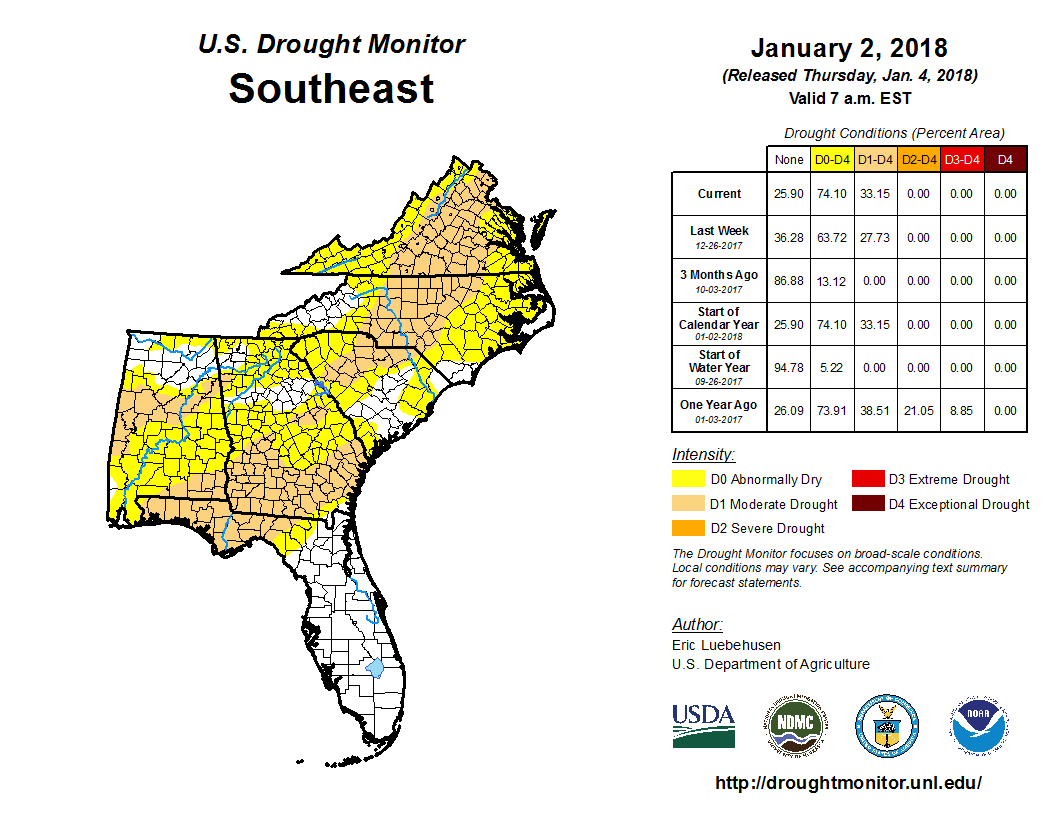
More than a third (38.5 percent) of the Southeast was in drought when 2017 began. Dry conditions during late winter and early spring expanded the drought area to 44.6 percent by April 18, but rains during the late spring and early summer eliminated all drought areas by the beginning of July. A very dry November and December led to the rapid return of drought, with moderate drought expanding once again to a third (33.2 percent) of the region by January 2, 2018.

|
|
Virginia had the third driest November-December and seventh driest February-March, Georgia the fourth driest February-March, South Carolina had the fifth driest February-March, Alabama the sixth driest November-December, Florida the seventh driest February-March, and North Carolina the ninth driest February-March. As seen in these state time series, of note is the dry trend the Southeast has experienced during February-March of recent years.
As summarized by the Southeast Regional Climate Center:
- Annual precipitation totals were near-average to above-average across much of the Southeast region, with pockets of unusual dryness occurring in several areas. The driest locations were found across relatively small portions of central Virginia, central and far western North Carolina, north-central South Carolina, west-central and northwestern Alabama, and southwestern Georgia. Annual precipitation totals were 6 to more than 12 inches (152 to more than 305 mm) below average in these areas. The lowest annual precipitation total for any station (excluding CoCoRaHS) across the region was recorded in Louisa, VA (1917-2017), which observed its fifth driest year on record with only 30.27 inches (769 mm) of precipitation.
- After peaking in intensity during autumn 2016, moderate-to-extreme (D1-D3) drought conditions gradually improved across interior portions of the Southeast region during winter and spring. Well-above-normal precipitation in January ended the drought across the Florida Panhandle and the southern half of Alabama and Georgia. With unseasonable warmth and below-average precipitation observed during February, drought conditions briefly intensified in northern Georgia and the western Carolinas, while a narrow corridor of moderate-to-severe (D1-D2) drought emerged east of the Shenandoah Valley in northern Virginia and the Washington, D.C. area. In addition, unusual dryness led to the development of moderate drought in parts of central and southern Florida. Well-above-normal precipitation during the spring terminated nearly all of the drought across interior portions of Alabama, Georgia, the Carolinas, and Virginia. Conversely, a persistent lack of spring rainfall produced moderate-to-extreme drought across much of Florida and southern Georgia, covering nearly 72 percent of Florida for the first time since February 2013. Indeed, only 0.10 inches (2.5 mm) of rainfall was observed in Orlando, FL (1892-2017) during March and April, which is its second lowest precipitation total for any two-month period on record. Moultrie 2 ESE, GA (1928-2017) and Tampa, FL (1891-2017) tied their second and fifth highest count of spring days with no measurable precipitation, at 79 and 83 days, respectively. This drought sparked the most active wildfire season since 2011 in Florida, with nearly 1,800 fires observed and over 120,000 acres burned during spring. Following a mostly drought-free summer and early autumn, an area of moderate drought developed in portions of central North Carolina and south-central Virginia during early October. By the end of December, moderate drought covered at least 15 percent of every state in the region, including central Virginia, central North Carolina, north-central South Carolina, southern Georgia, west-central and southeastern Alabama, and the Florida Panhandle.
Northeast:
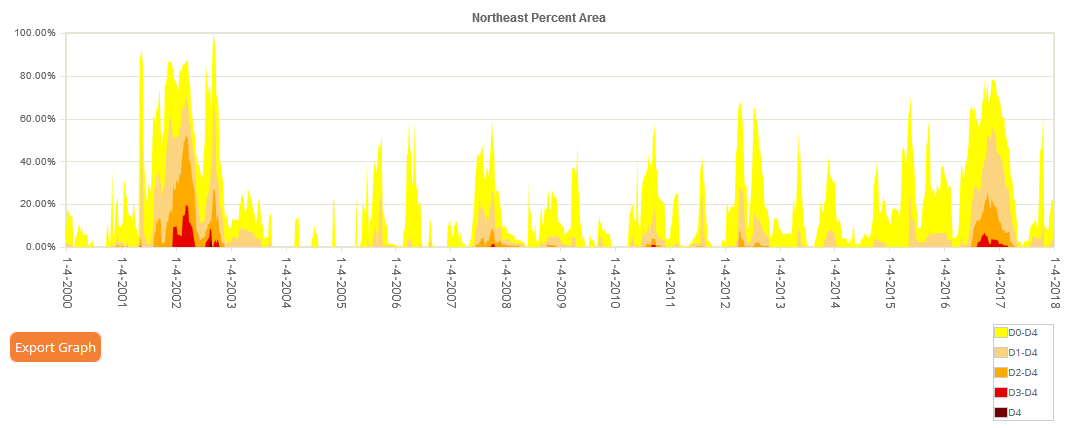 |
The Northeast began 2017 with 43.7 percent of the region in moderate to extreme drought. Beneficial precipitation over parts to all of the Northeast during late winter to mid-summer shrank the drought area to zero percent by May 9. Dryness returned during September, prompting an expansion of drought to 12.3 percent of the region by October 24. Late October precipitation brought the drought area back down to zero, but dryness returned in November and December, closing out the year with 5.3 percent of the Northeast in drought on January 2, 2018.
| Connecticut had the fourth driest November-December, Maryland the fifth driest November-December and seventh driest September-December, Delaware the sixth driest November-December, and New Jersey and West Virginia the eighth driest November-December. |

|
As summarized by the Northeast Regional Climate Center:
- While the Northeast continued to experience drought in January and February, conditions slowly eased. In early March, the Northeast became free of extreme drought and in April, the region became free of severe drought. Conditions continued to improve so that by early May 2017 the region became drought-free for the first time since April 2016. After a nearly three-month hiatus, moderate drought was reintroduced in the region in early August and persisted through most of October. The region was free of drought in November, but moderate drought was introduced again in December. Areas of abnormal dryness lingered through the entire year. The main impact of the dry conditions was below-normal streamflow, groundwater levels, and reservoir levels.
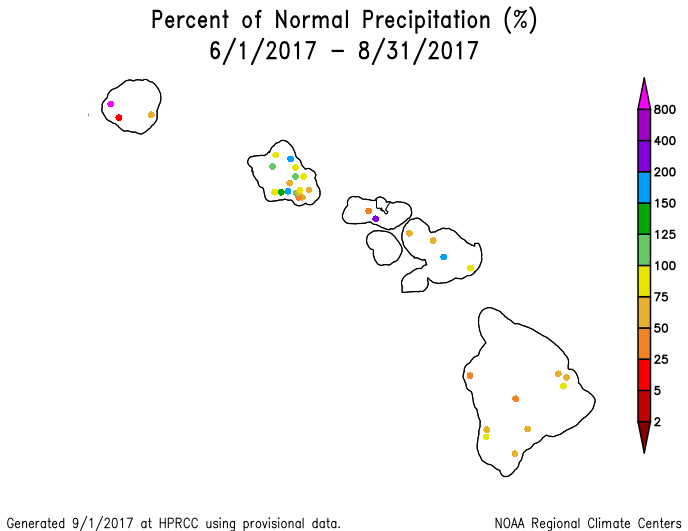
Hawaii, Puerto Rico, and Alaska:

|
| Hawaii began 2017 almost drought-free, with only 2.5 percent of the state experiencing moderate to severe drought. Drier-than-normal weather expanded drought during the spring and summer, with over two-thirds (71.4 percent) of the state in moderate to extreme drought on August 22. Beneficial rains returned in the autumn, shrinking the drought area to 21.3 percent by December 5. |

|
As noted by the Western Regional Climate Center, precipitation averaged to slightly below normal across the state of Hawaii in 2017. A dry start to the year resulted in drought conditions developing by July. By October, 65% of the state was experiencing moderate or worse drought conditions, mostly on Big Island. A wetter period reduced this to 21% by the end of the year. On Kauai, Lihue observed 23.55 in (598 mm) for the year, 64% of normal and the 7th driest year on record.

|
Puerto Rico was drought-free for most of 2017. Moderate drought developed in August, expanding to 13.9 percent of the island by the 15th. Rains in late August and early September brought an end to this brief drought episode. |
| Like Puerto Rico, Alaska was drought-free for most of 2017. Dry conditions accumulated so that moderate drought developed by summer, expanding to 8.1 percent of the state by June 20. Precipitation in late August and early September brought an end to this brief drought episode as well. |

|
U.S.-Affiliated Pacific Islands:
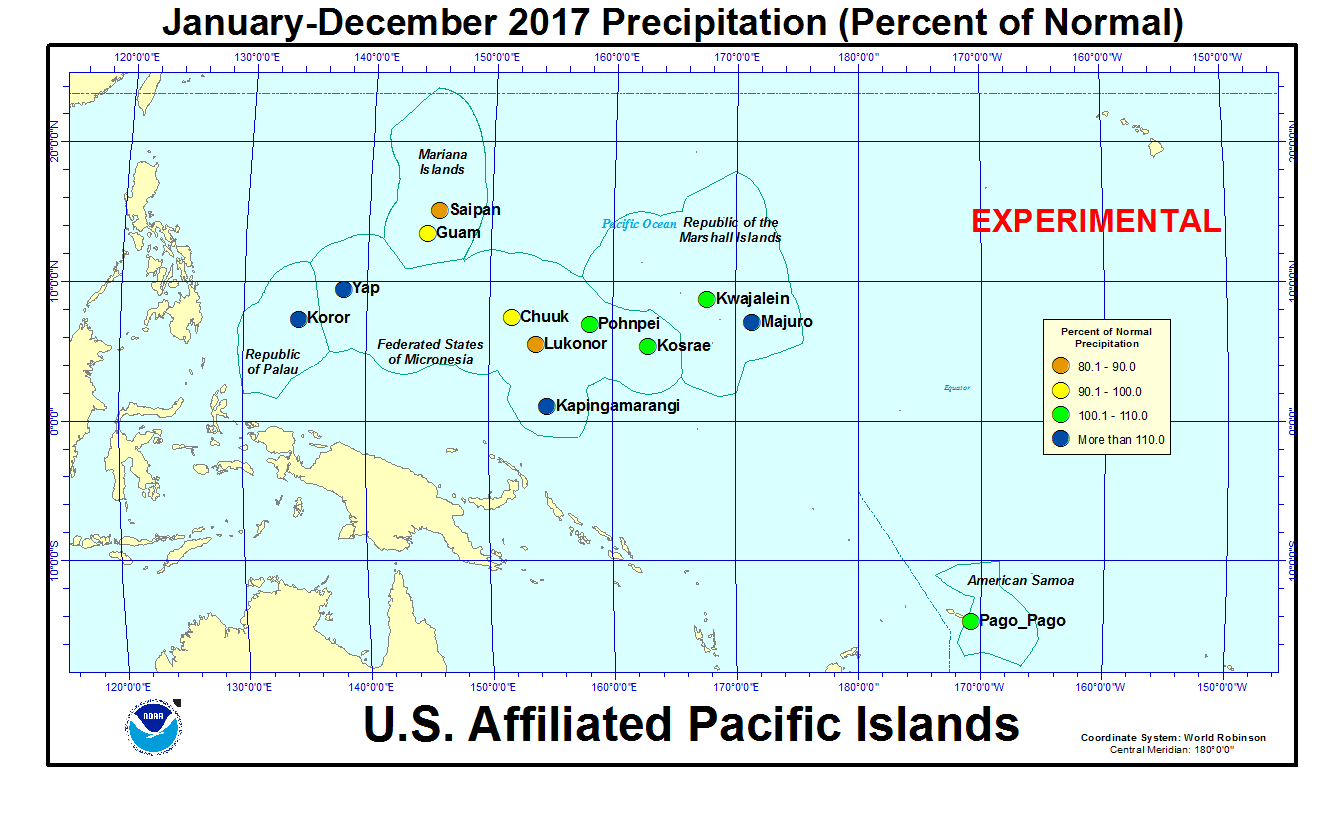
Map showing 2017 percent of normal precipitation for the USAPI.
Some of the U.S.-Affiliated Pacific Islands (USAPI) were dry during part of 2017. In the Marshall Islands, Wotje had the second driest January in 34 years of data. Jaluit had the driest April-October, May-September, and June-August, and second driest March-November, out of 34 years of data. Utirik had the driest April-August out of seven years of data, and the driest April-September in six years of data; the dryness actually began in December 2016, but part of this period had missing data. Ailinglapalap had the second driest May-November in 33 years of data. In the Federated States of Micronesia, Ulithi had the driest May-September and June-August in 35 years of data. Woleai had the fifth driest May-September in 28 years of data, and fifth driest February-November in 22 years of data. Lukonor had the third driest April-September in 21 years of data. Pingelap had the third driest May-October in 33 years of data. In the Marianas, Saipan had the second driest March-November in 36 years of data, and third driest May-October and second driest August-October in 37 years of data.
As discussed by the Western Regional Climate Center, 2017 precipitation was generally 80-110% of normal across the USAPI. The northern Marshall Islands experienced very dry conditions to start the year; household rain tanks had gone dry by late April prompting the president of the Marshall Islands to declare a State of Emergency. Subsequent summer rainfall helped to alleviate these dry conditions.
[top]
Contacts & Questions