|
Contents Of This Report: |


|
Please note that the values presented in this report are based on preliminary data. They will change when the final data are processed, but will not be replaced on these pages.
National Drought Overview
|
|
[top]
Detailed Drought Discussion
Overview

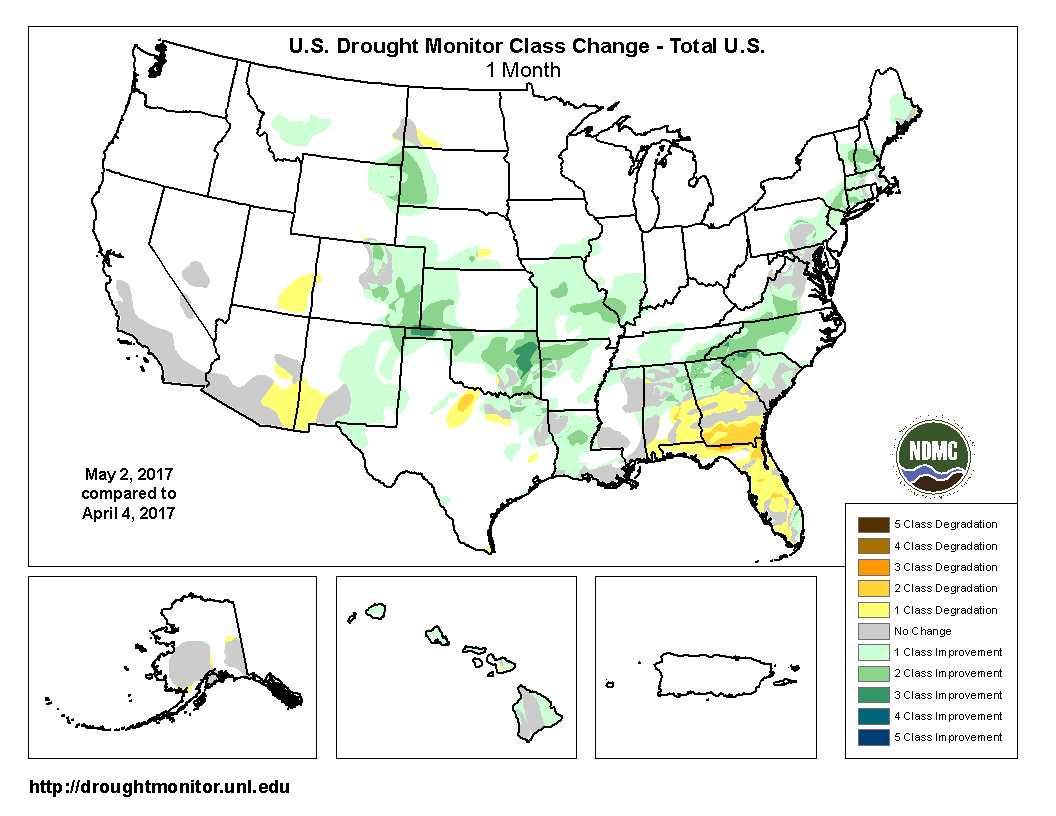
The U.S. Drought Monitor drought map valid May 2, 2017.
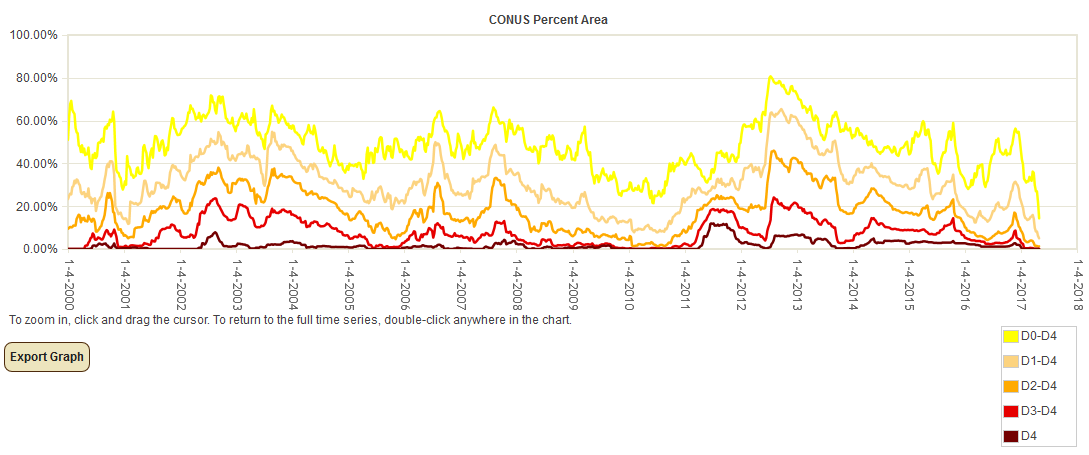
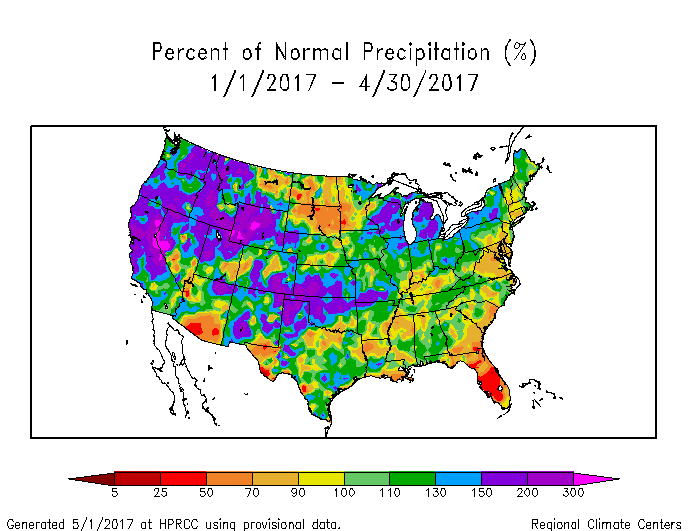
During April 2017, the upper-level circulation over the CONUS consisted of several troughs and slow-moving closed lows which brought above-normal precipitation to much of the country. Areas of drought and abnormal dryness contracted from the Central Rockies to Plains and from the southern Appalachians to New England. Unfortunately, the rain-producing systems mostly missed parts of the Southwest, northern Plains, and Southeast, where drought and abnormal dryness expanded. Abnormal dryness and severe drought contracted in Hawaii, although the net area of moderate to severe drought remained the same. April was drier than normal across Alaska, resulting in a slight expansion of the abnormally dry areas, while the month was wetter than normal across Puerto Rico which remained drought-free. With drought mostly contracting, the USDM-based national moderate-to-exceptional drought footprint decreased across the CONUS from 9.8 percent at the end of March to 5.0 percent at the end of April (from 8.3 percent to 4.2 percent for all of the U.S.). According to the Palmer Drought Index, which goes back to the beginning of the 20th century, about 11.1 percent of the CONUS was in moderate to extreme drought at the end of April, a decrease from last month's 16.6 percent.
Drought conditions at the end of the month, as depicted on the May 2nd, 2017 USDM map, included the following CONUS core drought and abnormally dry areas:
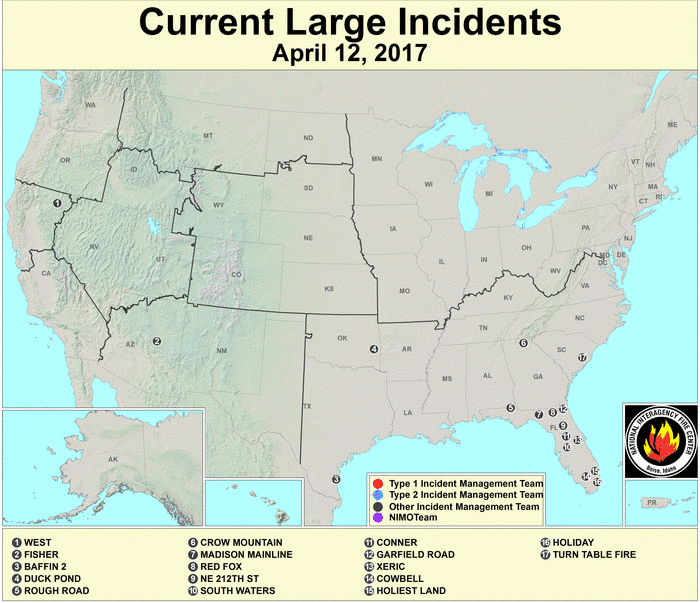
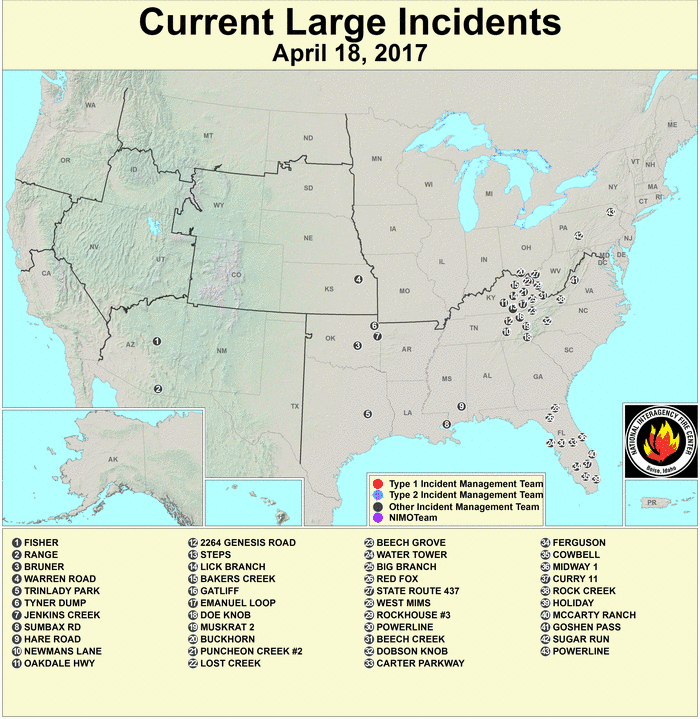
- Abnormal dryness (D0) and moderate (D1) to extreme (D3) drought expanded in parts of the Southeast, especially from southern Alabama and Georgia to Florida. Unusually warmer-than-normal temperatures increased evapotranspiration which dried soils, while the persistently below-normal precipitation contributed to low streamflow and the occurrence of large wildfires (wildfire maps for April 12, 18, 20, 24, 27, 30). According to April 30th U.S. Department of Agriculture (USDA) reports, 73 percent of the topsoil moisture and 68 percent of the subsoil moisture was short to very short (dry to very dry) in Florida, while the statistics were 61 percent for topsoil and 57 percent for subsoil in Georgia.
- Areas of abnormal dryness to severe (D2) drought persisted in parts of southern California to southern Arizona and New Mexico, mainly reflecting long-term dry conditions (at the 36- to 72-month time scales).
- Abnormally dry to severe drought conditions covered parts of Hawaii.
- Pockets of abnormally dry to moderate drought conditions lingered in parts of the mid-Atlantic states and southern New England.
- A few spots of abnormal dryness to moderate drought were found in the southern Plains and Colorado.
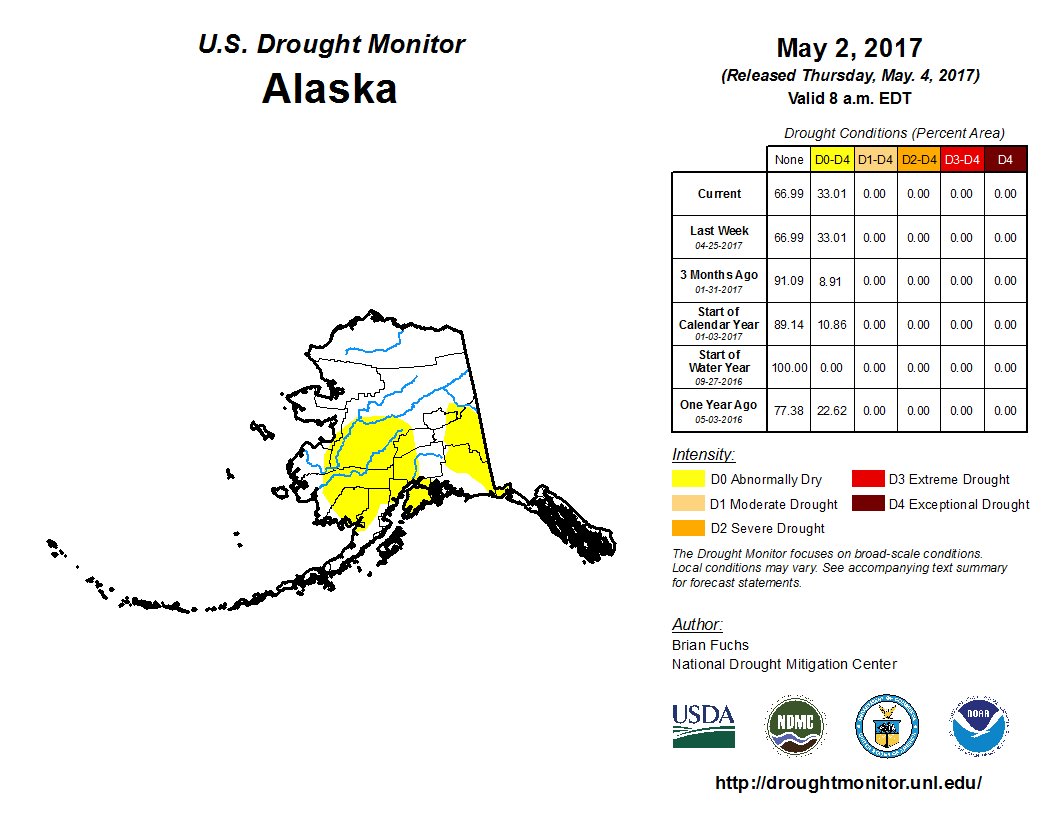
- Abnormal dryness covered a significant portion of Alaska and speckled the northern Plains.
Palmer Drought Index
The Palmer drought indices measure the balance between moisture demand (evapotranspiration driven by temperature) and moisture supply (precipitation). The Palmer Z Index depicts moisture conditions for the current month, while the Palmer Hydrological Drought Index (PHDI) and Palmer Drought Severity Index (PDSI) depict the current month's cumulative moisture conditions integrated over the last several months. While both the PDSI and PHDI indices show long-term moisture conditions, the PDSI depicts meteorological drought while the PHDI depicts hydrological drought. The PDSI map shows less severe and extensive drought in parts of the northeastern and southeastern U.S. than the PHDI map because the meteorological conditions that produce drought and wet spell conditions are not as long-lasting as the hydrological impacts.
|
 |
Used together, the Palmer Z Index and PHDI maps show that short-term dry conditions occurred across parts of the Southeast, Southwest, Mid-Atlantic, and northern Plains. This short-term dryness intensified or expanded drought in southern Alabama and Georgia to Florida compared to the end of March. Short-term wet conditions reduced long-term drought conditions from Tennessee and the Carolinas to Virginia.
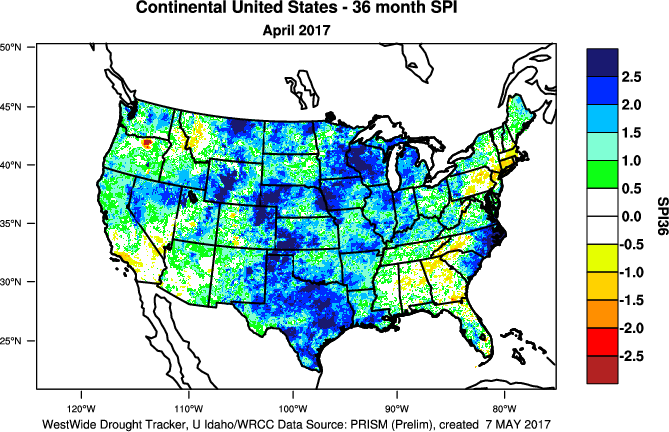
Standardized Precipitation Index
The Standardized Precipitation Index (SPI) measures moisture supply. The SPI maps here show the spatial extent of anomalously wet and dry areas at time scales ranging from 1 month to 24 months.
 |
 |
 |

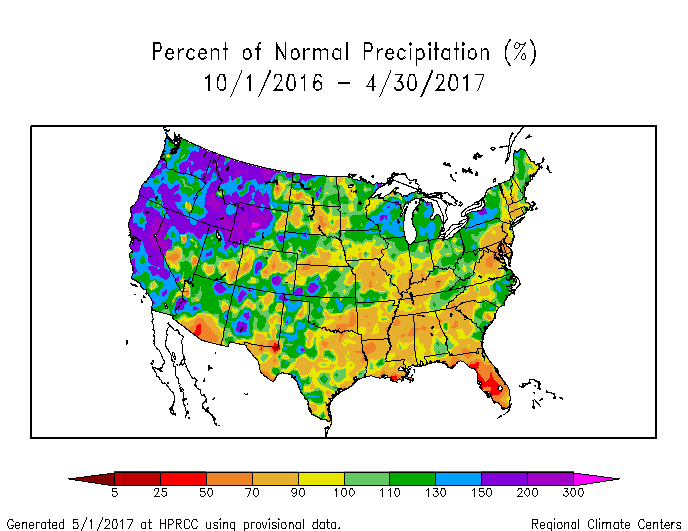
The SPI maps illustrate how moisture conditions have varied considerably through time and space over the last two years. April 2017 (the 1-month SPI map) was near-normal to wet across most of the CONUS, with dryness indicated in a few areas in the Southwest, northern Plains, Southeast, and Mid-Atlantic. Dry areas are more evident at longer time scales. Southwest, northern Plains, and Southeast dryness is evident at the 2- to 3-month time scales, with parts of the Southeast dry at 6 to 24 months. Dryness appears in the mid-Atlantic and southern New England at the 3-month time scale and continues (especially for parts of New England) at 6 to 24 months. A few areas in the High Plains show up as dry at 12 months. Otherwise, wet conditions dominate the country at all time scales.
 |
 |
 |
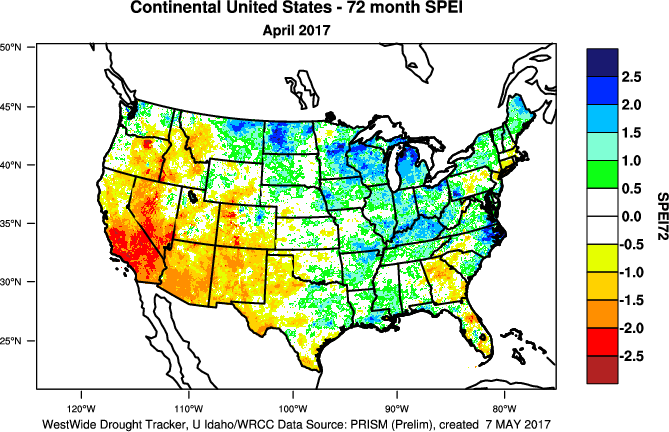
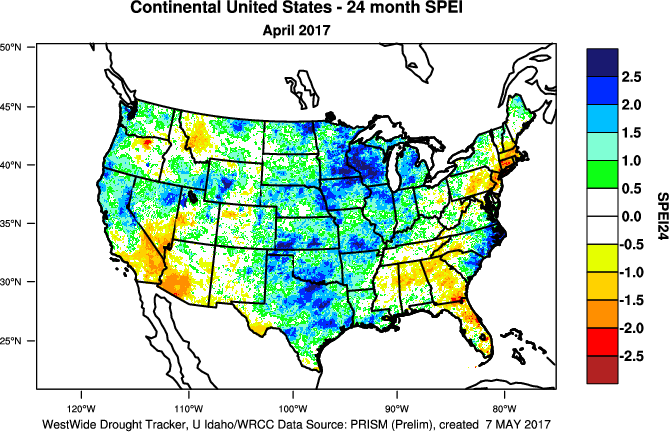
Standardized Precipitation Evapotranspiration Index
The SPI measures water supply (precipitation), while the SPEI (Standardized Precipitation Evapotranspiration Index) measures the combination of water supply (precipitation) and water demand (evapotranspiration as computed from temperature). Warmer temperatures tend to increase evapotranspiration, which generally makes droughts more intense.
 60-month SPEI for current month.
|
 60-month SPI for current month.
|
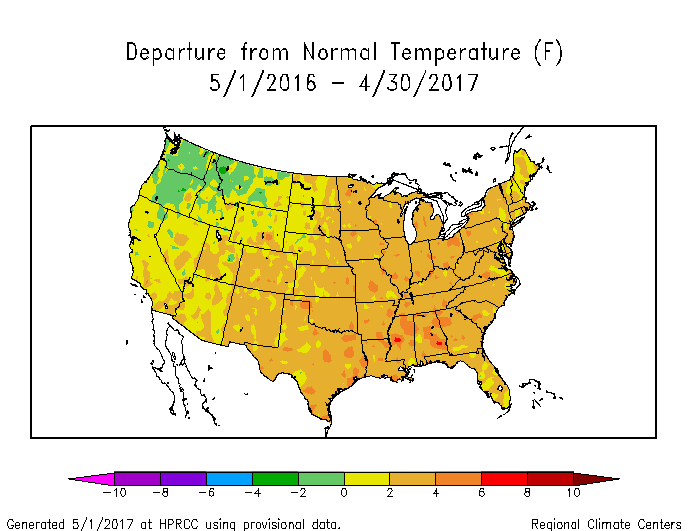
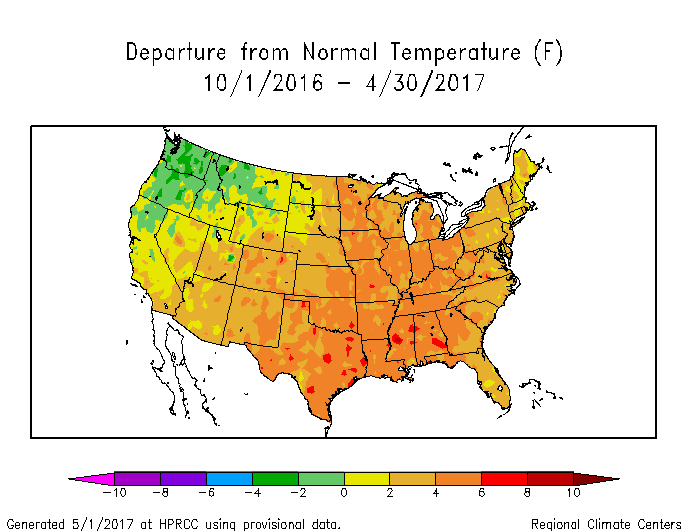
Temperatures during April 2017 and much of the last 12 to 72 months have been warmer than average for most of the CONUS. These warmer-than-normal temperatures worsen drought conditions where low precipitation occurs (SPEI maps for last 1, 3, 6, 12, 24, 36, 48, 60, 72 months) (SPI maps for last 1, 3, 6, 12, 24, 36, 48, 60, 72 months). This is especially evident in the Southwest at the 3-month time scale, Southeast at 12 months, southern New England at 12 to 36 months, and Southwest (especially California) at 24 to 72 months.
Regional Discussion
 USGS streamflow percentiles
|
 USDA NRCS mountain snowpack
|
 NLDAS soil moisture percentiles
|
CONUS Agricultural & Hydrological Impacts:
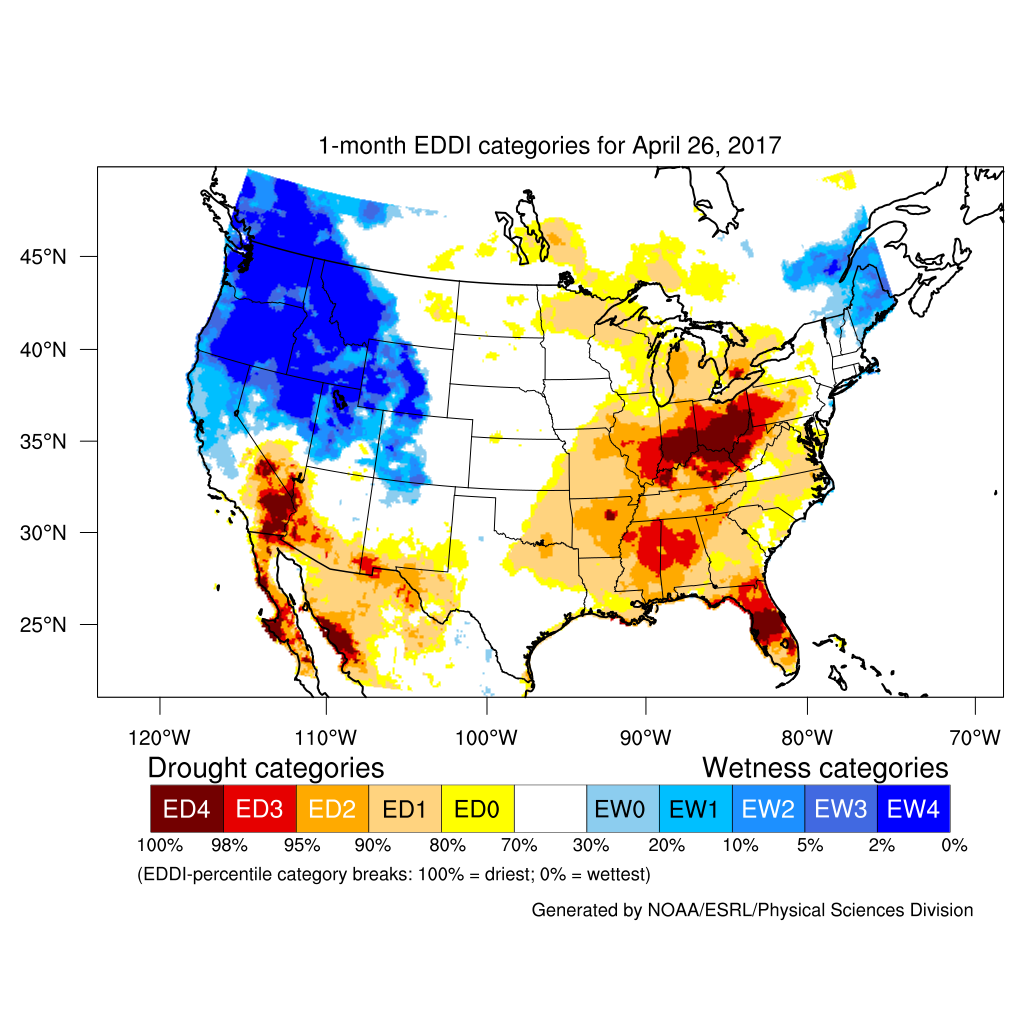
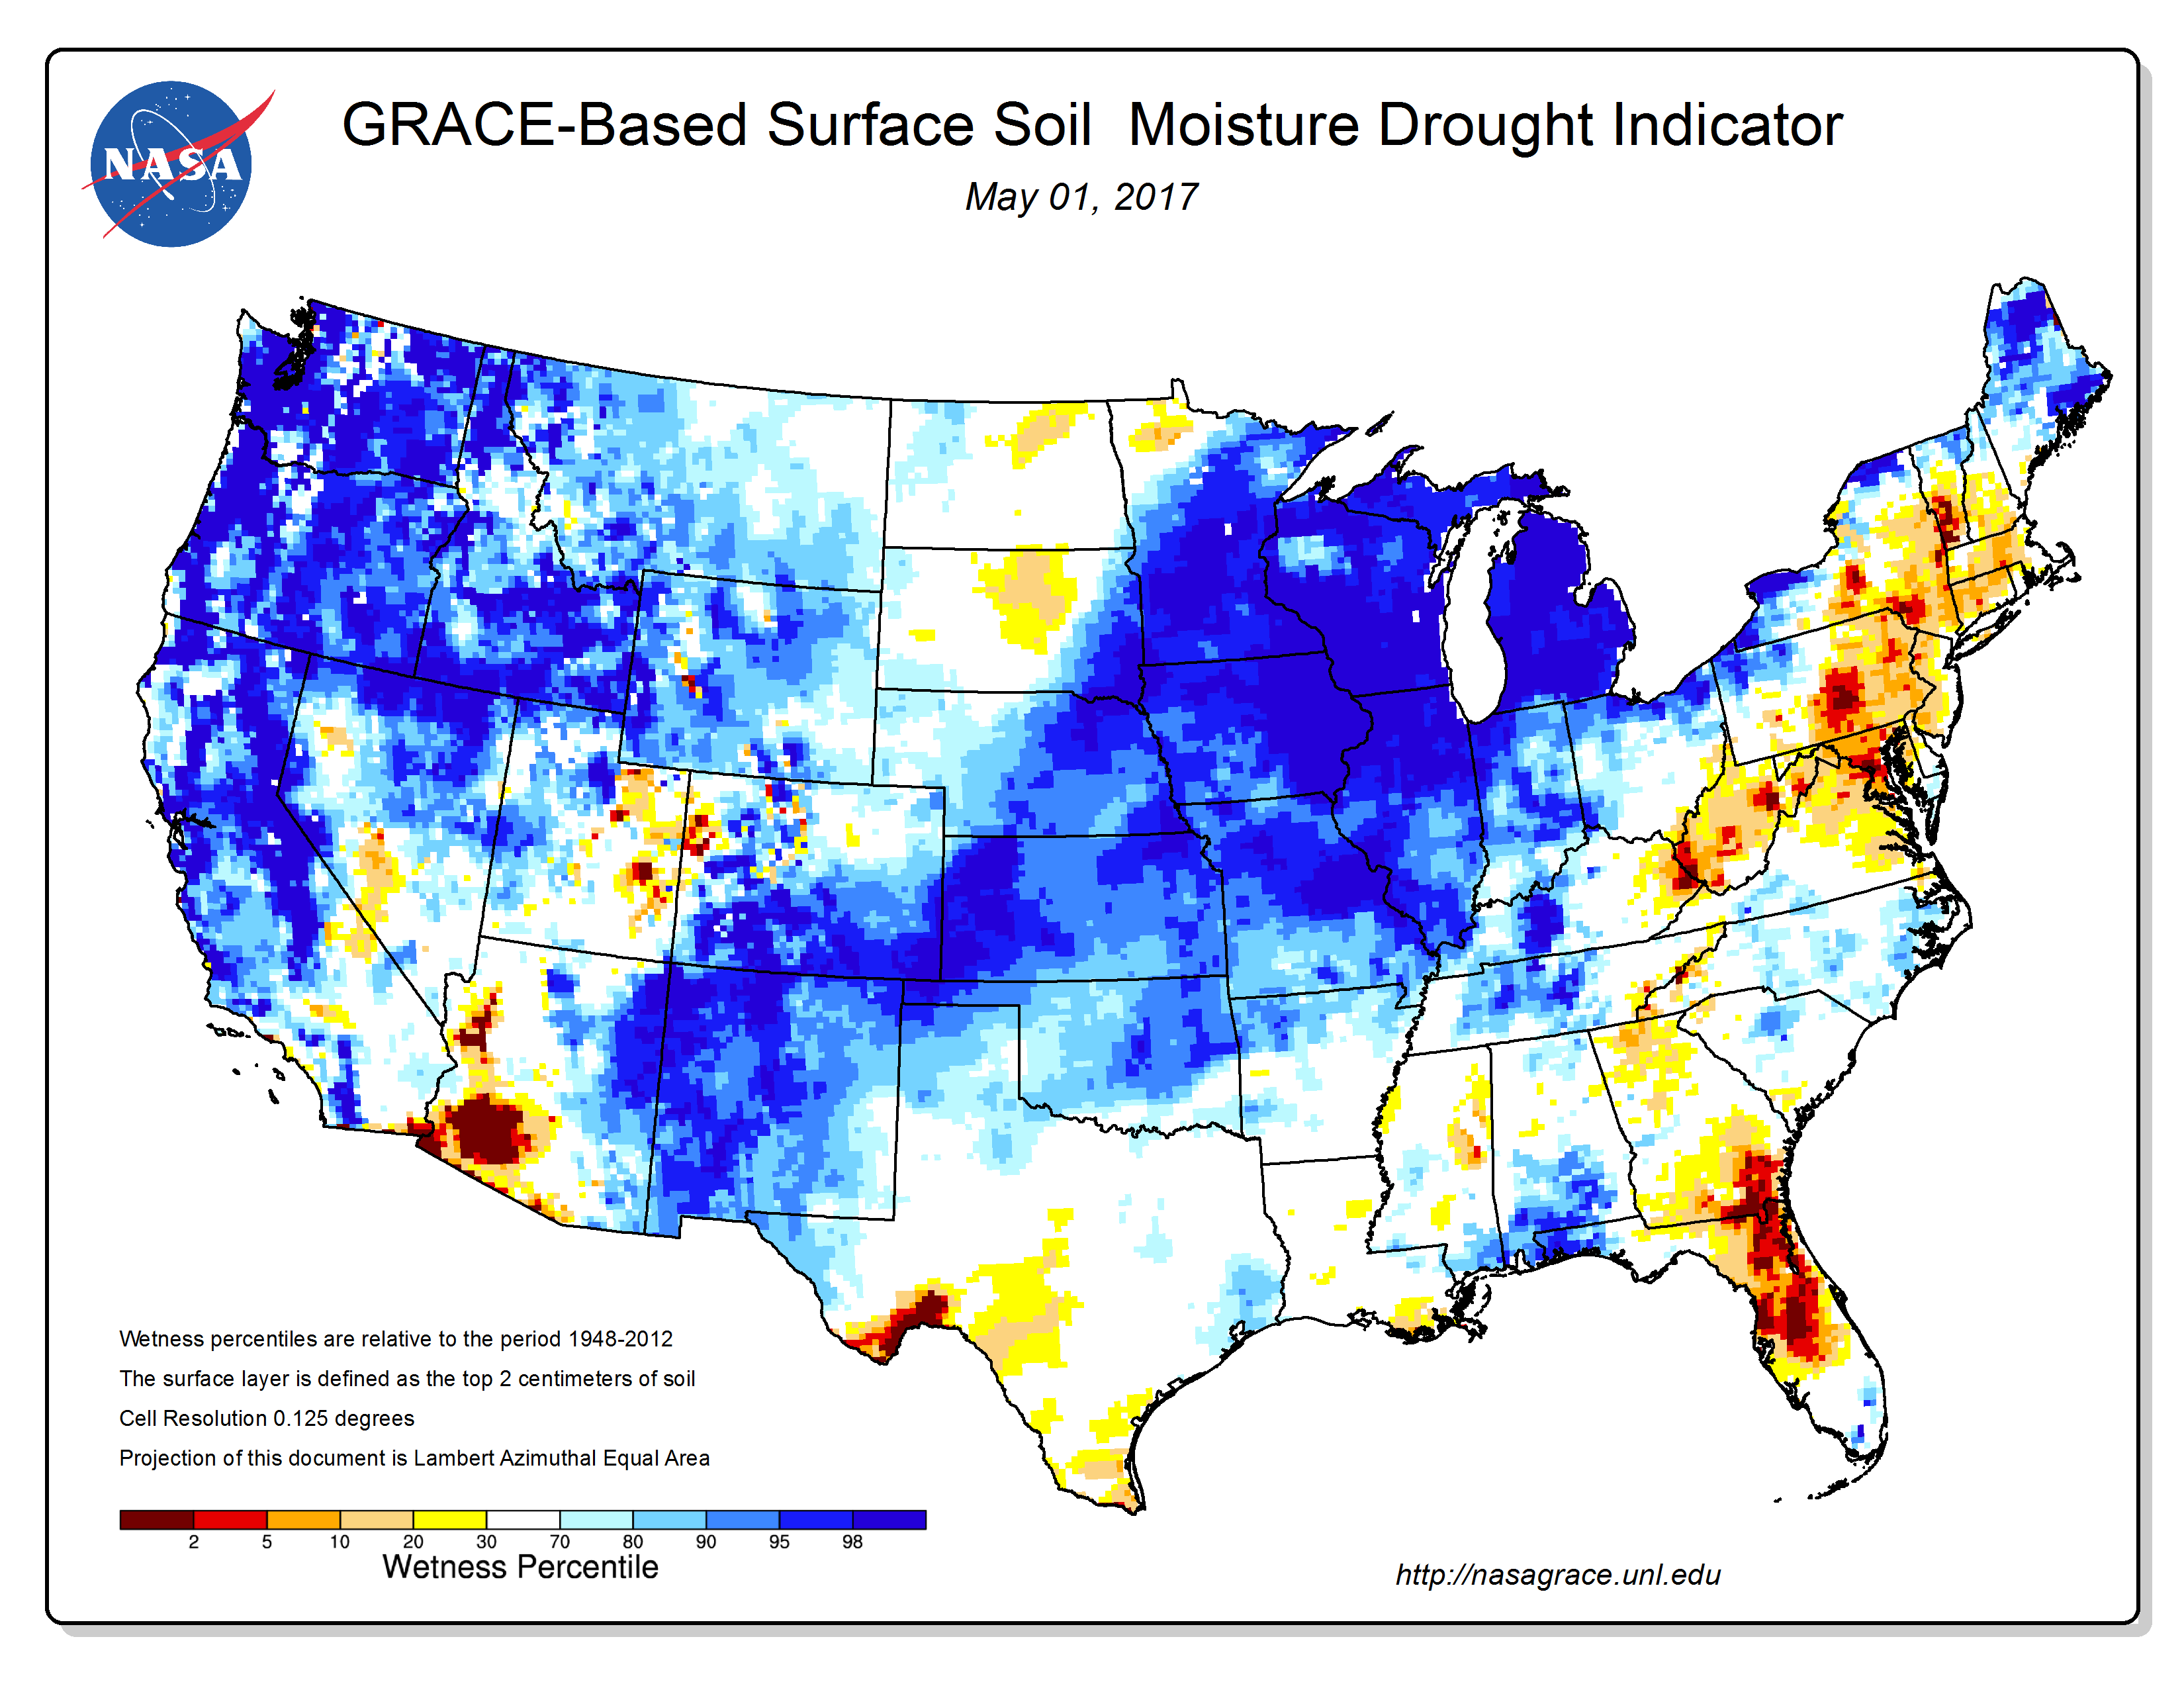
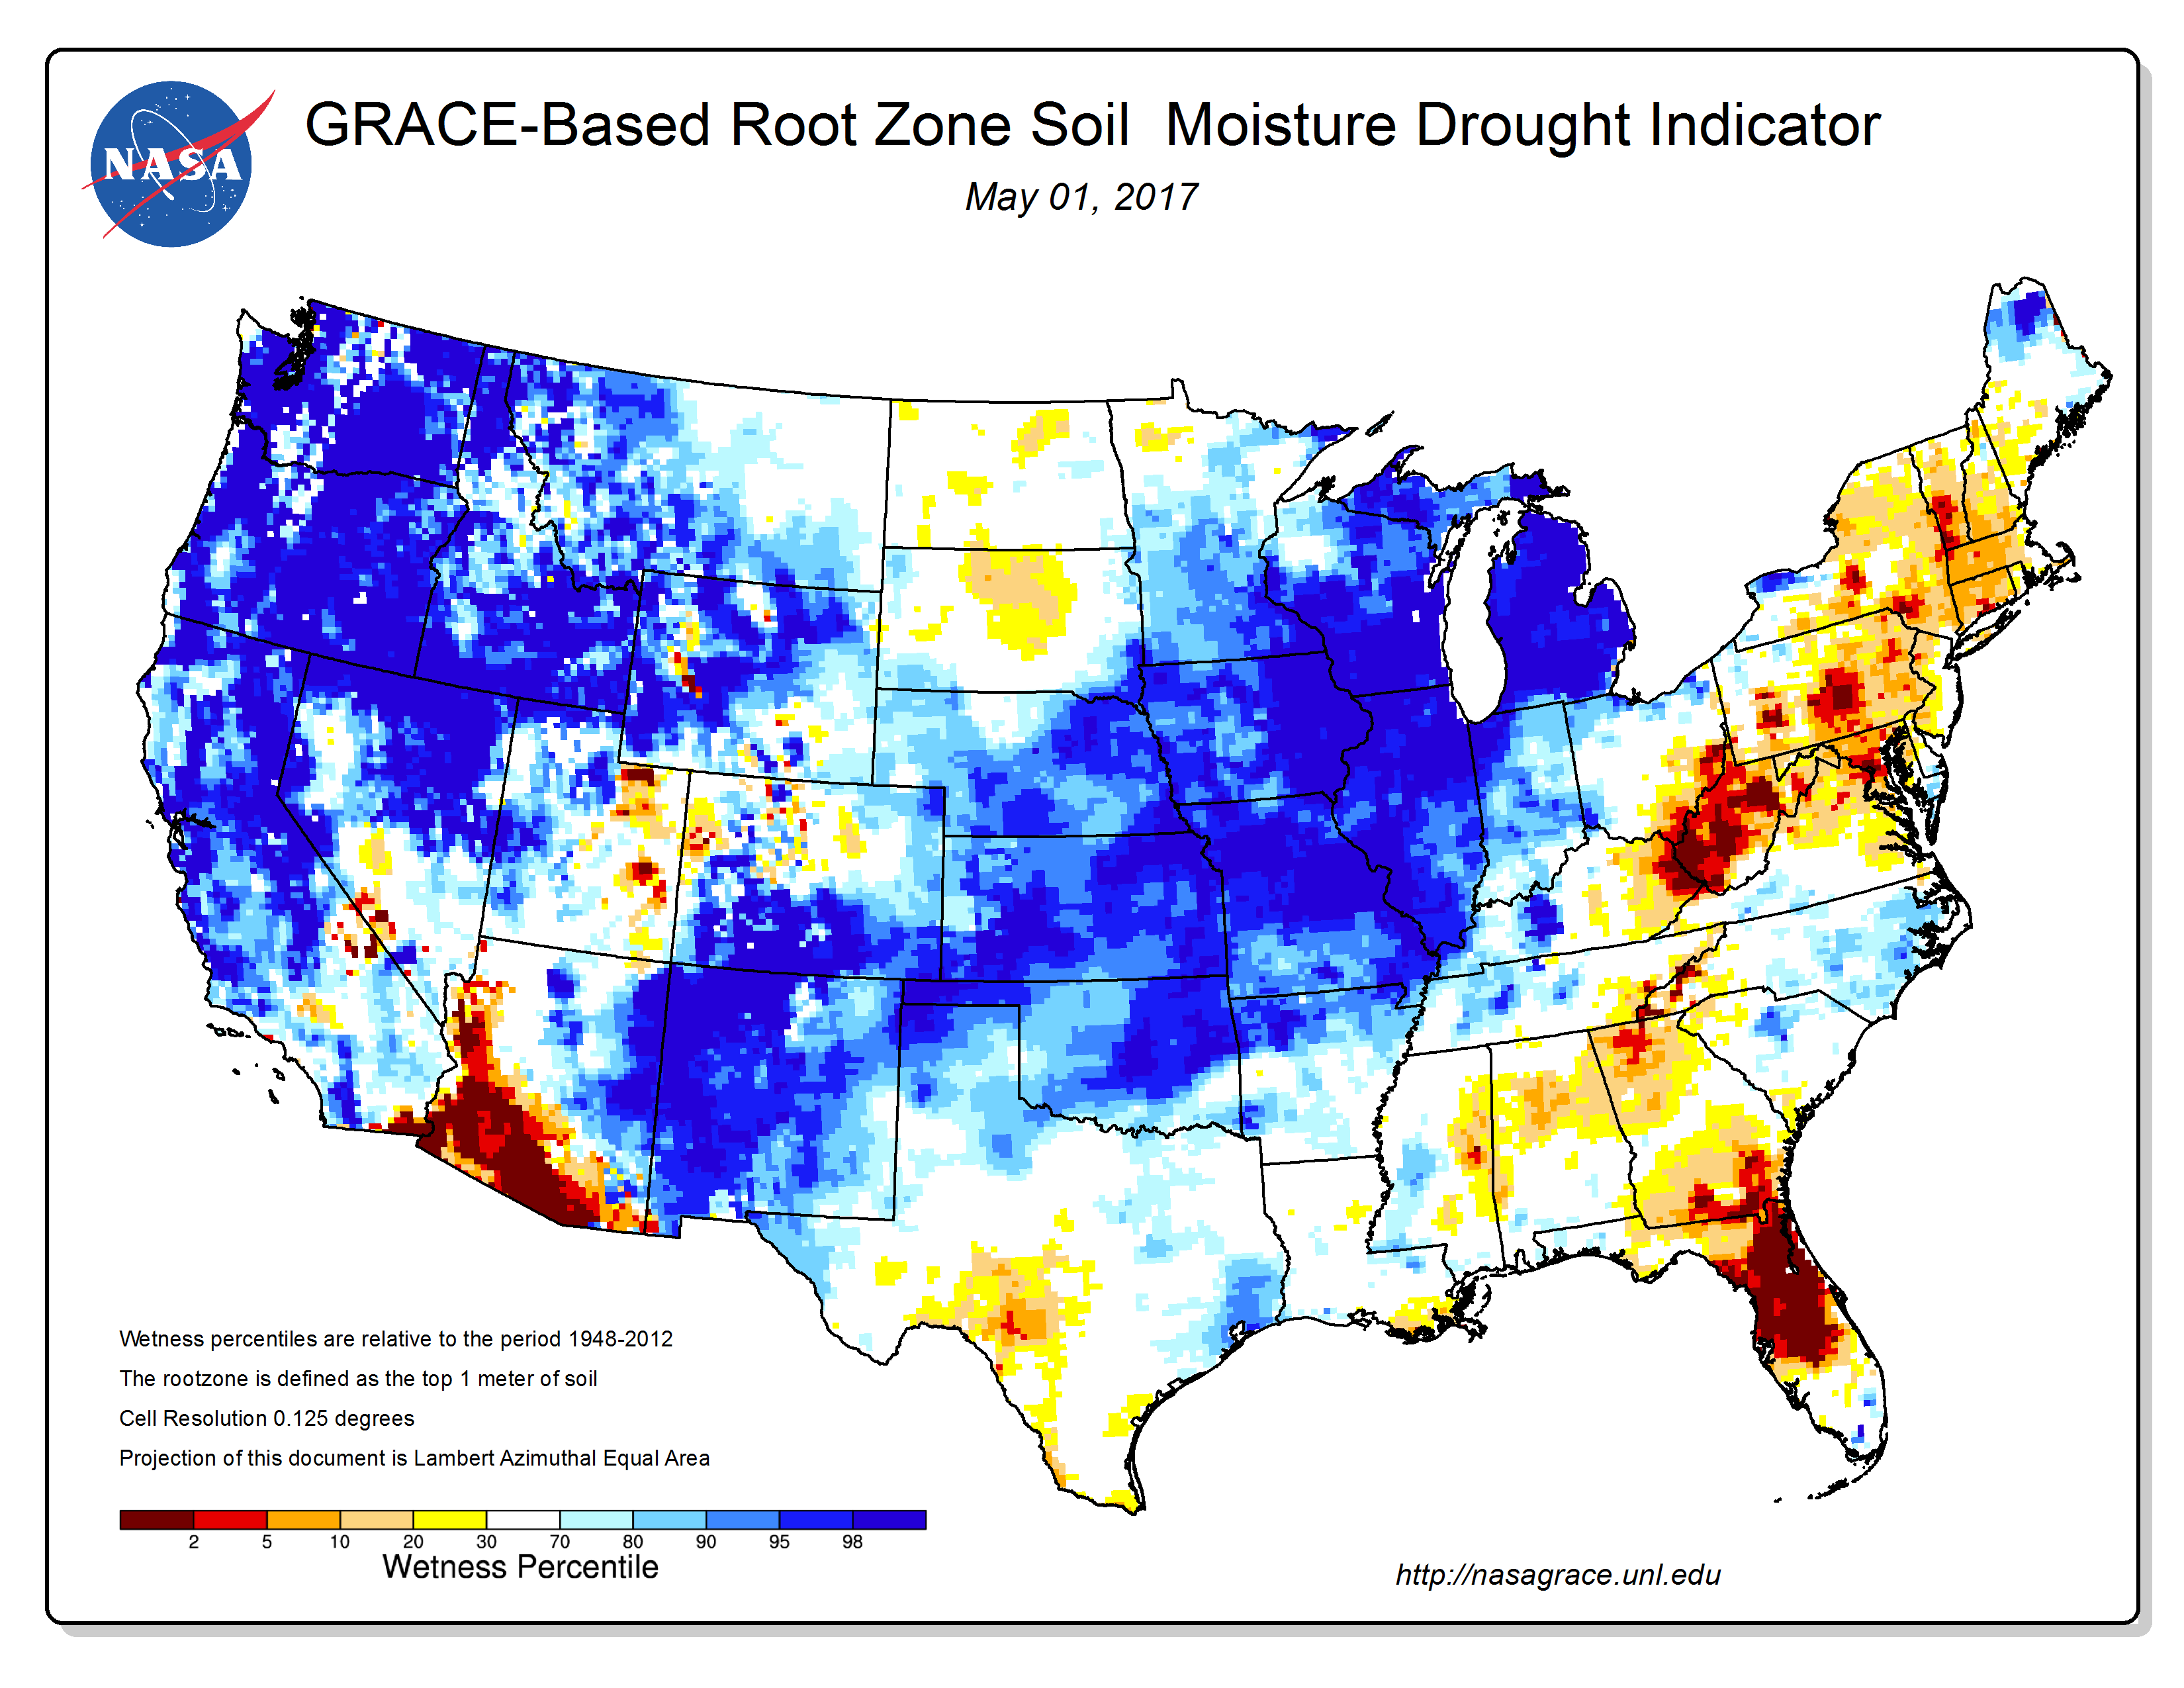
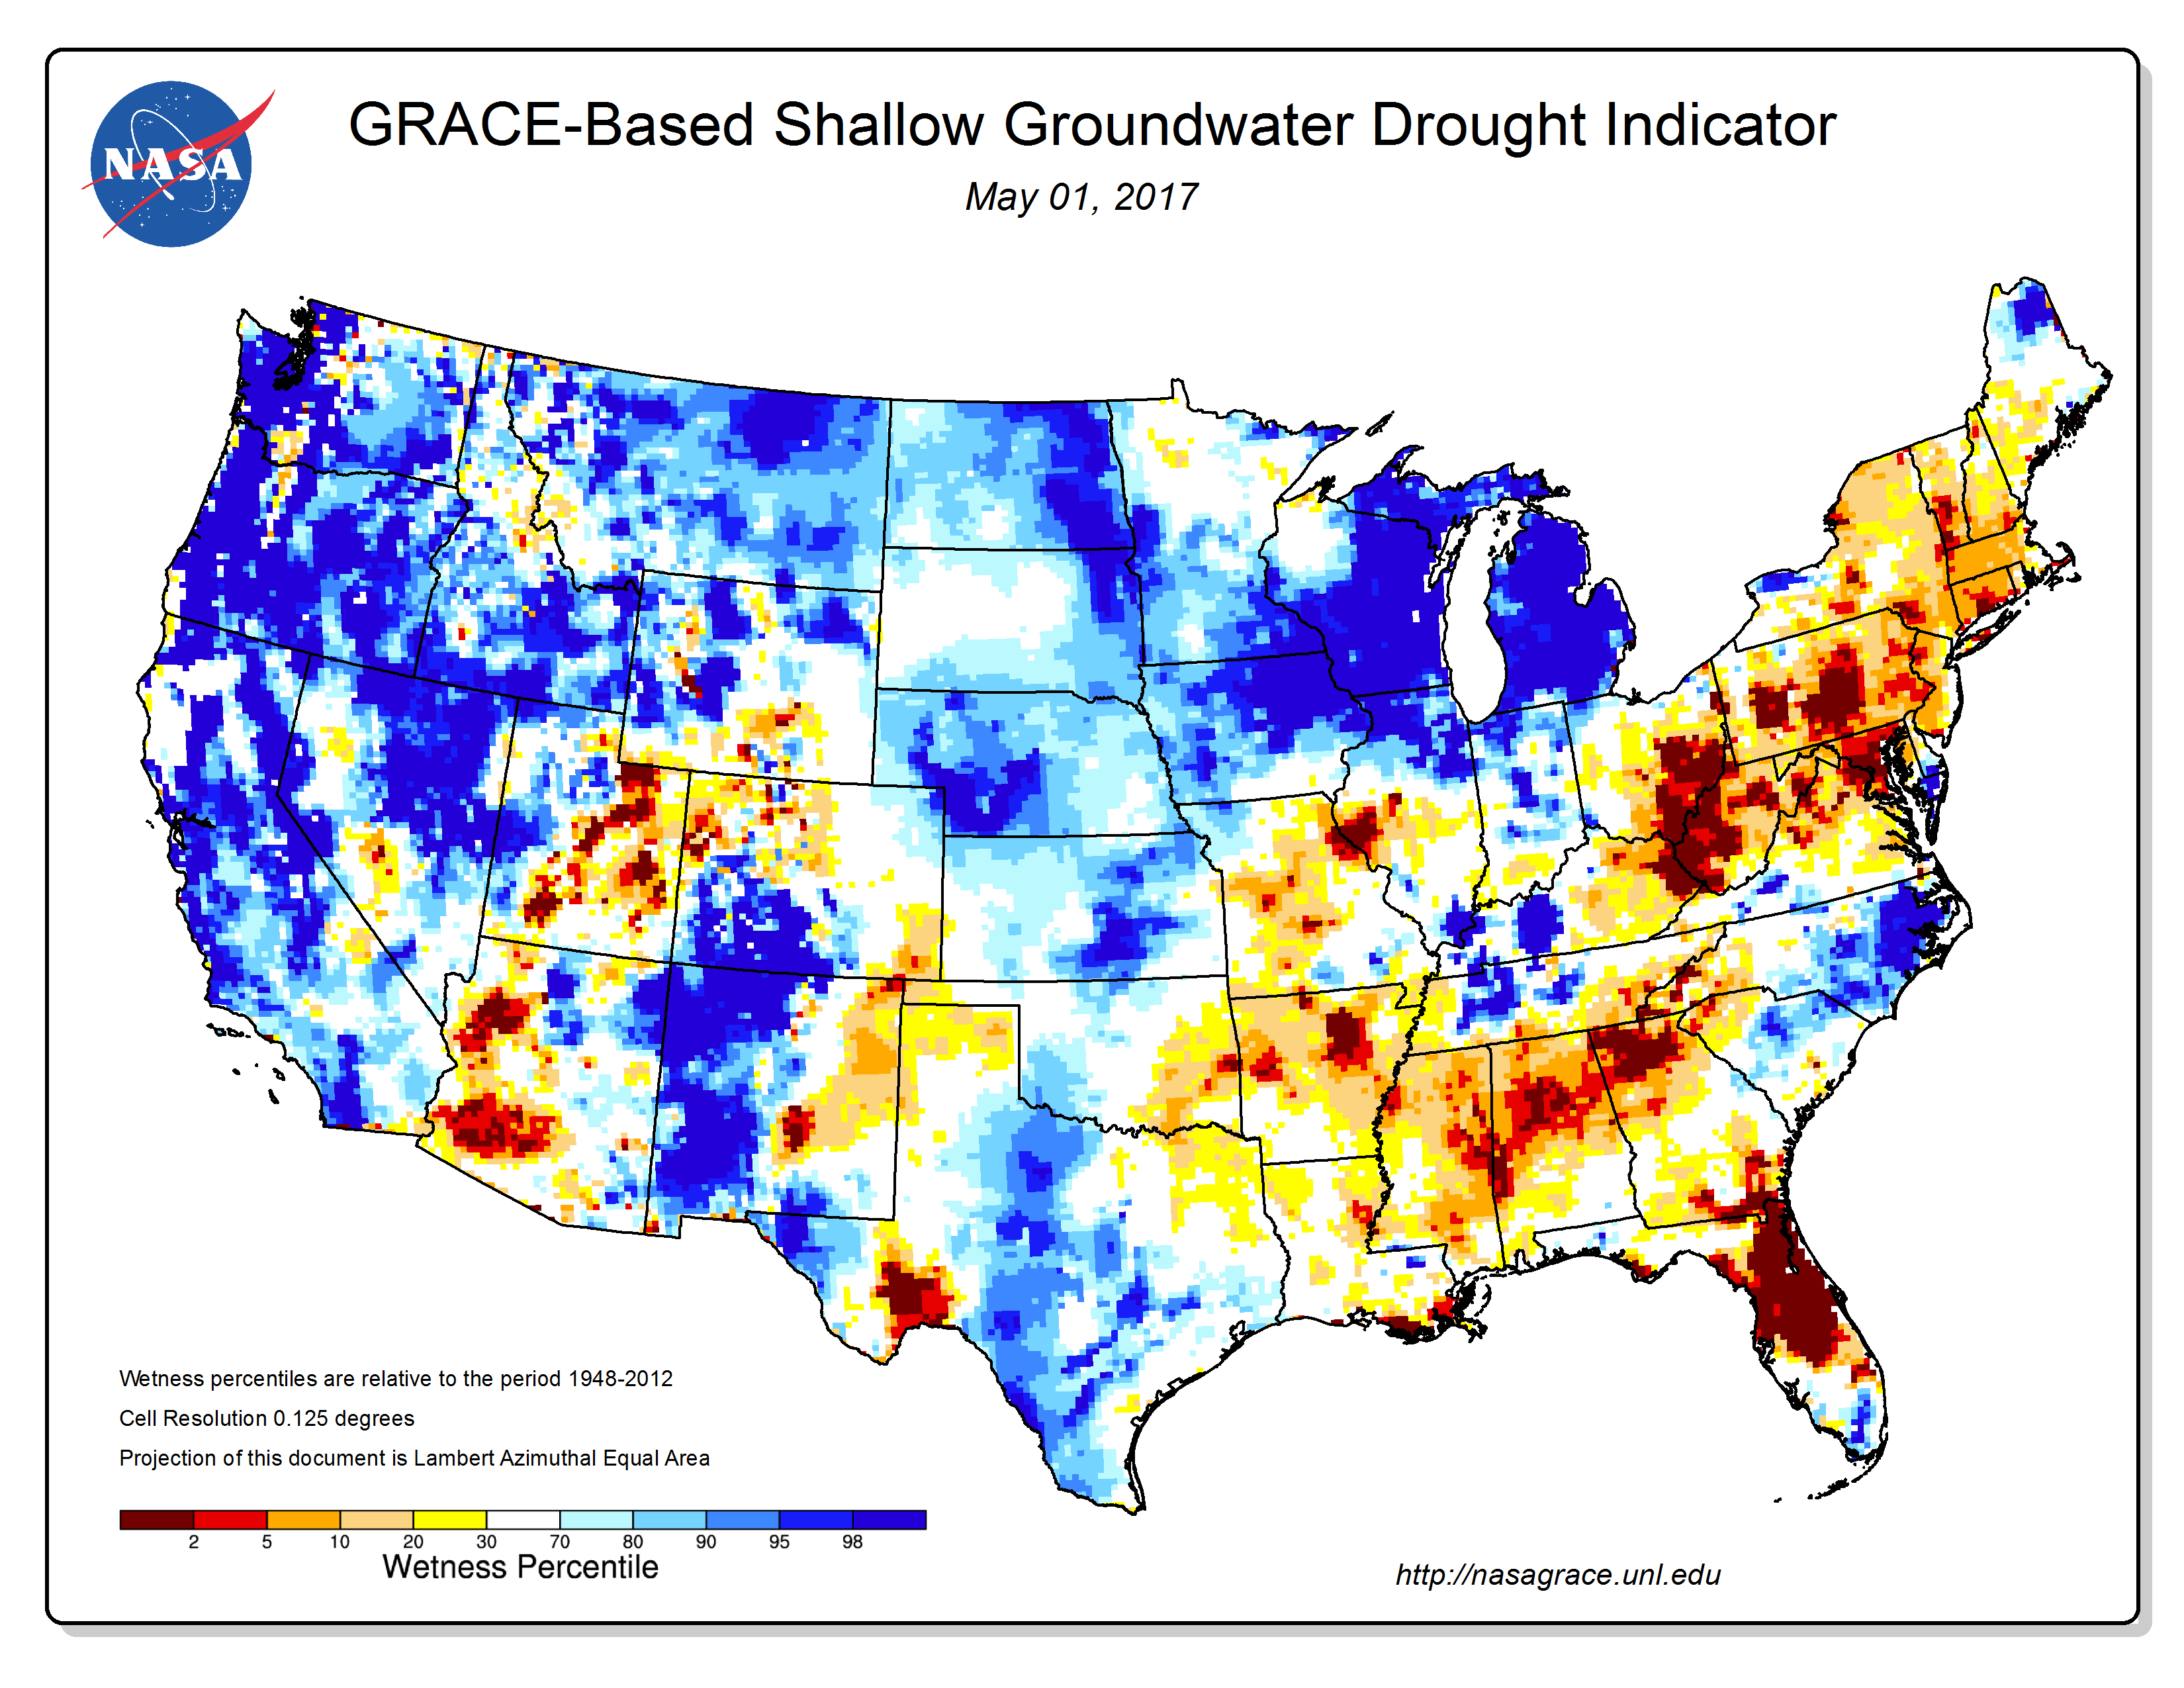
Drought conditions at the end of April 2017 were reflected in a number of meteorological, hydrological, and agricultural indicators, both observed and modeled. These include: evapotranspiration (EDDI, ESI), soil moisture (USDA observations, SMOS satellite-based model, Leaky Bucket model, CPC model, NLDAS model topsoil and total column, VIC model, NASA GRACE surface and root zone soil moisture), ground water (USGS observations, NASA GRACE estimates), and streamflow levels. These indicators reflected dry conditions especially in the Southeast. On a national scale, as of May 2nd, 2017, very little of the agricultural areas of the CONUS were affected by drought — only four percent of the nation's cattle inventory and hay, and one percent of winter wheat, corn, and soybean production. These percentages are all below the values for the end of March. As noted by the USDA, only 13 percent of the nation's winter wheat was in poor to very poor condition. On a national scale, only nine percent of the nation's topsoil and 12 percent of subsoil were short or very short of moisture (dry or very dry). But conditions were more extreme on a statewide basis, with topsoil moisture short or very short across 73 percent of Florida, 61 percent of Georgia, 51 percent of New Mexico, 34 percent of Texas, and 33 percent of Alabama, and subsoil moisture short or very short across 68 percent of Florida, 57 percent of Georgia, 45 percent of New Mexico, and 44 percent of Alabama.
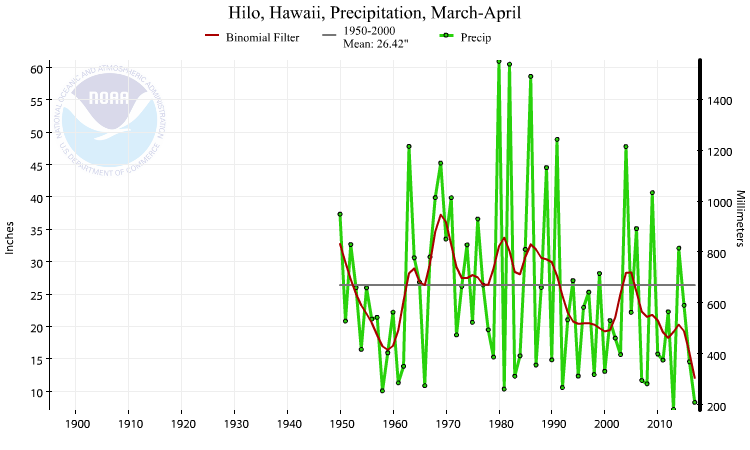
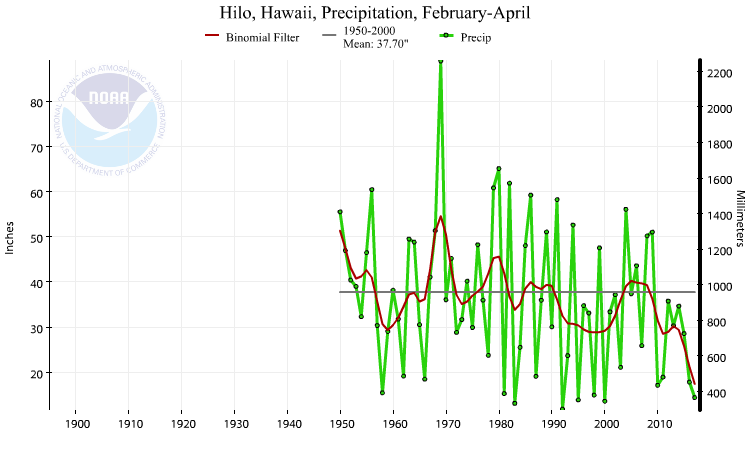
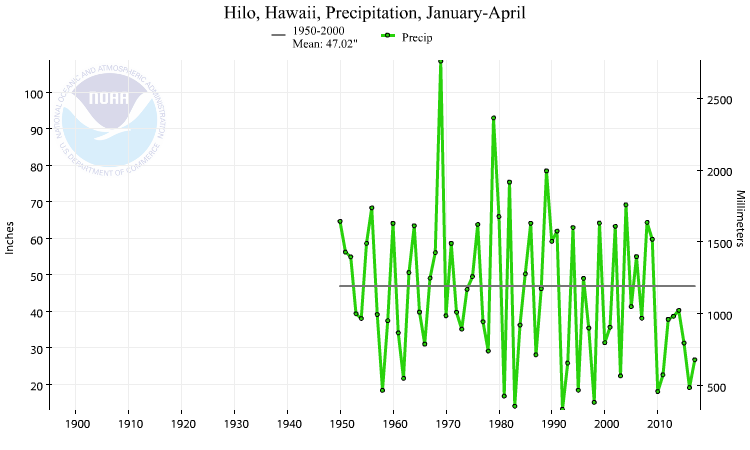
Hilo, Hawaii, precipitation, March-April, 1950-2017.
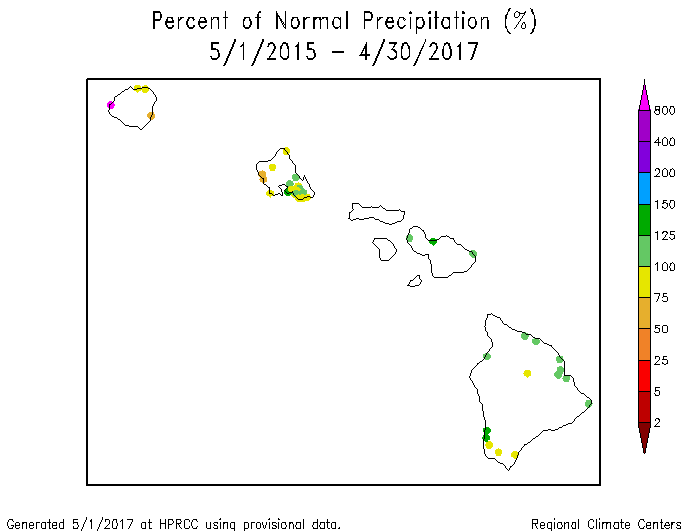
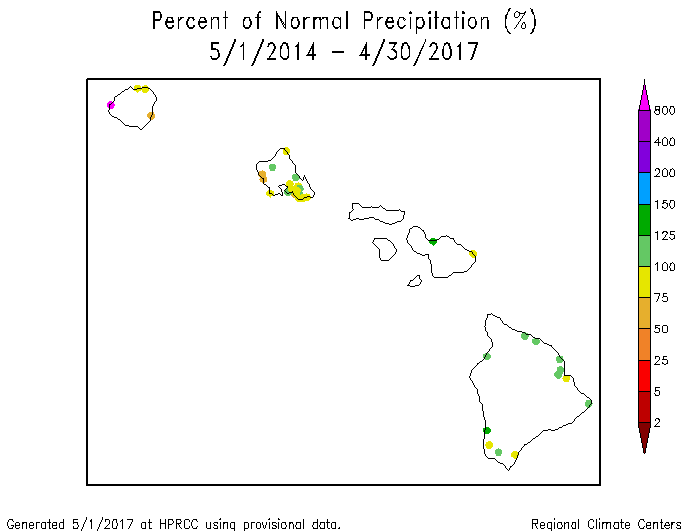
Hawaii: April 2017 was drier than normal across parts of the Hawaiian Islands and wetter than normal across other parts. Wet conditions dominated most islands for the last 3 months, but drier-than-normal conditions dominated for the last 2, 4, 6, and 7 months, especially across the Big Island. Hilo had the second driest March-April in the 1950-2017 record, fifth driest February-April, ninth driest April, and 13th driest January-April. The precipitation anomaly pattern across Hawaii was mixed at the longer time scales (last 10, 12, 24, and 36 months). On the USDM map, abnormally dry conditions expanded during early April then shrank during the last week to a value less than when the month began. Severe drought shrank during the month, but the moderate to severe drought percent area ended the month with the same value it began with, covering about a fourth of the state on the May 2nd, 2017 USDM map.
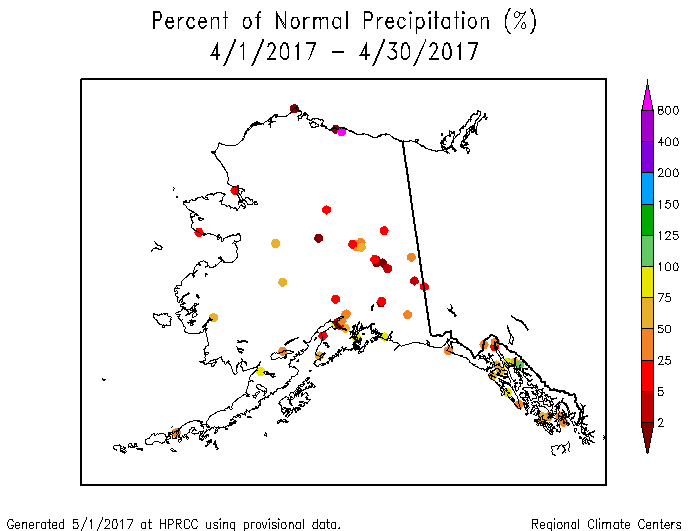
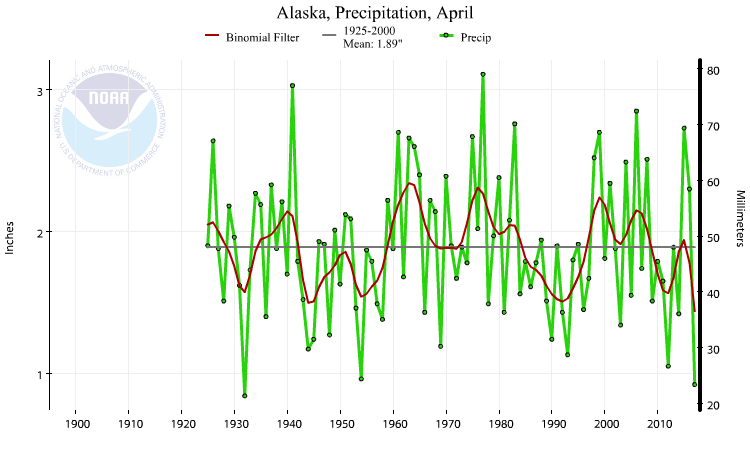
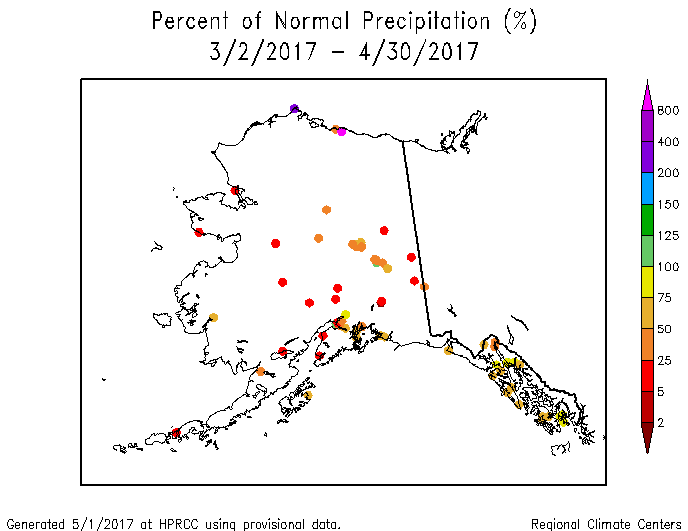
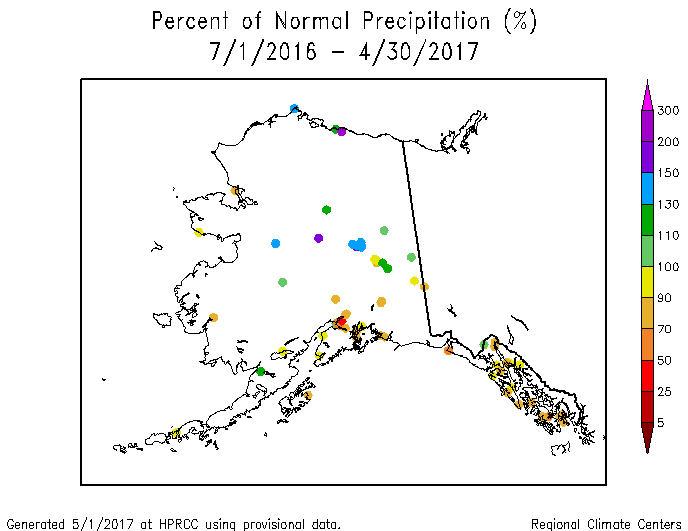
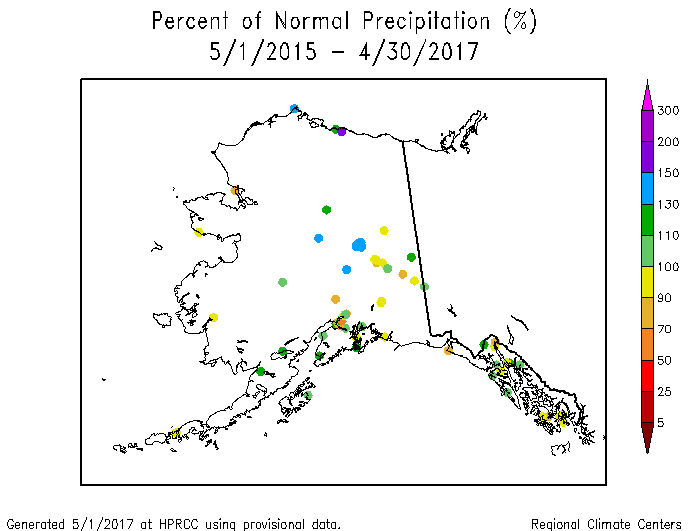
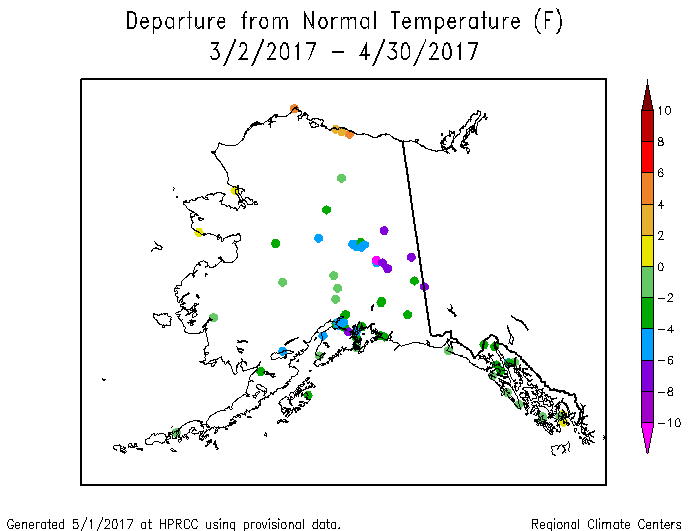
Alaska statewide precipitation, March-April, 1925-2017.
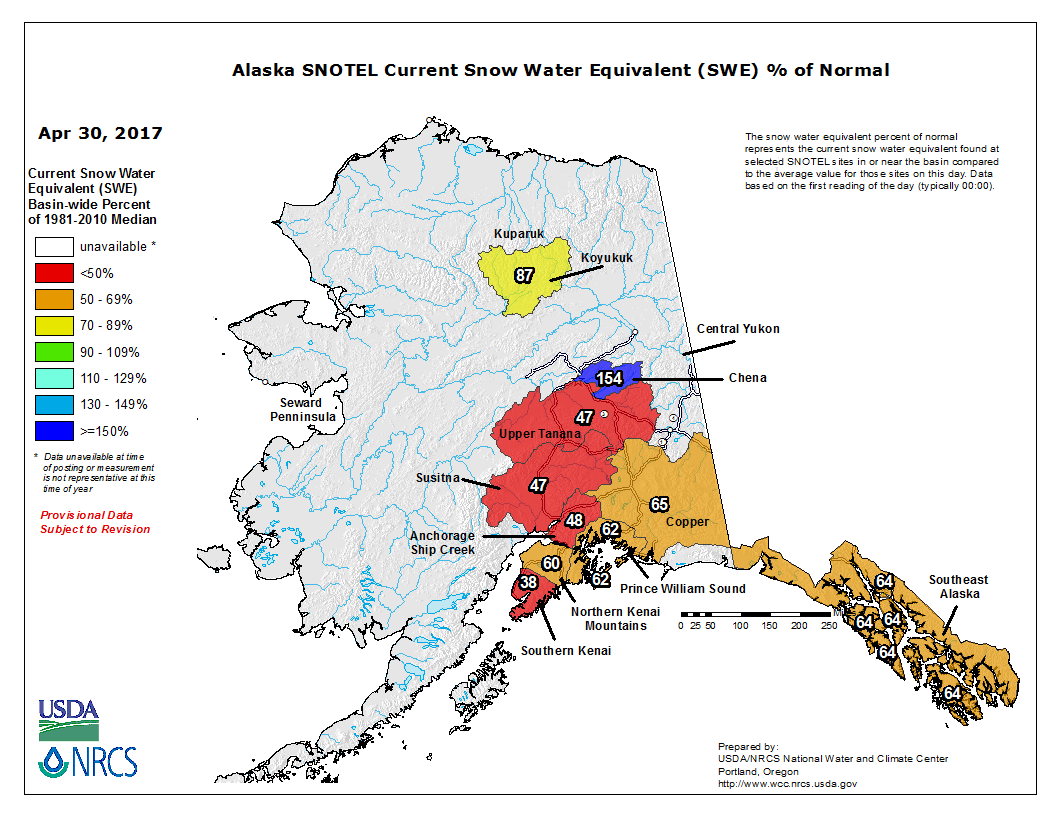
Alaska: April 2017 was drier than normal across most of Alaska (as seen on the climate division, low elevation station, and high elevation station SNOTEL maps), with the month ranking as the second driest April, statewide, in the 1925-2017 record. The last two months were even drier, with the state having the driest March-April on record. The last three months were mostly drier than normal, with a few stations wetter than normal. A similar pattern was found at the 4 (climate division, low elevation station), 6 (climate division, low elevation station), and 7 (low elevation station, high elevation SNOTEL station and basin maps) month time scales. Wetter-than-normal conditions were more dominant at the longer time scales — last 10, 12 (climate division, low elevation station), 24, and 36 months. April was warmer than normal across the state (climate division, low elevation station maps). But cooler-than-normal conditions dominated at the 2, 3 (climate division, low elevation station), and 4 month (climate division, low elevation station) time scales. The temperature anomaly pattern became mixed at the longer time scales — last 6, 7, and 12 months (climate division, low elevation station). Mountain snowpack and snow water content were below normal at most stations and basins, although several feet of snow remained in some of the higher basins. About a third of the state was abnormally dry on the May 2nd USDM map.
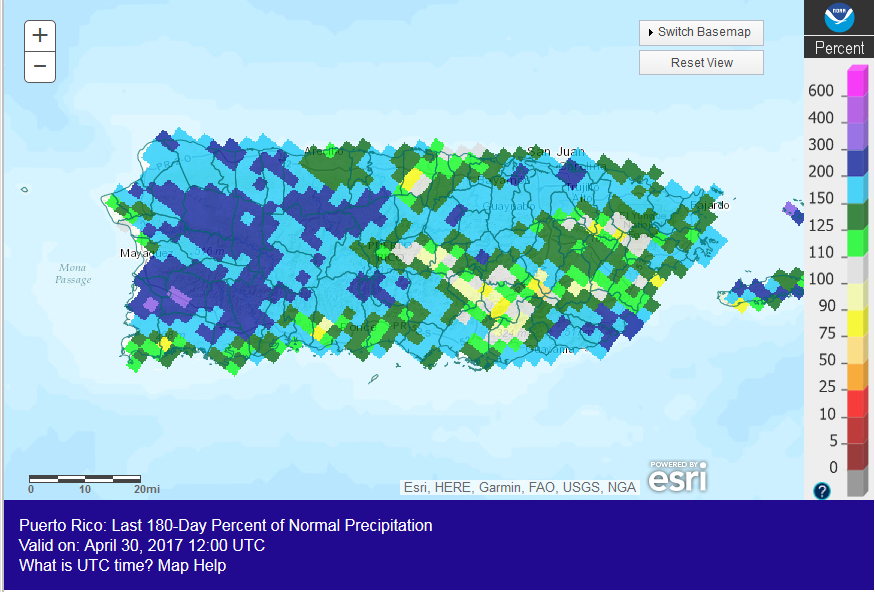
Puerto Rico: Puerto Rico was wetter than normal during April. A similar pattern was evident for the last 2, 3, 4, 6, and 7 months. Soils were a little dry along the southern coast but streamflow was above normal across the island. Puerto Rico was free of abnormal dryness and drought on the May 2nd, 2017 USDM map.
CONUS State Precipitation Ranks:

|

|
April 2017 was wetter than normal across most of the CONUS, so on a statewide basis only three states ranked in the driest third of the historical record. But dry conditions dominated in the Southeast for the last three months, with two states ranking in the top ten driest category — Georgia at seventh driest and Florida at tenth driest. Twelve other states had February-April precipitation ranks in the driest third of the 1895-2017 record.

|

|
Likewise, January-April 2017 was wetter than normal across much of the CONUS, except in the northern Plains and along the East Coast. Only six states ranked in the driest third of the historical record. For November 2016-April 2017, areas of below-normal precipitation were widespread along the East Coast. Seven states ranked in the driest third of the historical record, including Delaware with the eighth driest November-April.

|

|
At the 12-month time scale, dryness dominated the Southeast and Northeast, with areas of below-normal precipitation also in the Southwest to northern Plains. Ten states ranked in the driest third of the historical record, including Alabama, which had the eighth driest May-April, and Connecticut at tenth driest.
 Primary Hard Red Winter Wheat Belt precipitation, April, 1895-2017.
|
 Primary Hard Red Winter Wheat Belt precipitation, October-April, 1895-2017.
|
April 2017 was warmer and wetter than normal across most of the Primary Hard Red Winter Wheat agricultural belt. The month ranked as the ninth wettest and 40th warmest April, regionwide, in the 1895-2017 record. October serves as the beginning of the growing season. October 2016-April 2017 was warmer than normal across the region and wetter than normal across much of the region, ranking as the warmest and 31st wettest October-April, regionwide, on record.
 Primary Corn and Soybean Belt precipitation, April, 1895-2017.
|
 Primary Corn and Soybean Belt precipitation, March-April, 1895-2017.
|
April 2017 was warmer and wetter than normal across most of the Primary Corn and Soybean agricultural belt. The month ranked as the 16th wettest and twelfth warmest April, regionwide, in the 1895-2017 record. March marks the beginning of the growing season for the Primary Corn and Soybean agricultural belt. March-April 2017 was warmer and wetter than normal across the region, ranking as the 14th warmest and 19th wettest March-April, regionwide, on record.
NOAA Regional Climate Centers:
A more detailed drought discussion, provided by the NOAA Regional Climate Centers and others, can be found below.
As described by the High Plains Regional Climate Center, after a very warm March, April's temperatures were closer to normal throughout the region and precipitation varied across the region. The wet pattern that has been a primary feature since March continued in places like Wyoming, Kansas, and eastern Colorado during April. As a result of the wetness, mountain snowpack continued to increase throughout the month and is expected to peak later than normal in the Missouri River Basin. Continued wet conditions also nearly eliminated drought in Kansas and eastern Colorado and vastly improved topsoil moisture as well. Meanwhile, dry conditions prevailed across much of the Dakotas, but the dryness was not record-breaking.
Heavy rain and snow, sub-freezing temperatures, and high winds accompanied a couple of storm systems that came through in late April. These conditions killed cattle in Colorado and especially put calves at risk. The long-term presence of drought conditions and early emergence put a stressed winter wheat crop at additional risk for damage in western Kansas. Losses are projected to be greatest in southwestern Kansas where the crop was at a critical growth stage and the greatest impacts occurred. Even in areas that did not sustain sub-freezing temperatures, prolonged cold and wet conditions caused diseases to emerge, such as wheat stripe rust and leaf rust. Besides winter wheat, corn that had already been planted was put at risk in north-central and western Kansas where soil temperatures took a dive. While it appears that southwestern Nebraska may have escaped damage to winter wheat from these storms, the heavy snow may have damaged the alfalfa crop. Damage will be assessed in May after temperatures rise and the snow melts.
Major improvements in drought conditions occurred during April, as beneficial precipitation fell across drought-stricken areas in the High Plains. Regionwide, all severe drought (D2) and extreme drought (D3) were removed by the end of the month on the USDM map. The area in drought (D1-D4) in the region decreased from 17 percent to 4 percent, and the area experiencing drought or abnormal dryness (D0-D4) decreased to 20 percent. The biggest improvements occurred throughout Kansas. Most of the state received at least 150 percent of normal precipitation, while precipitation exceeded 300 percent of normal in western portions of the state. As of the end of March, nearly half the state was in drought, but it was drought-free by the end of April and only 12 percent of the state was experiencing abnormally dry (D0) conditions. Portions of eastern Colorado and western South Dakota experienced relief in drought conditions as well. Reports state that regionwide, April precipitation has helped grasslands recover in drought-stricken areas. Despite recent precipitation and improving conditions, the impacts of drought are still being felt across the parts of the region. Drought conditions during the past six months have caused the winter wheat crop to suffer in Colorado and Kansas. Additionally, ranchers in Kansas are still dealing with the impacts from devastating wildfires in March, which included the loss of cattle and miles of fence, and many are culling herds and buying costlier feed.
As explained by the Southern Regional Climate Center, April was a warmer-than-normal month for all states in the Southern region and monthly precipitation varied spatially across the region. Conditions were quite dry across southern Louisiana, northern Mississippi, and parts of Texas with stations reporting between 5 to 70 percent of normal. Over the month of April 2017, drought conditions improved for most parts of the region, such as areas in Oklahoma and Texas. There were no areas that entered drought from March to April. The area of extreme drought in Oklahoma during March has improved to normal conditions in April. Areas of Oklahoma, northeastern Louisiana, western Arkansas, and northwestern Mississippi are still experiencing moderate drought conditions. At this time, there are no areas experiencing extreme or exceptional drought.
As summarized by the Midwest Regional Climate Center, April temperatures and precipitation were above normal across a majority of the Midwest. However, areas in northern Minnesota and central Kentucky received less than half their normal April precipitation. The entire Midwest was free of any abnormally dry conditions at the end of April, per the May 2nd USDM. The last time this happened in the Midwest was 15 years ago, in May 2002. The removal of abnormally dry and drought conditions was an improvement from the beginning of April. The March 28th USDM showed just over 10 percent of the region in drought and another 10 percent as abnormally dry, mostly in the southwestern Midwest. Corn and soybean planting progressed in April, with some states ahead of the 5-year average. As of April 30, Missouri, Illinois, Indiana, and Ohio were ahead of the 5-year average for planting corn and the same states were also ahead for planting soybeans with the exception of Missouri, which was right at the 5-year average. Minnesota was the most behind the 5-year average, with only 12 percent of corn planted (24 percent behind the average) and no soybeans planted (6 percent behind the average). Flooding, ponding, and saturated conditions will necessitate replanting some fields.
As noted by the Southeast Regional Climate Center, temperatures were well above average across the Southeast region, with numerous record-breaking extremes observed during April. Precipitation ranged from well below normal to well above normal across the Southeast region, with several extremes recorded during April. The driest locations were found across portions of southern Georgia as well as central and southern Florida, where monthly precipitation totals were 50 to less than 5 percent of normal. Orlando, FL (1892-2017) and Wauchula, FL (1933-2017) tied their driest April on record, with no measurable precipitation observed during the month. Precipitation totals were 150 to over 400 percent of normal across much of Puerto Rico and the U.S. Virgin Islands during the month, and temperatures were near normal across the islands.
While drought conditions improved across the northern half of the region, drought development and expansion occurred in southern portions of the region during April. The greatest drought improvement occurred in North Carolina and Virginia, as the coverage of moderate-to-severe (D1-D2) drought decreased from 39 and 41 percent on March 28th to 5 and 16 percent on April 25th, respectively. Moderate-to-severe drought declined significantly across northern Alabama and Georgia, with only a small area of extreme (D3) drought remaining in northeastern Georgia. In contrast, drought continued to intensify and expand across much of the Florida Peninsula, with approximately one third of the state classified in severe drought by the end of the month. Moderate-to-severe drought developed across portions of central and southern Georgia, southeastern Alabama, and coastal South Carolina during the latter half of April. Above-normal precipitation replenished streamflows and soil moisture across much of the Carolinas and Virginia, while much-below-normal streamflows and soil moisture persisted in portions of Alabama, Georgia, and Florida. The most active wildfire season since 2011 continued across Florida, prompting the governor to declare a state of emergency on April 11th. Nearly 600 wildfires were observed and over 32,500 acres were burned across the state during the month. The Cowbell Fire burned nearly 22,000 acres of the Big Cypress National Preserve in southern Florida, but the largest wildfire, known as the West Mims Fire, consumed about 100,000 acres of the Okefenokee National Wildlife Refuge in southeastern Georgia and a small area of northeastern Florida. Smoky conditions around the Okefenokee Swamp reduced tourism and caused temporary road closures due to low visibility. During mid-April, strong winds transported smoke from the West Mims Fire northeastward into portions of the Carolinas and Virginia. Pastures improved across portions of the region that received above-normal precipitation, but drier areas reported minimal pasture growth despite the seasonal green-up. Livestock producers in parts of Alabama had to reseed pastures that were severely damaged by the drought, while insufficient grazing conditions required many producers in Florida to obtain water and hay from outside the state. Farmers in drought-stricken areas of Alabama and Georgia struggled to plant their field crops in hard, parched soils. In early April, severe thunderstorms damaged agricultural fields, buildings, and equipment across portions of Alabama, Georgia, South Carolina, and Virginia. Some losses of early planted corn and other fruit and vegetable crops were reported due to flash flooding, hail, and strong winds. Peach trees in central Georgia struggled to bloom and leaf out because of a lack of wintertime chill hours. Vegetable crops in Florida were affected by an unusually high number of white flies, which was attributed to warm and dry weather during April as well as an unseasonably warm winter across the state.
As explained by the Northeast Regional Climate Center, the Northeast had its second warmest April on record and near normal (106 percent of normal) precipitation. The USDM released on April 6 indicated 11 percent of the Northeast was in a moderate or severe drought, with another 19 percent being abnormally dry. Abnormally dry and drought conditions continued to improve in the Northeast during the month. The region became free of severe drought for the first time since late June 2016. Moderate drought eased in Maine, Massachusetts, New York, most of New Hampshire and Vermont, and portions of Connecticut, Pennsylvania, and Maryland. Abnormal dryness eased in New Jersey and portions of northern and southern Maine, central New Hampshire, central Vermont, Massachusetts, southeastern New York, eastern Pennsylvania, north-central Maryland, and southeastern West Virginia. The USDM released on April 27 indicated 3 percent of the Northeast was in a moderate drought, with another 17 percent being abnormally dry. April average streamflow was near to above normal for most of the region, while groundwater levels ranged from below normal to above normal. Many reservoirs returned to near-normal levels, but several others remained below normal. The Massachusetts Water Resources Authority continued to urge customers to conserve water as the Quabbin Reservoir was at 82.1 percent of capacity on April 1, which was below normal. On April 20, Manchester, New Hampshire, officials lifted voluntary water restrictions that had been in effect since October 2016 as the city's water supply had returned to full capacity. According to an April 21 press release, all of Connecticut Water's reservoirs throughout the state were at 100 percent of capacity, so the water supply advisory was lifted. Aquarion's Bridgeport and Greenwich (Connecticut) reservoirs were at near to above-average capacity as of April 24 but its Stamford reservoir was still below-average capacity at 88.4 percent as of April 25. With improving conditions, drought declarations in several states eased. Eastern Maryland improved from a Drought Watch to normal status as of March 31. Effective April 1, the Connecticut River Valley and southeast Massachusetts improved to a Drought Advisory from a Drought Watch, while western Massachusetts improved to normal status from a Drought Advisory. On April 6, Mifflin and Union counties in Pennsylvania improved from a Drought Warning to a Drought Watch, while four other counties improved from a Drought Watch to normal status. As of April 12, the Drought Warning was lifted for 12 counties in New Jersey and the Drought Watch was lifted for four other counties, returning those 16 counties to normal status. Hunterdon and Somerset counties remained in a Drought Warning because the reservoirs that serve those areas remained below normal.
As summarized by the Western Regional Climate Center, temperatures were near normal across most of the West this month, with some areas of above normal temperatures along the far southern boundary of the region. Precipitation was variable across the West, though with generally wetter than normal conditions across the northern half of the region and drier than normal conditions across southern portions of California, Nevada, and Arizona. Above-normal rainfall prompted improvements in drought conditions for eastern New Mexico this month. Drier-than-normal conditions dominated far southern California, southern Nevada, and much of Arizona this month, not uncommon for the spring season. Only 3.8% of the West is currently denoted as having moderate drought conditions or worse; most of this area is in southern California and southwestern Arizona.
April was warmer and drier than normal across Alaska. Stations north of the Arctic Circle experienced the greatest temperature departures from normal. April is typically a dry month in Alaska, and this year was no exception. The breakup of ice on various Alaska rivers typically occurs in April, and this year's breakups were within a few days of normal. Further south, above normal temperatures were observed at most reporting stations across the state of Hawaii. Precipitation was variable across the state, though most stations on Oahu and several on Maui reported above normal rainfall. Much of Big Island observed drier than normal conditions; 5.08 in (129 mm) of rain fell at Hilo, 44% of normal. The leeward side of the Big Island saw a small area of drought improvement, while abnormally dry conditions were introduced across the rest of the islands. Central Maui and western Molokai were classified as moderate drought this month.
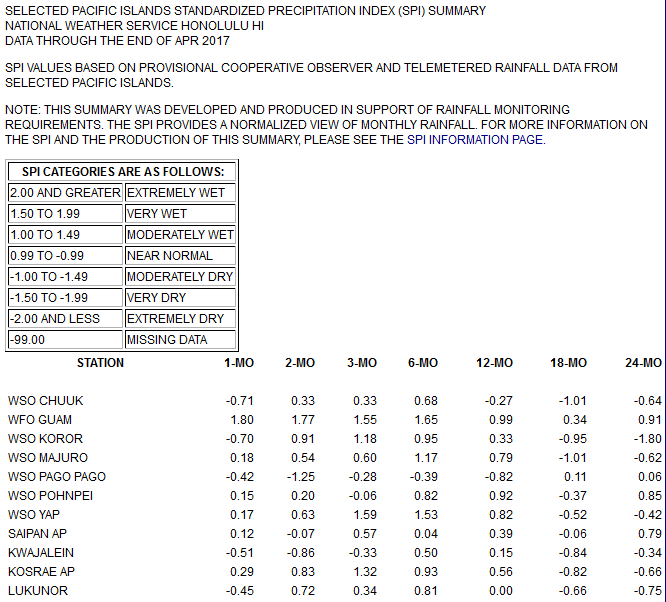
Pacific Islands: The NOAA National Weather Service (NWS) offices, the Pacific ENSO Applications Climate Center (PEAC), and partners provided reports on conditions across the Pacific Islands.
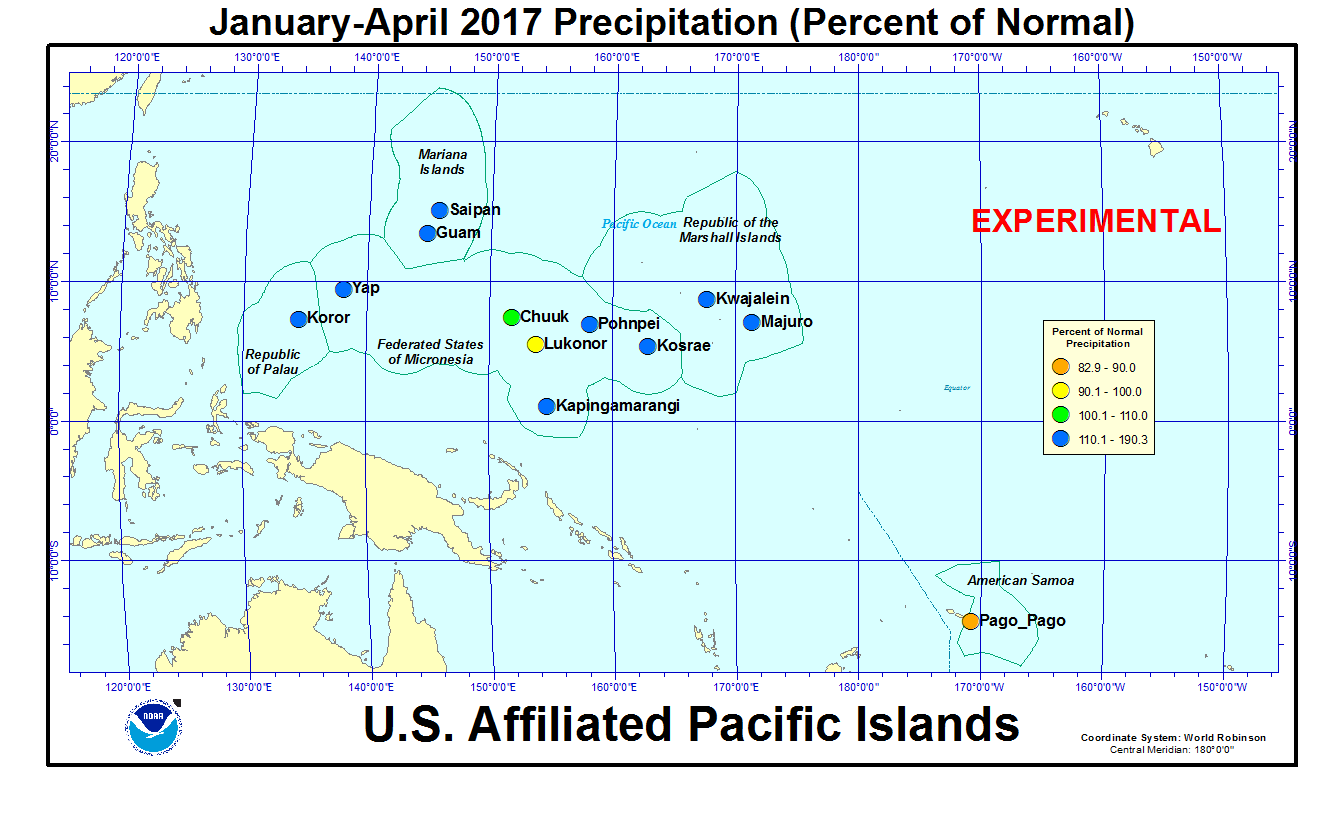
In the U.S. Affiliated Pacific Islands (USAPI) (maps — Federated States of Micronesia, Northern Mariana Islands, Marshall Islands, Republic of Palau, American Samoa, basinwide), April 2017 was drier than normal at Chuuk, Koror, Kwajalein, Lukonor, Pago Pago, and Pohnpei, and wetter than normal at the other stations.
Rainfall amounts were below the minimum thresholds (4 or 8 inches) required to meet most monthly water needs at Rota and Saipan (in the Mariana Islands); Koror (in the Republic of Palau); Yap, Chuuk, and Fananu (in the Federated States of Micronesia [FSM]); and Kwajalein, Utirik, and Wotje (in the Marshall Islands [RMI]). April rainfall was above the monthly minimum thresholds at the rest of the regular reporting stations in Micronesia. The 4- and 8-inch thresholds are important because, if monthly precipitation falls below the threshold, then water shortages or drought become a concern.
Significant dryness has developed in the northern Marshall Islands since December 2016. No measureable rain fell at Utirik during April 2017, and three of the last five months have had less than 2 inches each at Utirik and Wotje. The National Weather Service office on Guam issued a revised Drought Information Statement on May 4 which noted that drought is a serious concern for the northern Marshall Islands following an April 24th declaration of a state of emergency by the President of the RMI for the northern atolls and islands affected by the dry conditions.
As measured by percent of normal precipitation, Lukonor and Pago Pago have been drier than normal in the short term (April, the last 3 months [February-April], and the year-to-date [January-April]) as well as the long term (last 12 months [May 2016-April 2017]). Kwajalein and Pohnpei were dry in the short term (April and last 3 months) but wetter than normal for the year to date and last 12 months. Chuuk and Koror were dry for April but near to wetter than normal for the other 3 time scales. Kapingamarangi and Kosrae were drier than normal in the long term (last 12 months) but wetter than normal in the short term. Guam, Majuro, Saipan, and Yap were wetter than normal at all 4 time scales.
| Station Name | May 2016 | Jun 2016 | Jul 2016 | Aug 2016 | Sep 2016 | Oct 2016 | Nov 2016 | Dec 2016 | Jan 2017 | Feb 2017 | Mar 2017 | Apr 2017 | May- Apr |
|---|---|---|---|---|---|---|---|---|---|---|---|---|---|
| Chuuk | 107% | 91% | 94% | 74% | 86% | 58% | 98% | 176% | 113% | 114% | 189% | 60% | 98% |
| Guam NAS | 53% | 125% | 67% | 141% | 124% | 115% | 137% | 170% | 155% | 167% | 256% | 340% | 111% |
| Kapingamarangi | 34% | 24% | 66% | 91% | 77% | 26% | 71% | 114% | 159% | 207% | 126% | 159% | 83% |
| Koror | 115% | 93% | 45% | 61% | 115% | 153% | 144% | 64% | 131% | 175% | 245% | 76% | 100% |
| Kosrae | 72% | 130% | 88% | 88% | 89% | 90% | 56% | 168% | 103% | 213% | 150% | 112% | 95% |
| Kwajalein | 57% | 142% | 101% | 83% | 64% | 168% | 126% | 156% | 285% | 212% | 46% | 65% | 112% |
| Lukonor | 102% | 73% | 43% | 73% | 120% | 74% | 198% | 128% | 138% | 66% | 160% | 85% | 88% |
| Majuro | 110% | 66% | 90% | 75% | 123% | 120% | 129% | 103% | 228% | 138% | 199% | 110% | 117% |
| Pago Pago | 102% | 73% | 81% | 83% | 83% | 55% | 127% | 111% | 72% | 153% | 52% | 87% | 81% |
| Pohnpei | 80% | 143% | 79% | 112% | 144% | 120% | 115% | 142% | 182% | 71% | 115% | 96% | 113% |
| Saipan | 87% | 57% | 42% | 186% | 191% | 48% | 79% | 95% | 182% | 199% | 108% | 115% | 113% |
| Yap | 113% | 54% | 67% | 88% | 66% | 164% | 156% | 101% | 198% | 370% | 205% | 110% | 114% |
| Station Name | May 2016 | Jun 2016 | Jul 2016 | Aug 2016 | Sep 2016 | Oct 2016 | Nov 2016 | Dec 2016 | Jan 2017 | Feb 2017 | Mar 2017 | Apr 2017 | May- Apr |
|---|---|---|---|---|---|---|---|---|---|---|---|---|---|
| Chuuk | 12.11" | 10.61" | 11.27" | 9.50" | 10.04" | 6.73" | 10.39" | 19.83" | 11.37" | 8.27" | 15.74" | 7.51" | 133.37" |
| Guam NAS | 1.80" | 7.73" | 6.77" | 20.85" | 15.65" | 13.14" | 10.13" | 8.68" | 6.22" | 5.06" | 5.30" | 8.60" | 109.93" |
| Kapingamarangi | 4.07" | 3.30" | 9.33" | 7.38" | 7.61" | 2.14" | 6.58" | 11.22" | 14.54" | 19.18" | 14.44" | 21.70" | 121.49" |
| Koror | 13.55" | 16.25" | 8.28" | 8.20" | 13.51" | 18.06" | 16.38" | 7.13" | 13.30" | 14.99" | 18.26" | 5.54" | 153.45" |
| Kosrae | 12.70" | 18.99" | 13.07" | 12.48" | 12.71" | 9.87" | 7.76" | 26.99" | 17.21" | 27.51" | 24.16" | 19.62" | 203.07" |
| Kwajalein | 3.80" | 9.81" | 9.96" | 8.12" | 6.90" | 18.73" | 14.16" | 10.36" | 9.00" | 5.60" | 1.07" | 3.44" | 100.95" |
| Lukonor | 11.92" | 8.49" | 6.84" | 10.31" | 12.23" | 8.41" | 18.02" | 14.42" | 11.58" | 5.90" | 14.83" | 9.61" | 132.56" |
| Majuro | 11.12" | 7.27" | 10.09" | 8.78" | 13.73" | 15.28" | 17.36" | 11.77" | 17.65" | 9.50" | 13.07" | 10.36" | 145.98" |
| Pago Pago | 9.89" | 3.88" | 4.48" | 4.49" | 5.45" | 5.12" | 12.86" | 14.24" | 9.57" | 18.32" | 5.60" | 8.14" | 102.04" |
| Pohnpei | 16.06" | 21.18" | 12.12" | 15.91" | 18.13" | 18.39" | 17.00" | 22.83" | 24.00" | 6.76" | 15.16" | 17.68" | 205.22" |
| Saipan | 2.07" | 2.05" | 3.76" | 24.40" | 19.31" | 5.07" | 4.42" | 3.67" | 4.61" | 5.15" | 2.04" | 3.02" | 79.57" |
| Yap | 8.90" | 6.46" | 10.03" | 13.10" | 8.89" | 20.00" | 13.78" | 8.59" | 12.67" | 19.19" | 9.35" | 6.19" | 137.15" |
| Station Name | May 2016 | Jun 2016 | Jul 2016 | Aug 2016 | Sep 2016 | Oct 2016 | Nov 2016 | Dec 2016 | Jan 2017 | Feb 2017 | Mar 2017 | Apr 2017 | May- Apr |
|---|---|---|---|---|---|---|---|---|---|---|---|---|---|
| Chuuk | 11.30" | 11.66" | 11.98" | 12.86" | 11.71" | 11.51" | 10.61" | 11.25" | 10.10" | 7.25" | 8.32" | 12.47" | 136.77" |
| Guam NAS | 3.40" | 6.18" | 10.14" | 14.74" | 12.66" | 11.44" | 7.38" | 5.11" | 4.01" | 3.03" | 2.07" | 2.53" | 99.09" |
| Kapingamarangi | 12.08" | 13.78" | 14.15" | 8.13" | 9.93" | 8.19" | 9.27" | 9.84" | 9.15" | 9.27" | 11.43" | 13.64" | 145.85" |
| Koror | 11.83" | 17.48" | 18.53" | 13.50" | 11.77" | 11.84" | 11.39" | 11.16" | 10.18" | 8.56" | 7.44" | 7.32" | 152.90" |
| Kosrae | 17.75" | 14.64" | 14.91" | 14.22" | 14.22" | 10.94" | 13.83" | 16.11" | 16.67" | 12.93" | 16.06" | 17.51" | 213.87" |
| Kwajalein | 6.72" | 6.93" | 9.87" | 9.74" | 10.74" | 11.18" | 11.28" | 6.66" | 3.16" | 2.64" | 2.35" | 5.26" | 90.41" |
| Lukonor | 11.69" | 11.65" | 15.93" | 14.04" | 10.15" | 11.32" | 9.08" | 11.27" | 8.41" | 8.93" | 9.26" | 11.31" | 151.36" |
| Majuro | 10.11" | 11.01" | 11.17" | 11.69" | 11.17" | 12.73" | 13.44" | 11.39" | 7.74" | 6.88" | 6.58" | 9.42" | 125.25" |
| Pago Pago | 9.66" | 5.33" | 5.55" | 5.38" | 6.53" | 9.26" | 10.14" | 12.84" | 13.34" | 12.00" | 10.68" | 9.39" | 125.57" |
| Pohnpei | 19.96" | 14.81" | 15.43" | 14.26" | 12.55" | 15.27" | 14.83" | 16.08" | 13.18" | 9.55" | 13.17" | 18.41" | 182.36" |
| Saipan | 2.38" | 3.62" | 8.91" | 13.13" | 10.09" | 10.62" | 5.61" | 3.85" | 2.53" | 2.59" | 1.89" | 2.63" | 70.25" |
| Yap | 7.85" | 12.04" | 15.08" | 14.82" | 13.50" | 12.18" | 8.83" | 8.51" | 6.39" | 5.19" | 4.56" | 5.63" | 120.31" |
An analysis of historical data for the USAPI stations in the Global Historical Climatology Network-Daily (GHCN-D) dataset, augmented with fill-in data from the 1981-2010 Normals, indicated that long-term dryness persisted at a few stations and short-term dryness has developed at a few others, but wet conditions dominated otherwise. The following table lists the precipitation ranks for April 2017, November 2016-April 2017 (last 6 months), and May 2016-April 2017 (the last 12 months). Some stations have a long period of record and their dataset is fairly complete, while other stations have a shorter period of record and the dataset has some missing data. Stations with low ranks for the last 12 months (May 2016-April 2017) include: Kapingamarangi with the third driest May-April out of 12 years of data, and Pago Pago with the eleventh driest out of 51 years.
Rank of 1 = driest.
| Station | Apr 2017 Rank |
Apr No. of Years |
Nov 2016- Apr 2017 Rank |
Nov- Apr No. of Years |
May 2016- Apr 2017 Rank |
May- Apr No. of Years |
Period of Record |
| Jaluit | 17 | 34 | 26 | 32 | 15 | 32 | 1981-2017 |
| Koror | 15 | 66 | 56 | 66 | 37 | 65 | 1951-2017 |
| Woleai | 21 | 38 | 13 | 28 | 11 | 20 | 1968-2017 |
| Yap | 36 | 66 | 65 | 66 | 51 | 65 | 1951-2017 |
| Majuro | 34 | 63 | 55 | 63 | 47 | 62 | 1954-2017 |
| Ulithi | 35 | 36 | MSG | 34 | MSG | 33 | 1981-2017 |
| Ailinglapalap | 23 | 34 | 31 | 32 | 28 | 31 | 1981-2017 |
| Kosrae | 24 | 47 | 26 | 37 | 15 | 30 | 1954-2017 |
| Lukonor | 11 | 33 | 27 | 31 | 9 | 20 | 1981-2017 |
| Saipan | 23 | 37 | 21 | 28 | 22 | 28 | 1981-2017 |
| Pohnpei | 33 | 66 | 55 | 66 | 55 | 65 | 1951-2017 |
| Kwajalein | 16 | 65 | 43 | 65 | 40 | 65 | 1952-2017 |
| Kapingamarangi | 24 | 25 | 18 | 20 | 3 | 12 | 1962-2017 |
| Chuuk | 16 | 66 | 53 | 66 | 21 | 65 | 1951-2017 |
| Guam | 56 | 61 | 56 | 60 | 45 | 60 | 1957-2017 |
| Nukuoro | 19 | 34 | 29 | 32 | 24 | 31 | 1981-2017 |
| Pago Pago | 17 | 52 | 18 | 51 | 11 | 51 | 1966-2017 |
| Wotje | 27 | 34 | 19 | 31 | 24 | 31 | 1981-2017 |
| Utirik | 1 | 16 | MSG | 6 | MSG | 2 | 1985-2017 |


[top]
State/Regional/National Moisture Status
A detailed review of drought and moisture conditions is available for all contiguous U.S. states, the nine standard regions, and the nation (contiguous U.S.):
| northeast u. s. | east north central u. s. | central u. s. |
| southeast u. s. | west north central u. s. | south u. s. |
| southwest u. s. | northwest u. s. | west u. s. |
| Contiguous United States |
[top]
Contacts & Questions