|
Contents Of This Report: |


|
Please note that the values presented in this report are based on preliminary data. They will change when the final data are processed, but will not be replaced on these pages.
National Drought Overview
|
|
[top]
Detailed Drought Discussion
Overview

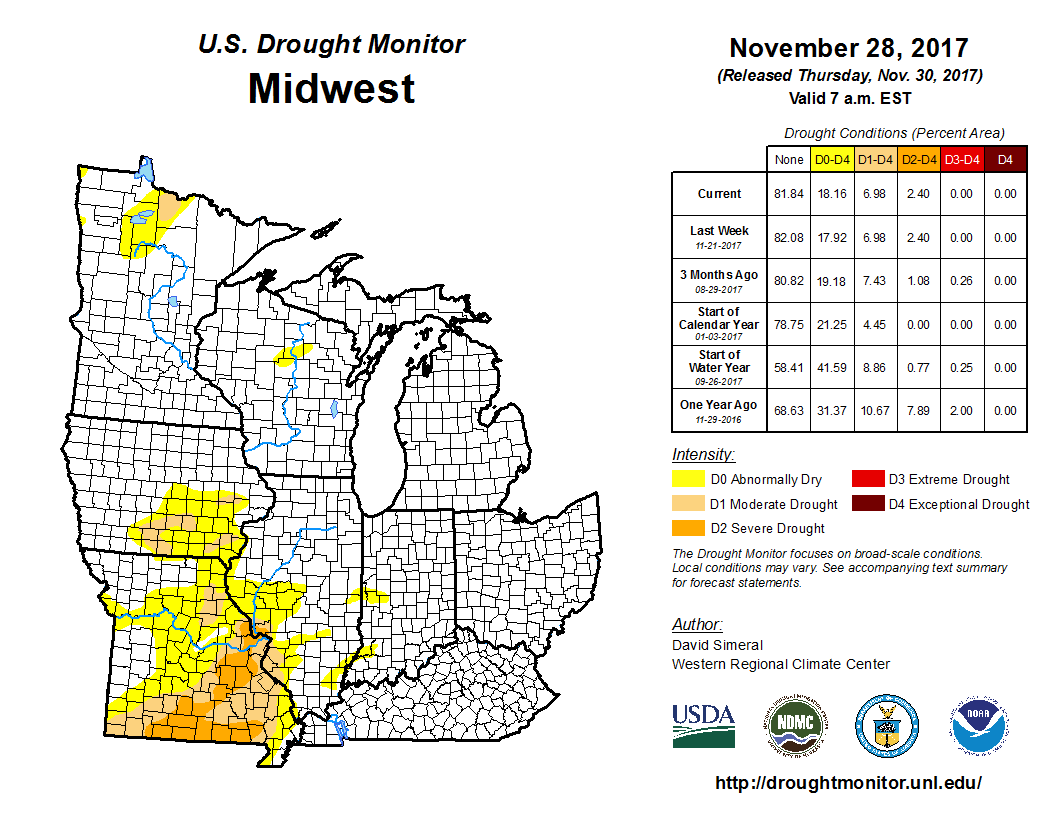
The U.S. Drought Monitor drought map valid November 28, 2017.
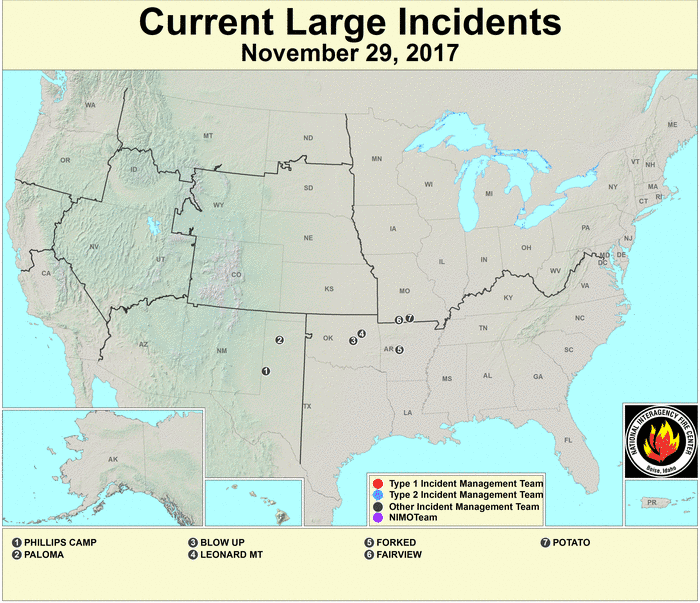
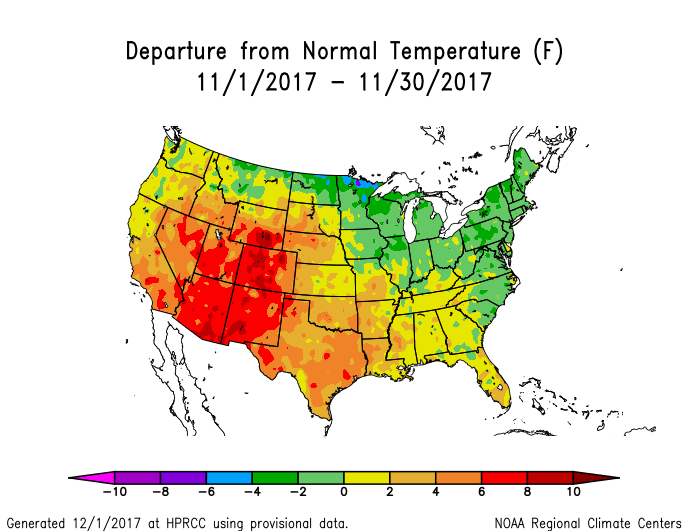
During November 2017, the storm track kept mostly along the northern states, bringing above-normal precipitation to the Pacific Northwest, northern Rockies, and part of the Midwest. Part of Florida was wetter than normal due to rain associated with frontal systems, and parts of Hawaii (especially the Big Island) received beneficial rain. But a zonal circulation, followed by an upper-level ridge-West/trough-East pattern, kept much of the CONUS drier than normal. Excessive warmth in the Southwest to southern Plains and Lower Mississippi Valley increased evapotranspiration which exacerbated the dry conditions, resulting in expansion of abnormal dryness and drought in those regions. Abnormal dryness and drought also expanded in the Southeast to parts of the Northeast, where the month was dry. The hot and dry conditions in the southern Plains contributed to the development of several large wildfires near the end of the month. The above-normal precipitation in the Pacific Northwest, northern Rockies, and parts of the Midwest, and wet conditions over parts of Hawaii, helped to contract drought and abnormal dryness in those regions. Expansion outweighed contraction, so the USDM-based national moderate-to-exceptional drought footprint across the CONUS expanded from 12.0 percent of the CONUS at the end of October to 21.1 percent of the CONUS at the end of November (from 10.1 percent to 17.7 percent for all of the U.S.). According to the Palmer Drought Index, which goes back to the beginning of the 20th century, about 14.3 percent of the CONUS was in moderate to extreme drought at the end of November, an increase from last month's 10.6 percent.

Drought conditions at the end of the month, as depicted on the November 28th, 2017 USDM map, included the following core drought and abnormally dry areas:
- There was some contraction in Montana, but abnormal dryness (D0) to extreme (D3) drought continued in the northern High Plains — This status mainly reflected long-term precipitation deficits (last 6, 9, 12 months) and the Palmer Drought Index, but also dry soils (USDA observations, SMOS satellite observations, and CPC, Leaky Bucket, VIC, NLDAS top and total layer models) and poor crop conditions (November 26th USDA reports indicate 38 percent of the winter wheat crop is in poor to very poor condition in South Dakota).
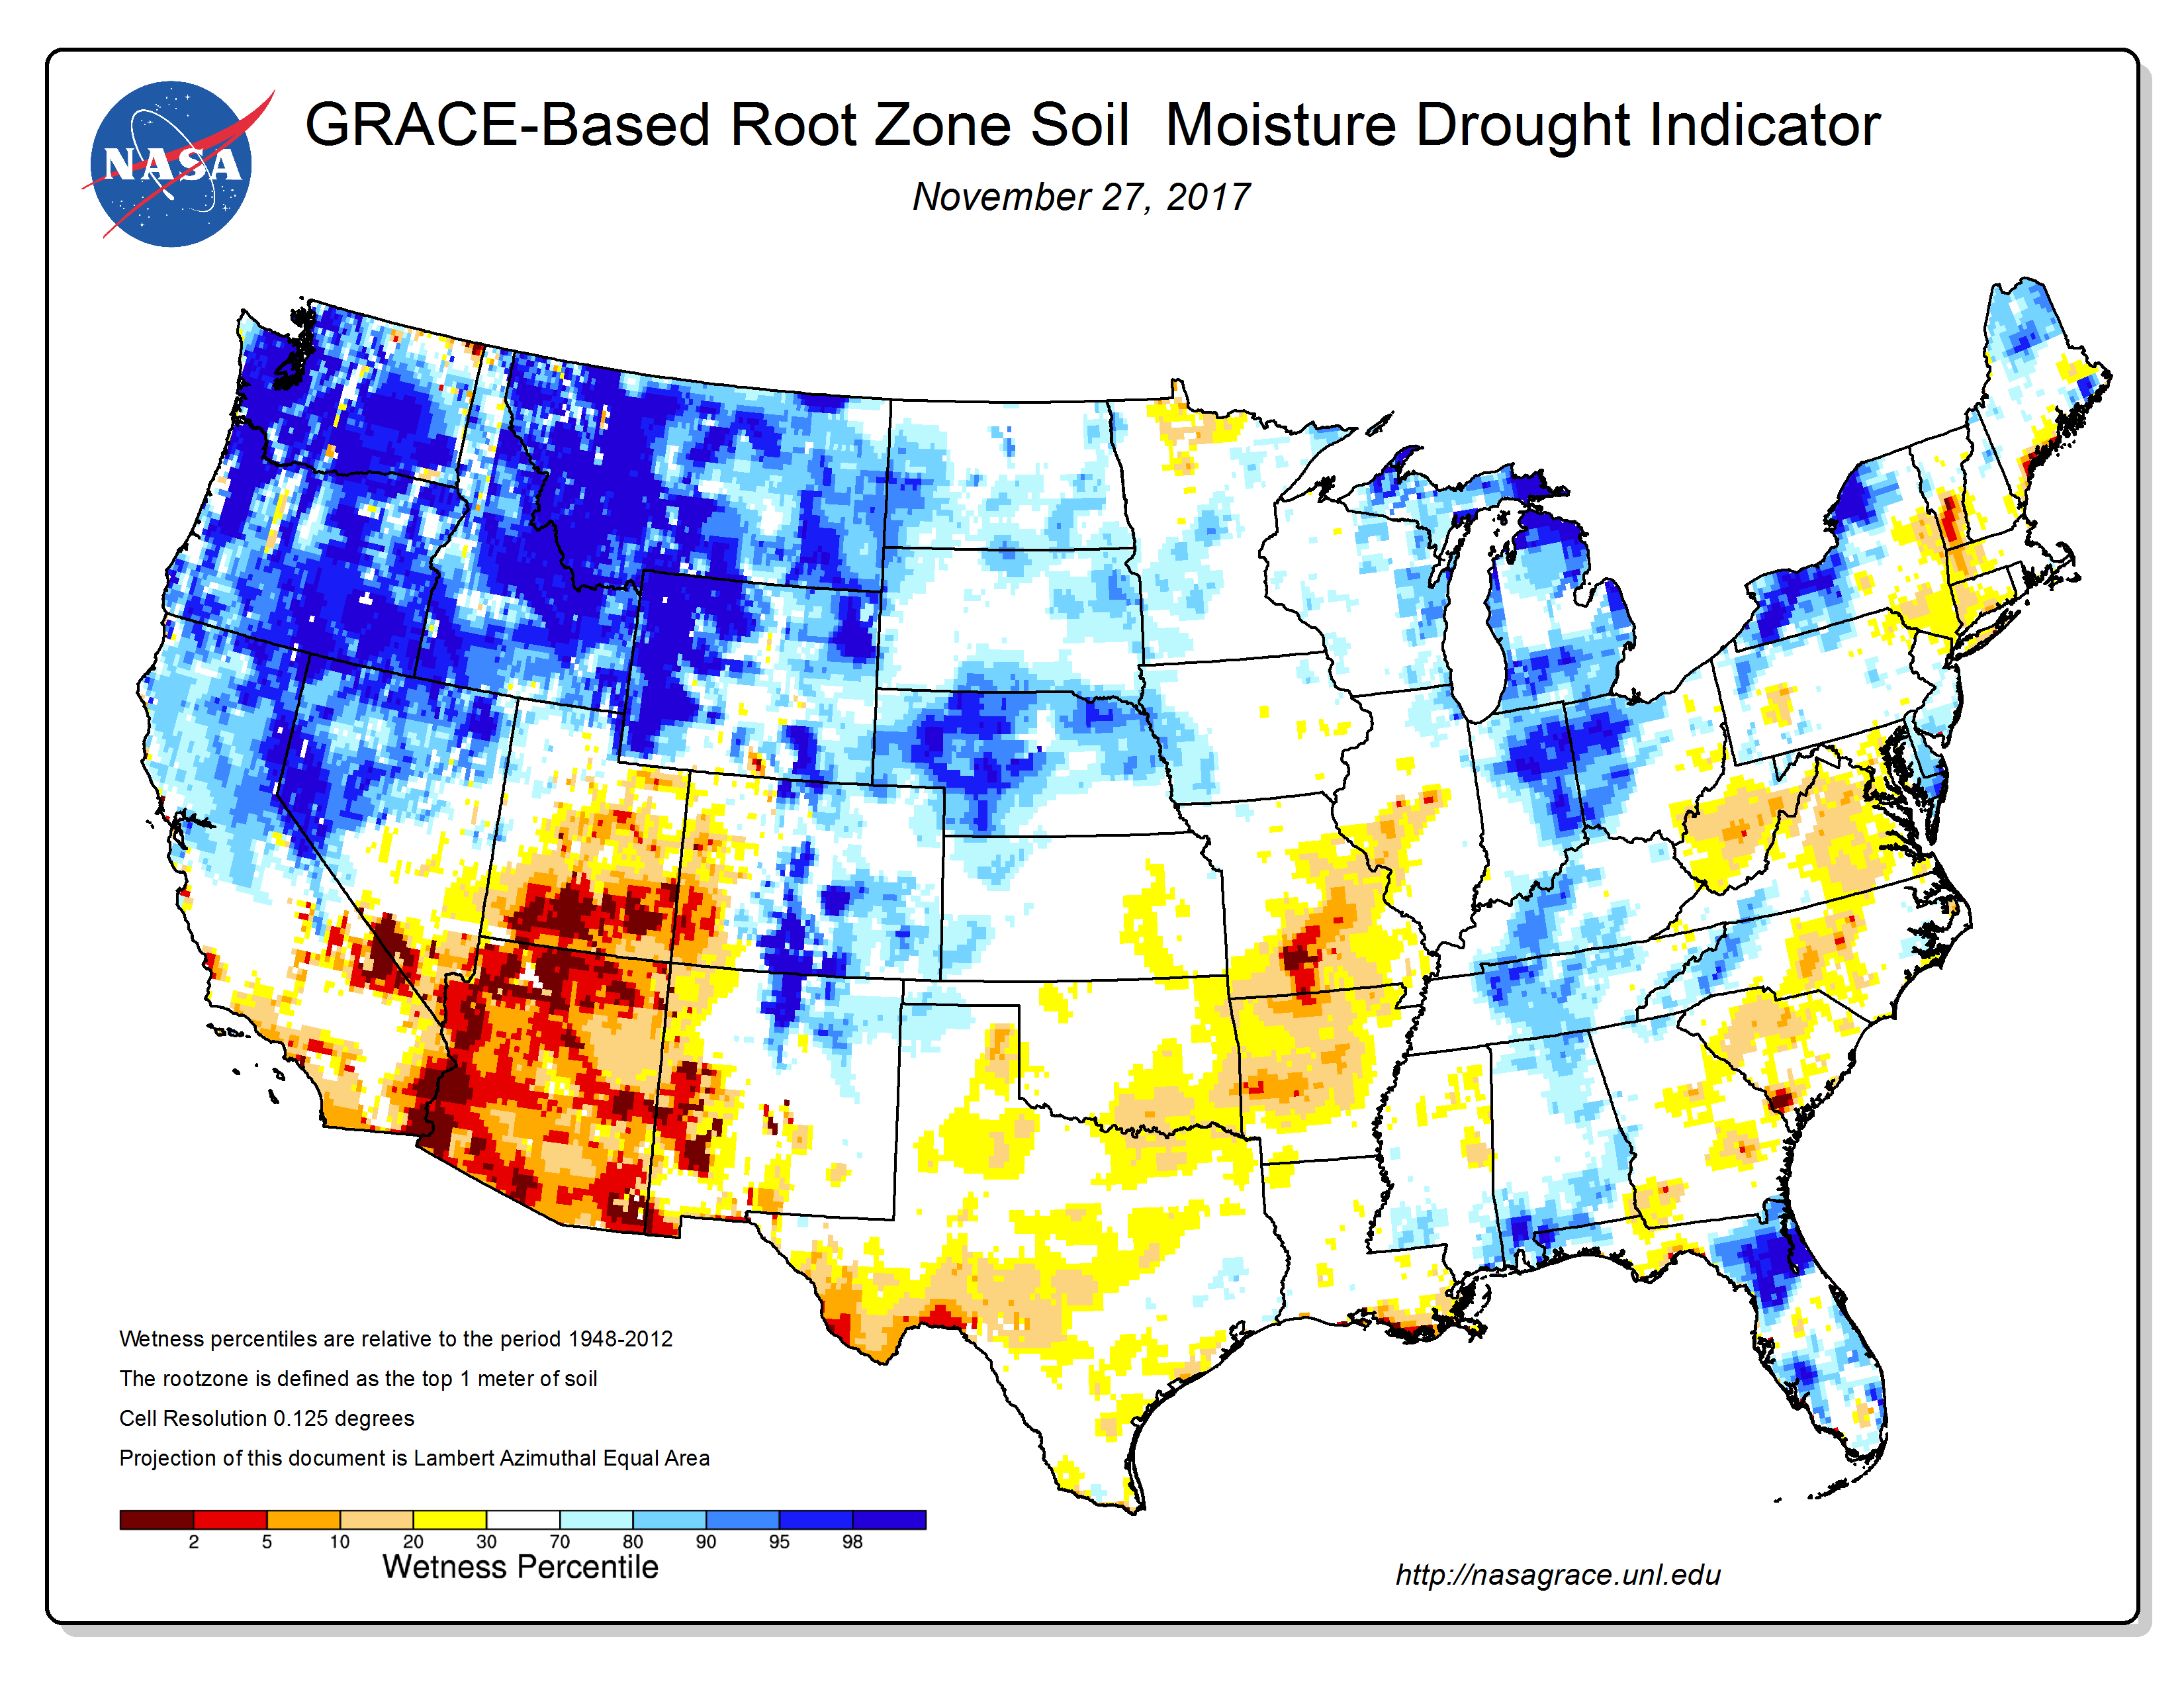
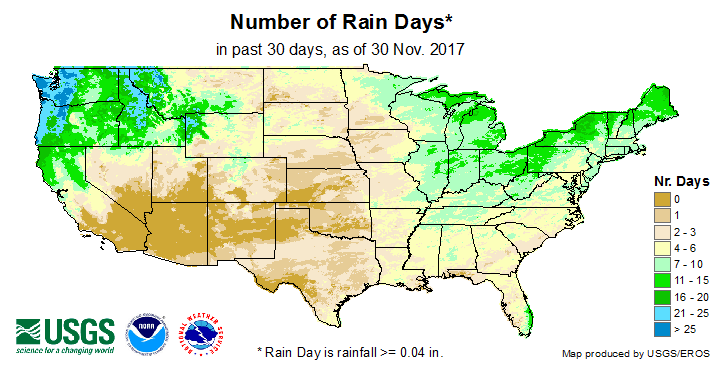
- Abnormal dryness to moderate (D1) drought expanded, and severe (D2) to extreme drought developed, in the central and southern Plains to Lower and Mid-Mississippi Valley — These conditions were reflected in low groundwater (NASA GRACE model), streamflow, soil moisture (USDA observations, SMOS satellite observations, and CPC, Leaky Bucket, VIC, NASA GRACE, NLDAS top and total layer models), the QuickDRI index, and USGS number of rain days and consecutive dry days.
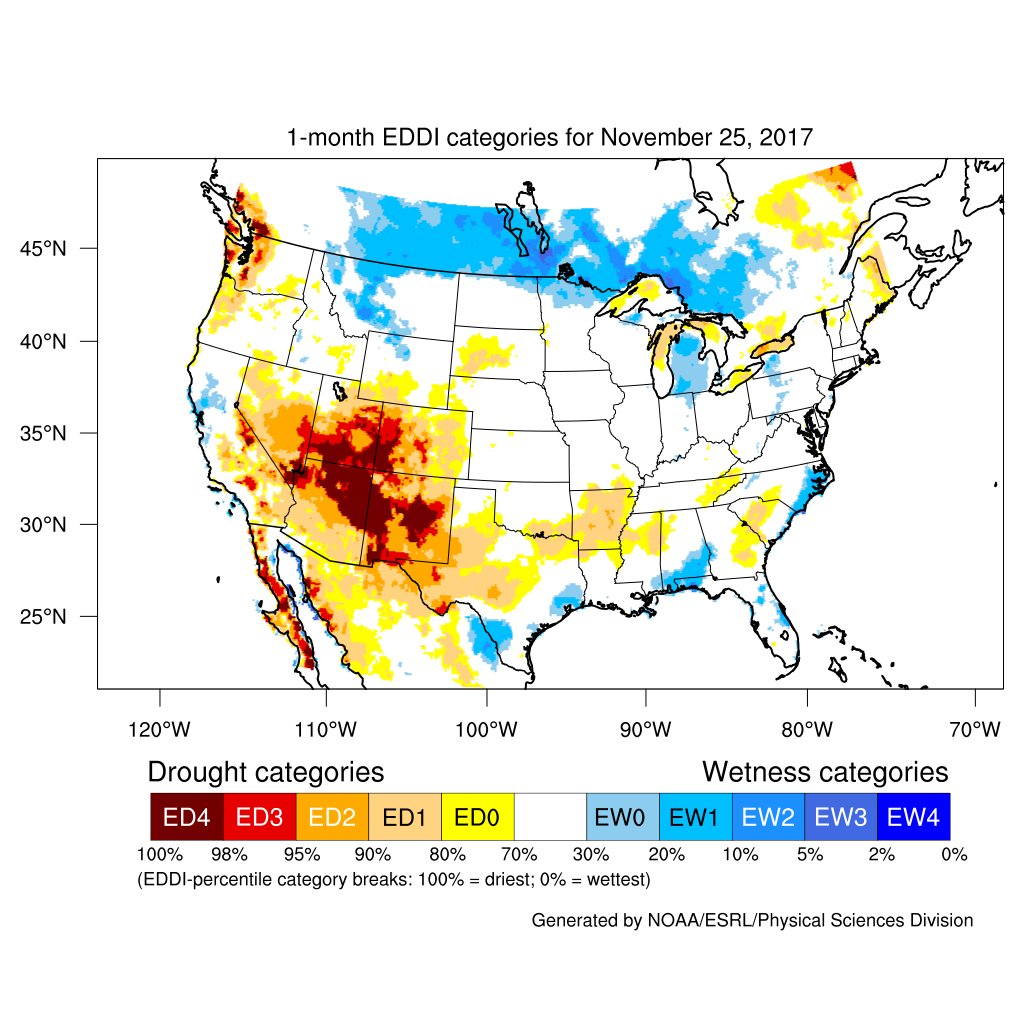
- In the West, abnormal dryness and drought disappeared in the Pacific Northwest, but abnormal dryness and moderate drought expanded in the Southwest and Great Basin — This was reflected in indices for evapotranspiration (EDDI) and mountain snow water content, groundwater (NASA GRACE model), streamflow, soil moisture (USDA observations, SMOS satellite observations, and CPC, Leaky Bucket, VIC, NASA GRACE, NLDAS top and total layer models), the QuickDRI index, and USGS number of rain days and consecutive dry days.
- Abnormal dryness and moderate drought expanded in the Southeast and Mid-Atlantic states — This was reflected in indicators for groundwater (NASA GRACE model), streamflow, and soil moisture (USDA observations, SMOS satellite observations, and CPC, Leaky Bucket, VIC, NASA GRACE, NLDAS top and total layer models).
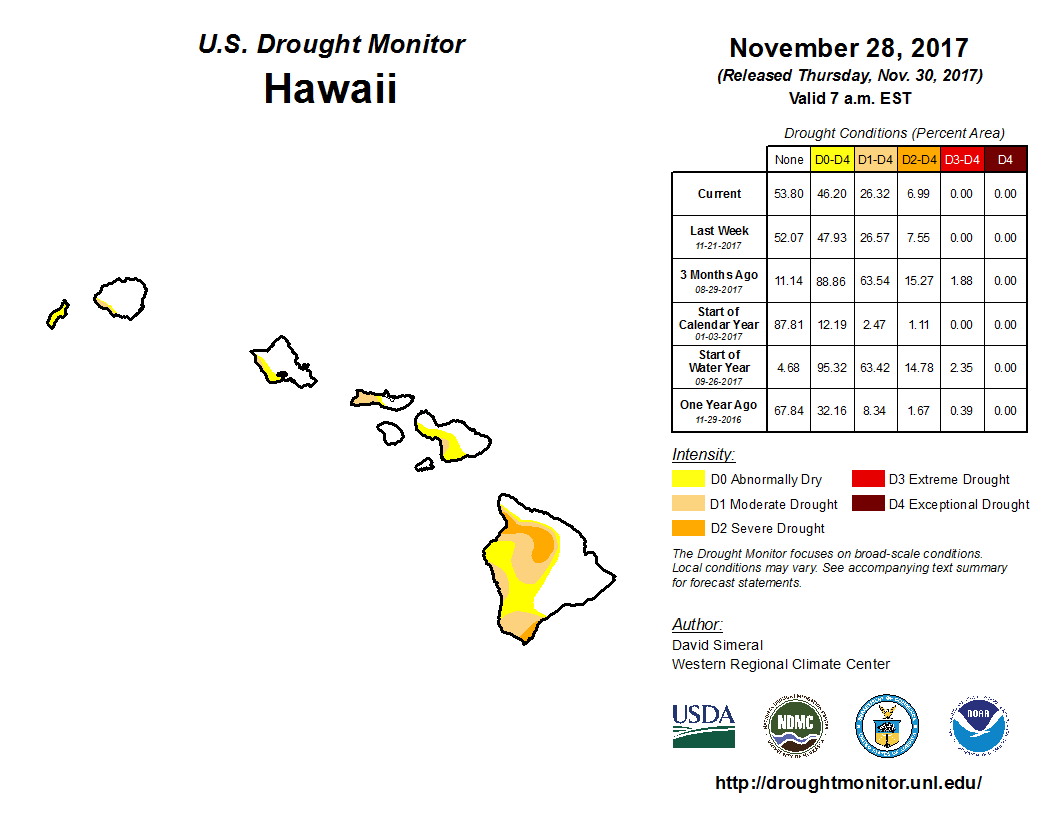
- Abnormally dry to severe drought conditions contracted, and extreme drought disappeared, in Hawaii.
Abnormal dryness shrank in some parts of the Northeast and developed in other parts. Abnormal dryness and moderate drought disappeared in eastern parts of the Midwest but lingered in western parts. There was no drought or abnormal dryness in Puerto Rico and Alaska.
Palmer Drought Index
The Palmer drought indices measure the balance between moisture demand (evapotranspiration driven by temperature) and moisture supply (precipitation). The Palmer Z Index depicts moisture conditions for the current month, while the Palmer Hydrological Drought Index (PHDI) and Palmer Drought Severity Index (PDSI) depict the current month's cumulative moisture conditions integrated over the last several months. While both the PDSI and PHDI indices show long-term moisture conditions, the PDSI depicts meteorological drought while the PHDI depicts hydrological drought. The PDSI map shows less severe and extensive drought (as well as wet spell conditions) in parts of the country than the PHDI map because the meteorological conditions that produce drought and wet spell conditions are not as long-lasting as the hydrological impacts.
|
 |
Used together, the Palmer Z Index and PHDI maps show that short-term dry conditions occurred across parts of the southern Plains to Southeast and Northeast, decreasing previous long-term wetness and, for the Southeast and Northeast, expanding or introducing long-term drought. Short-term dry conditions occurred across the Southwest, expanding and intensifying previous long-term drought. Short-term near-normal to wet conditions over the Northwest to northern California contracted previous long-term drought. Short-term wet conditions over parts of the Midwest expanded previous long-term wet conditions.
Standardized Precipitation Index
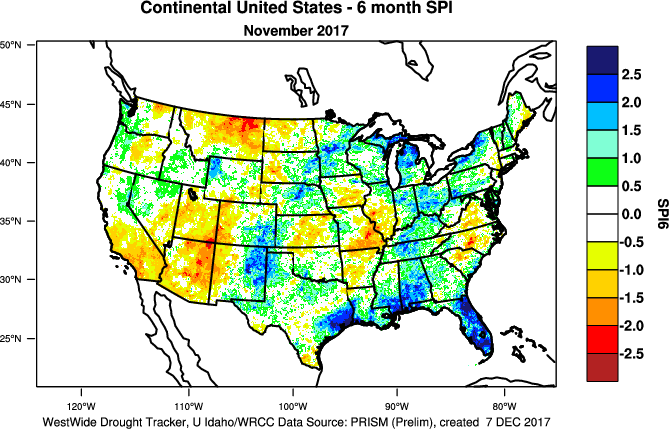
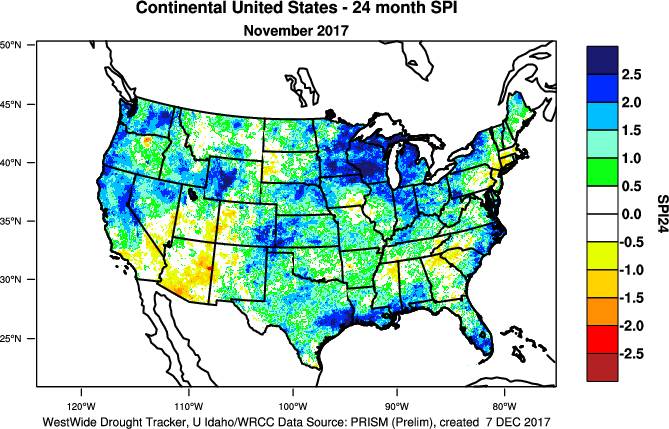
The Standardized Precipitation Index (SPI) measures moisture supply. The SPI maps here show the spatial extent of anomalously wet and dry areas at time scales ranging from 1 month to 24 months.
 |
 |
 |

The SPI maps illustrate how moisture conditions have varied considerably through time and space over the last two years. Dryness across much of the Southwest is evident at the 1- to 9-month time scales, but parts of southern Arizona are dry at all time scales. Much of the northern High Plains is dry at the 6- to 12-month time scales, and parts are dry at all of the other time scales. Parts of the central Plains (Nebraska) are dry for the last month, but wet at all other time scales. Most of the southern Plains to Lower and Mid-Mississippi Valley is dry for the last 1 to 3 months, and dryness is evident in the Mid-Mississippi Valley at 6 months, but otherwise near-normal to wet conditions dominate. Most of the Southeast is dry for the last month, but parts are dry at all of the other time scales. Most of the Northeast is dry at the 1-month time scale, and parts are dry at the 3-, 6-, and 24-month time scales. The western part of the Midwest (western Great Lakes) is dry at the 1-month time scale, but otherwise wet conditions mostly dominate the Midwest. Parts of the Pacific Northwest are dry at the 6-month time scale, but otherwise wet conditions dominate.
 |
 |
 |
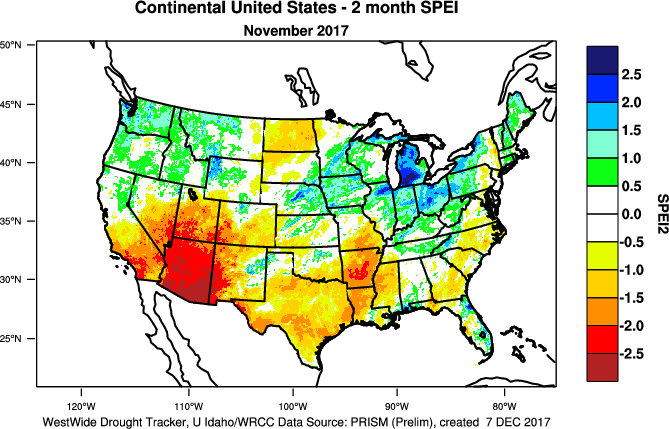
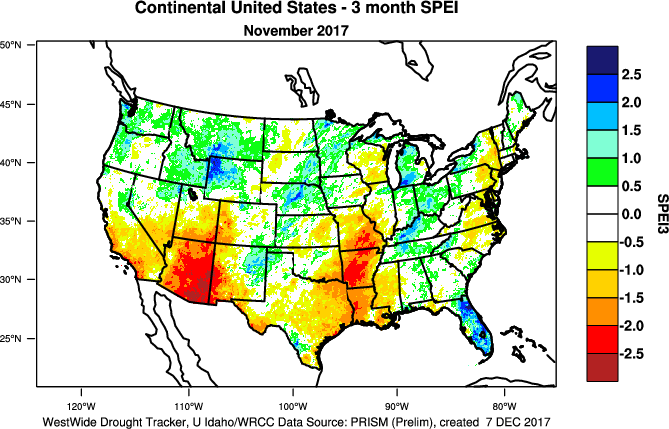
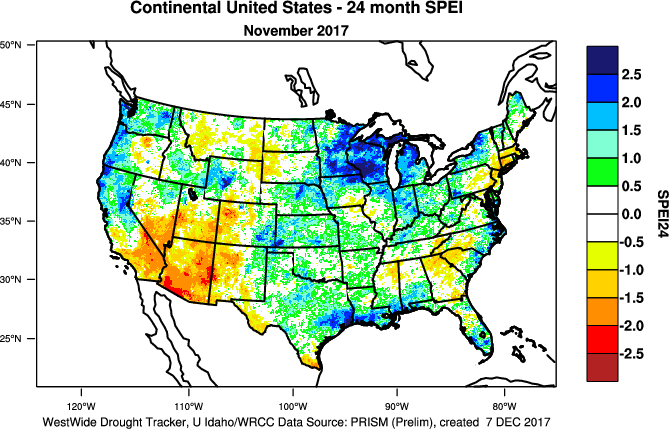
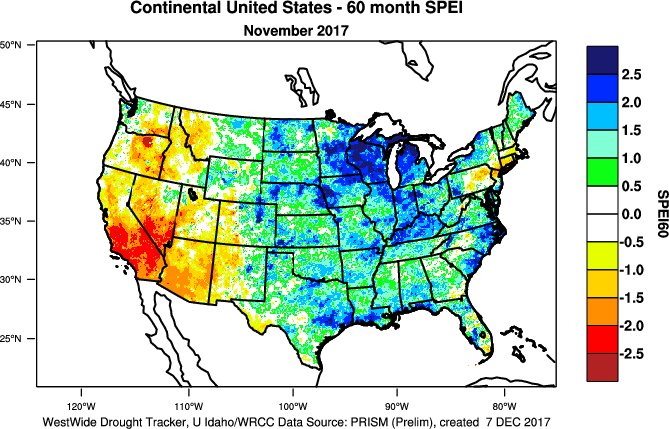
Standardized Precipitation Evapotranspiration Index
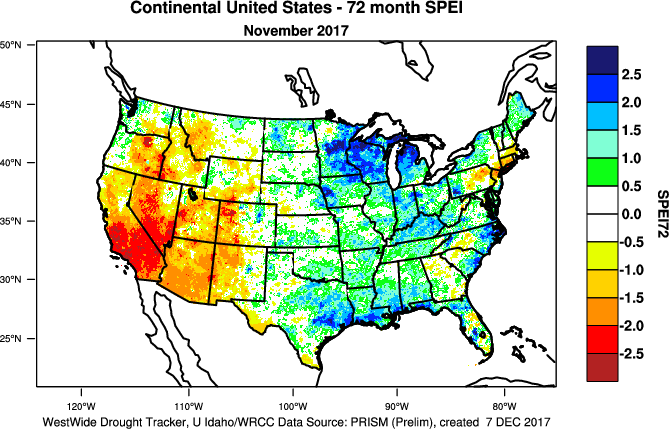
The SPI measures water supply (precipitation), while the SPEI (Standardized Precipitation Evapotranspiration Index) measures the combination of water supply (precipitation) and water demand (evapotranspiration as computed from temperature). Warmer temperatures tend to increase evapotranspiration, which generally makes droughts more intense.
 1-month SPEI for current month.
|
 1-month SPI for current month.
|

1-month SPEI, Arizona, November, 1895-2017.
November 2017 was record hot in the Southwest, with all Four Corners states having the warmest November on record. The warmth resulted in a more extreme SPEI than SPI in this region for November. The record warmth, coupled with the 11th driest November on record, gave Arizona the most extreme November SPEI on record. The SPI tied for sixth driest on record.
Unusual warmth over parts of the Southwest during the last three to four months exacerbated the unusually dry conditions (SPEI maps for last 2 and 3 months vs. SPI maps for last 2 and 3 months). Arizona had the most extreme 2-, 3-, and 4-month SPEI on record for the state. This compares to the SPI which ranked second, third, and fourth driest, respectively, for the state.
Arkansas was record dry for the last three months, while temperatures were not as extreme (only 21st warmest). The 3-month SPEI ranked fourth most extreme for the state, while the SPI came in at second most extreme.
 1-month SPEI for current month.
|
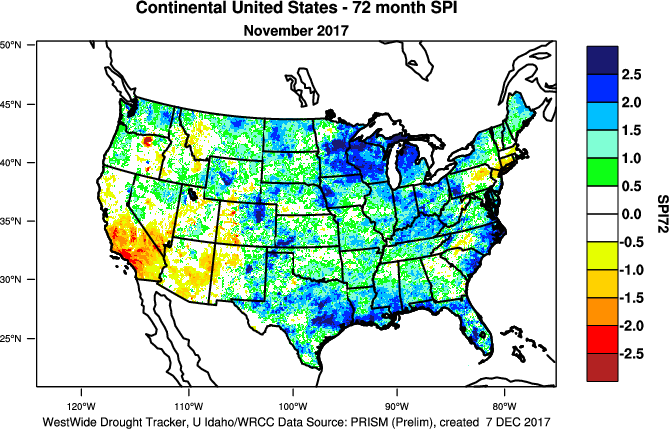 72-month SPI for current month.
|

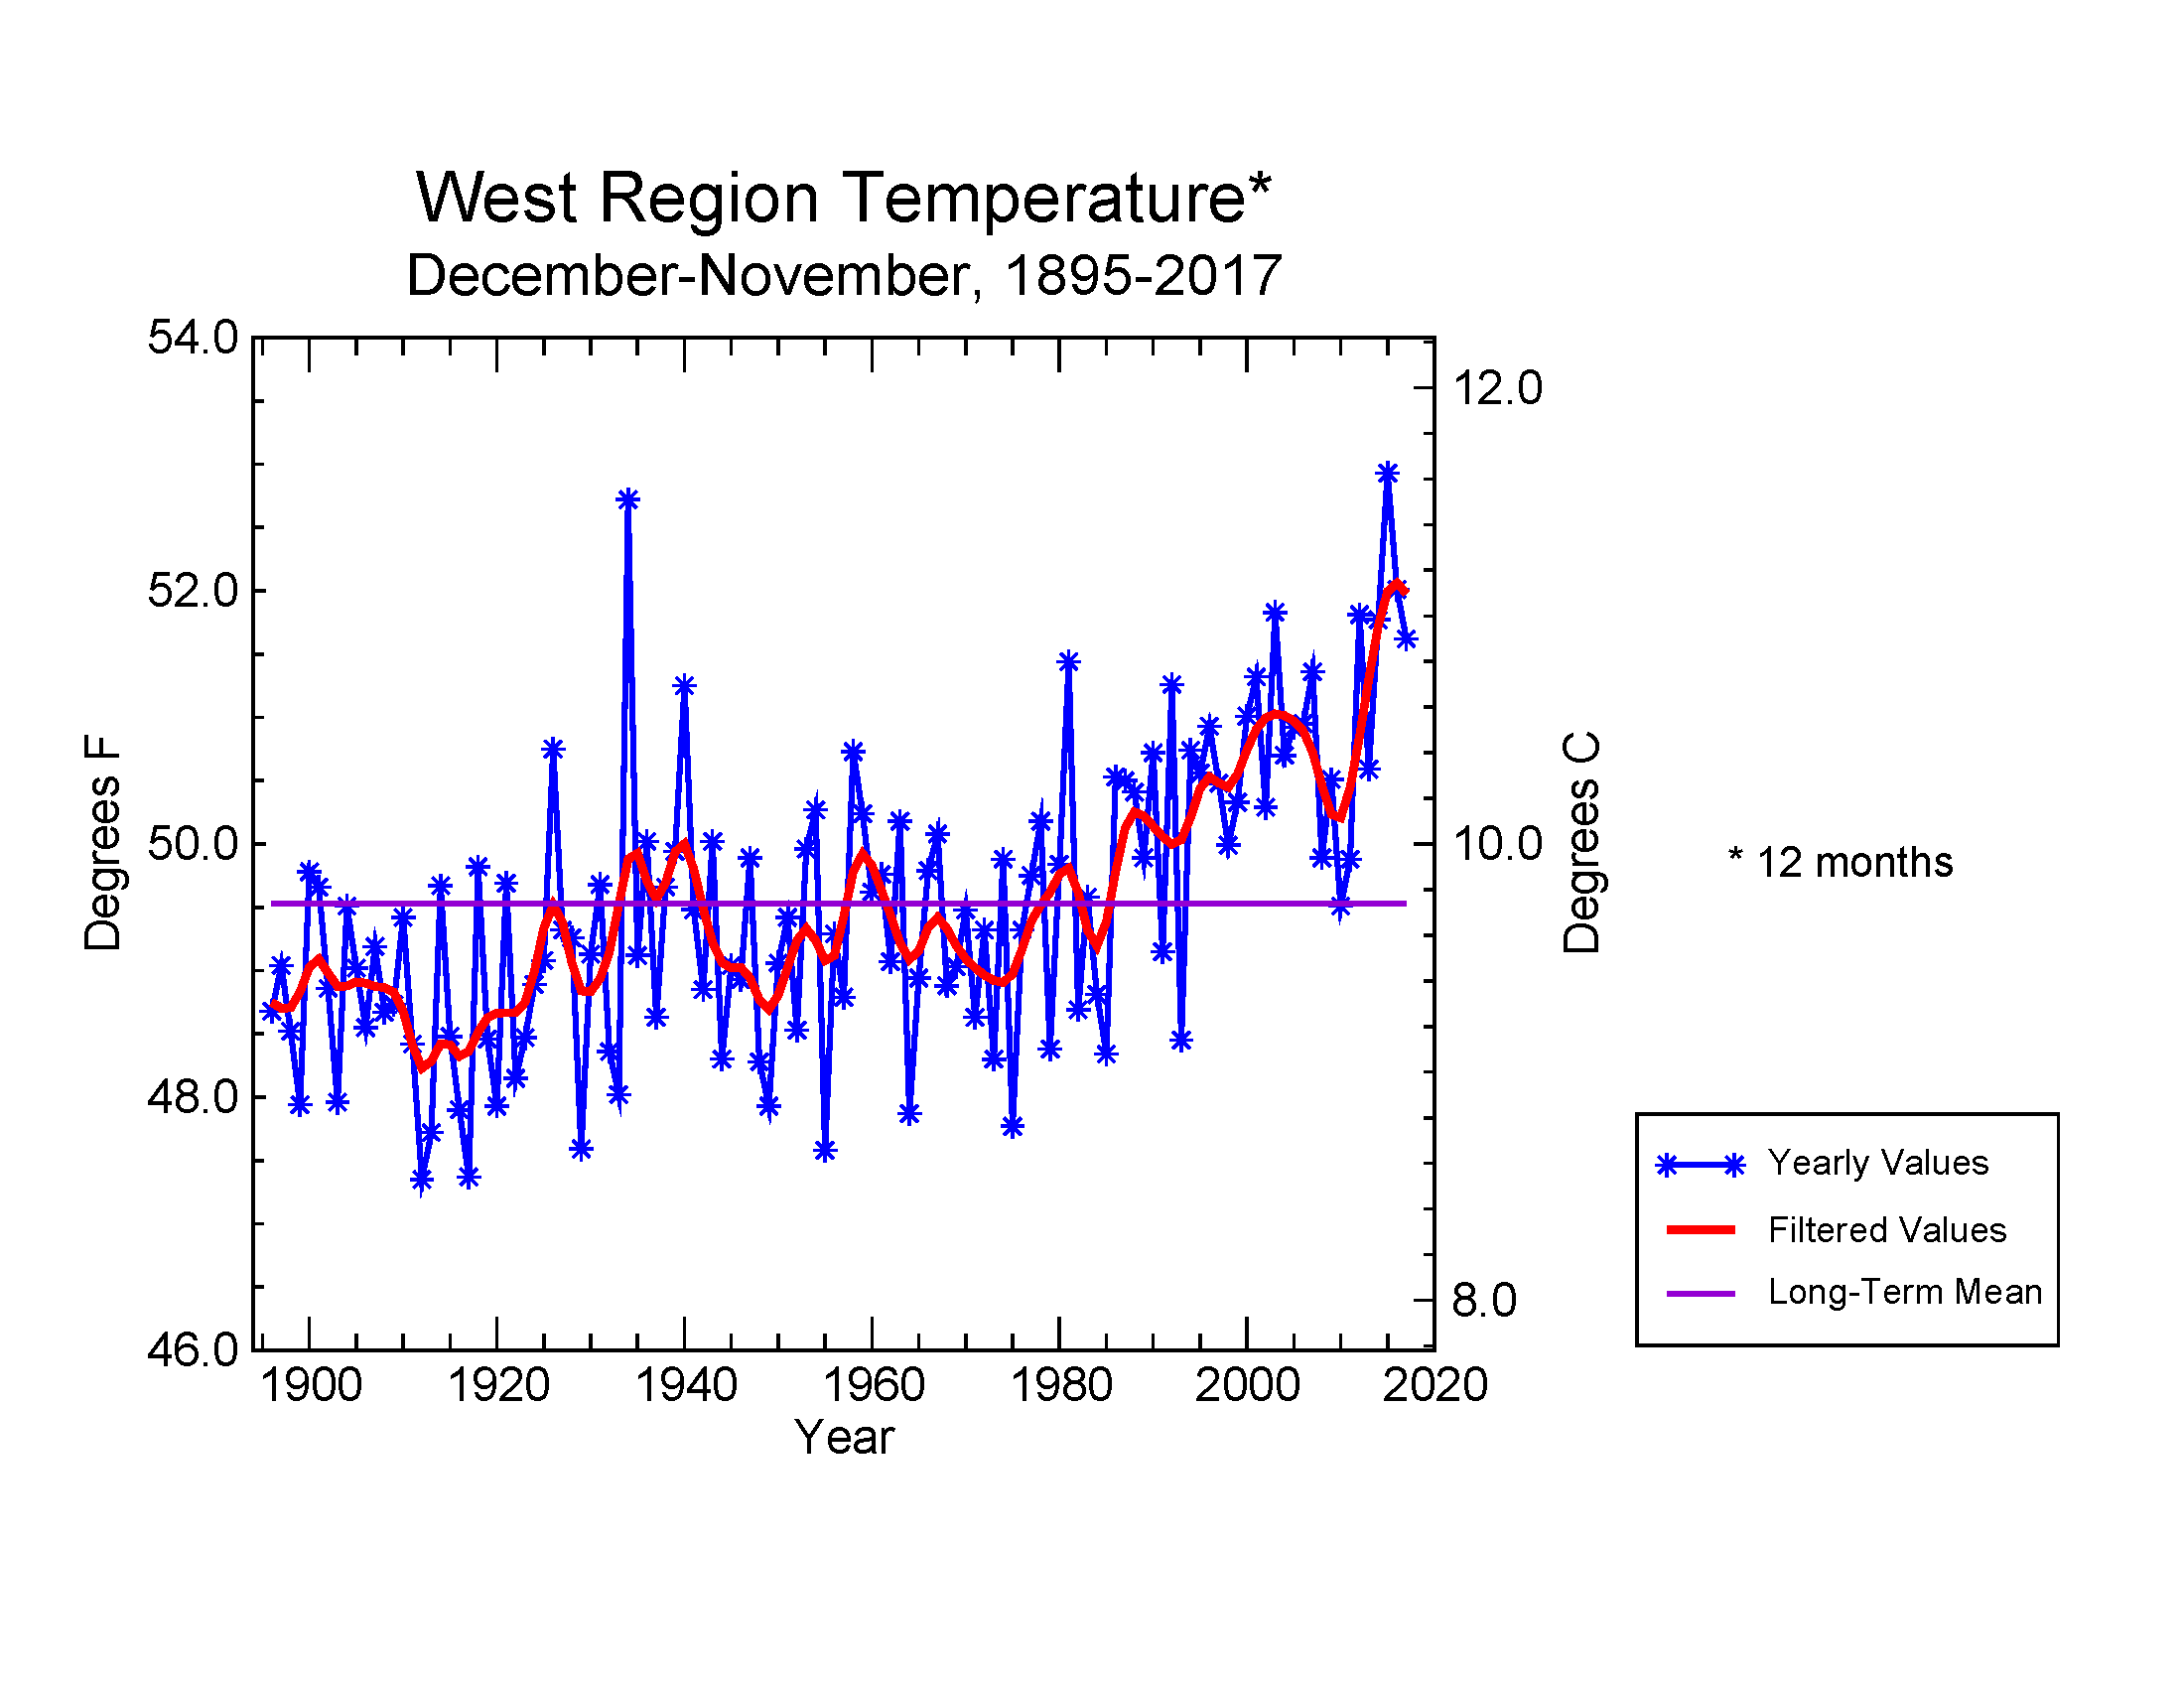
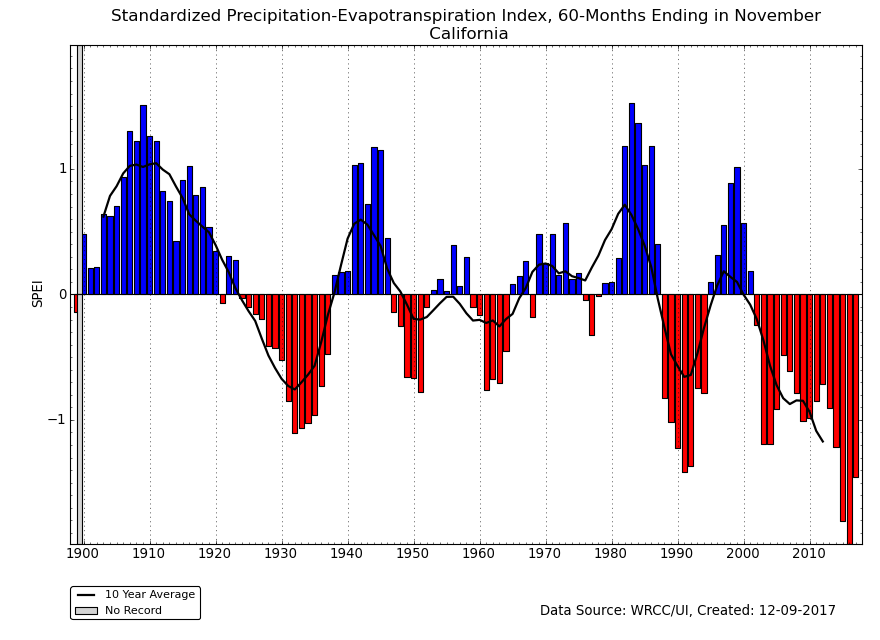
72-month SPEI, California, November, 1895-2017.
Much of the last 30 years has been unusually warm across the West. The increased evapotranspiration caused by the excessive warmth has resulted in a more extreme SPEI than SPI for all time scales from the last six months to six years (SPEI maps for last 6, 12, 24, 36, 48, 60, 72 months) (SPI maps for last 6, 12, 24, 36, 48, 60, 72 months). Much of the Southwest, especially California and Nevada, had been in a drought during the last six to seven years, and the excessive warmth had exacerbated the drought conditions. Even with the wet conditions of the last 12 months, California had the second most extreme SPEI for the last 72 months and third most extreme SPEI for the last 60 months, and Nevada had the second most extreme SPEI for the last 72 months. In comparison, California's 72-month SPI was 17th driest and 60-month SPI was 28th driest; Nevada's 72-month SPI was mid-range (near normal) at 66th driest.
Regional Discussion
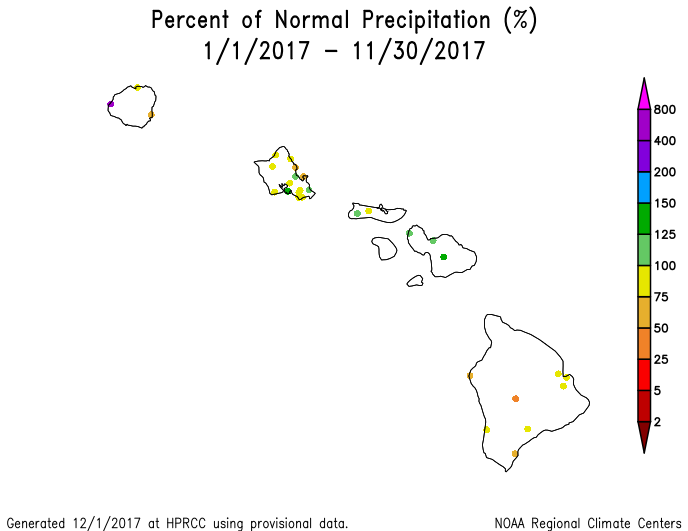
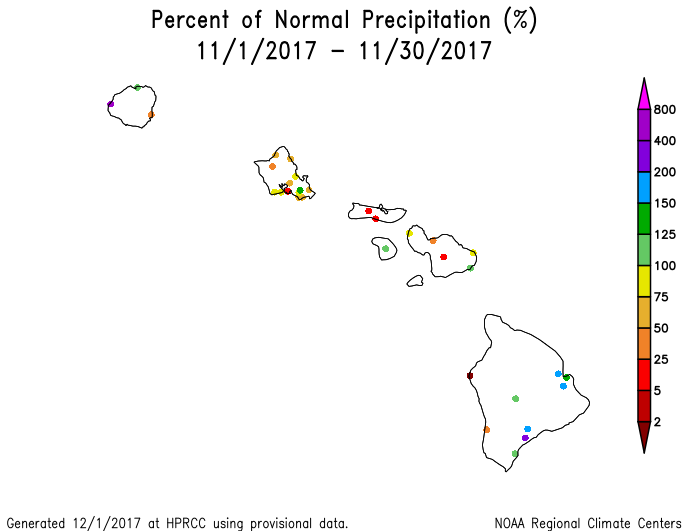
Map of percent of normal precipitation for Hawaii, January-November 2017.
Hawaii: November 2017 was wetter than normal across the Big Island but mostly drier than normal across the rest of the Hawaiian Islands. A similar precipitation anomaly pattern existed for the last 2, 3, to 5 months. The last 6 months had a mixed anomaly pattern. Molokai and Maui were wetter than normal at 8 months. Drier-than-normal conditions dominated the Big Island and Oahu at longer time scales (last 11, 12, 24, and 36 months). Streamflow was mostly near to above normal. Abnormal dryness and drought contracted, and extreme drought disappeared, but moderate to severe drought still covered about a fourth of the state on the November 28th, 2017 USDM map.

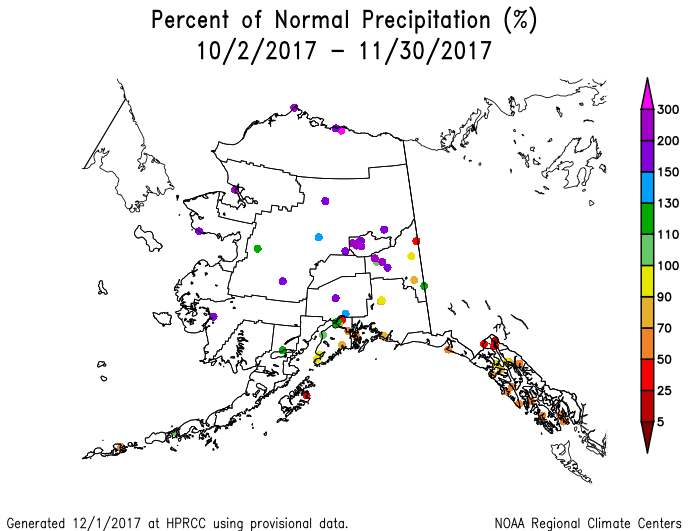
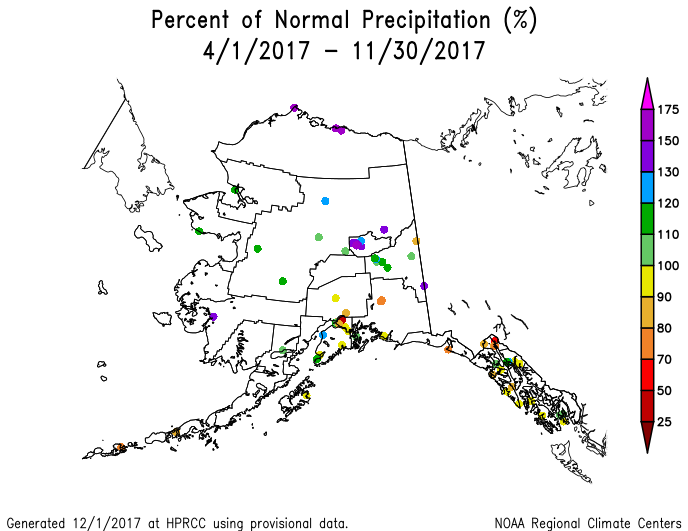
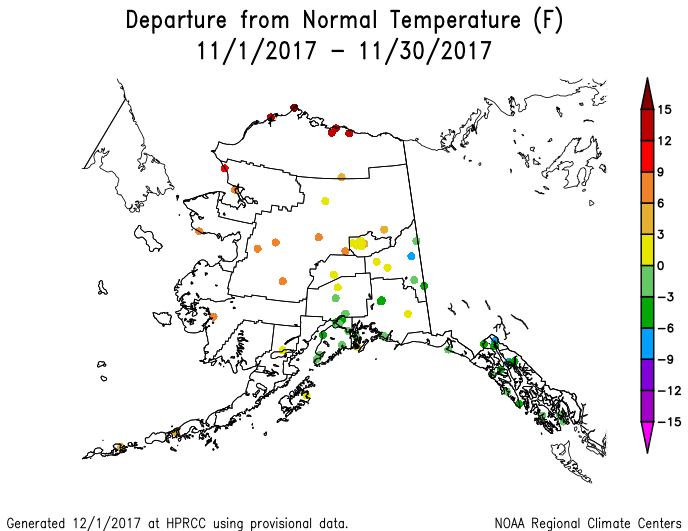
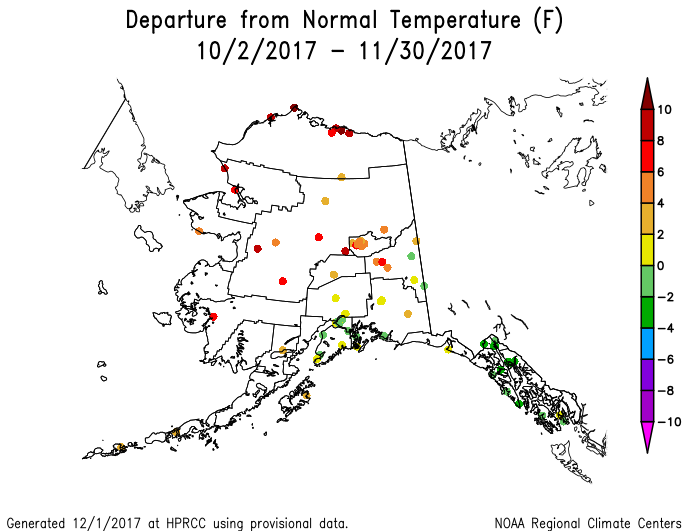
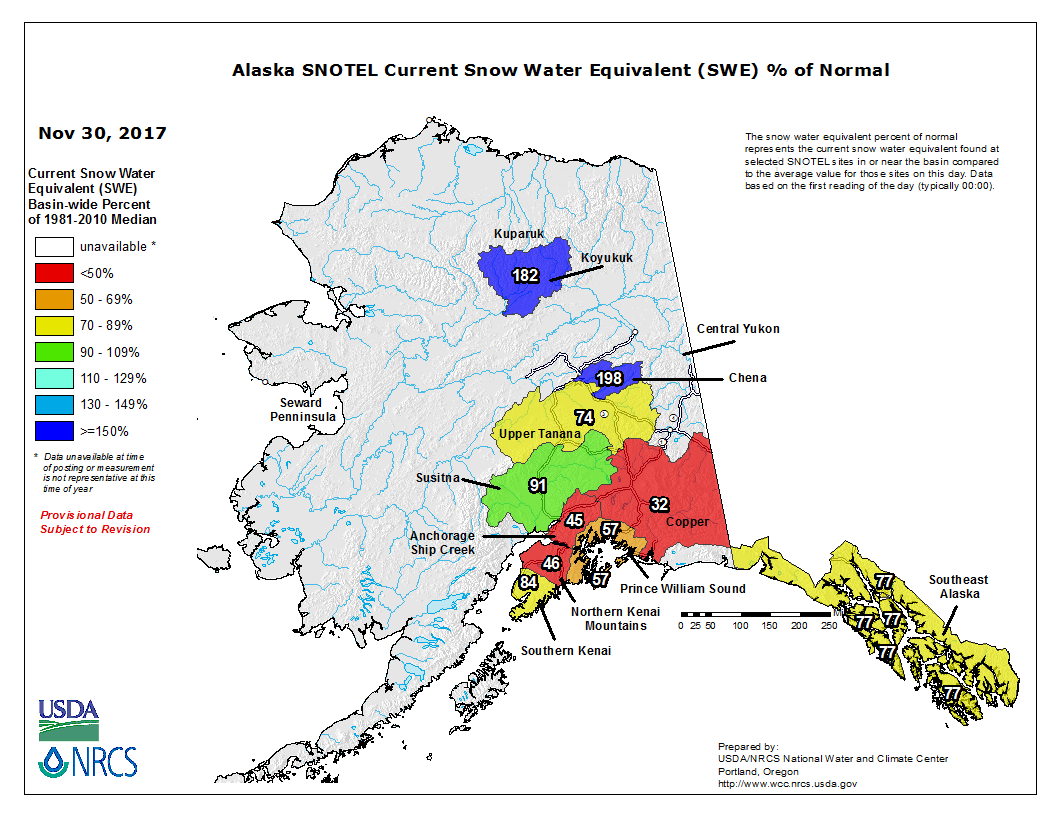
Alaska gridded precipitation rank map, November 2017.
Alaska: November 2017 was drier than normal across the panhandle, southern coastal, and interior regions of Alaska but wetter than normal across the western and northern regions (climate division, gridded percentile, gridded percent of normal, and low elevation station maps); the high elevation (SNOTEL) stations had a mixed precipitation anomaly pattern. The precipitation anomaly pattern was similar (at the low elevation analyses), except the above-normal anomalies were more widespread, for the last 2, 3 (climate division, gridded percentile, gridded percent of normal, and low elevation station maps), 5, 6 (climate division, gridded percent of normal, and low elevation station maps), 8, and 11 (climate division, gridded percentile, gridded percent of normal, and low elevation station maps) months. At the high elevation (SNOTEL) stations, the last two months (water year to date, October 1-November 30) were wetter than normal at the interior basins, but most of the rest of the stations were drier than normal. Near to drier-than-normal conditions dominated the southern to central regions for the last 12 months (climate division and low elevation station maps), while a mixed anomaly pattern was evident at the 24- to 36-month time scales. Temperatures were warmer than normal in the north, west, and interior regions and cooler than normal in the south for the last 1 (low elevation station, gridded percentile, divisional maps), 2, 11 (low elevation station, gridded percentile, divisional maps), and 12 (low elevation station and divisional maps) months. Warmer-than-normal temperatures dominated most of the state for the last 3 (low elevation station, gridded percentile, divisional maps) to 6 months. Except for some northern basins, mountain snow water content was mostly below normal, but this is early in the snow season. Streamflow was mostly above normal. Alaska remained free of drought and abnormal dryness on the November 28th USDM map.
Precipitation anomaly maps were not available for Puerto Rico this month. November was wetter than normal at San Juan. Streamflow was mostly above normal across the island. As seen on the November 28th, 2017 USDM map, Puerto Rico was free of drought and abnormal dryness.
CONUS State Precipitation Ranks:
|

|
November 2017 was drier than normal across much of the CONUS, but especially in the Southwest, Great Plains to Southeast, and Northeast. On a statewide basis, 35 states ranked in the driest third of the 123-year historical record with five states in the top ten driest category. These included Mississippi (third driest), Alabama (fourth driest), Arkansas (fourth driest), Oklahoma (fifth driest), and Louisiana (tenth driest).
|
|
September-November 2017 was drier than normal across much of the Southwest, the southern Plains to Mid-Mississippi Valley, and parts of the Mid-Atlantic to Northeast states. Record dryness occurred in parts of the Southwest and southern Plains to Mid-Mississippi Valley. On a statewide basis, eleven states ranked in the driest third of the historical record with three in the top ten category — Arkansas (driest September-November on record), Arizona (third driest), and Louisiana (fifth driest).
June-November 2017 was drier than normal across much of the Southwest, northern High Plains, and Mid-Mississippi Valley, and parts of the Mid-Atlantic to Northeast states, but the dryness was not as extreme. On a statewide basis, eleven states ranked in the driest third of the historical record with none in the top ten driest category.

|

|
The year to date was drier than normal across much of the northern High Plains, parts of the Southwest, and a few other areas. On a statewide basis, only three states (North Dakota, Arizona, and Montana) ranked in the driest third of the historical record, but North Dakota was in the top ten driest category with the eighth driest January-November.
December 2016-November 2017 had a similar precipitation anomaly pattern to the year to date. Northeast Montana had the driest December-November on record, but Montana's statewide rank was only 28th driest. North Dakota had the eleventh driest December-November. These were the only two states to rank in the driest third of the historical record.
 Primary Hard Red Winter Wheat Belt precipitation, November, 1895-2017.
|
 Primary Hard Red Winter Wheat Belt precipitation, October-November, 1895-2017.
|
November 2017 was drier and warmer than normal across the Primary Hard Red Winter Wheat agricultural belt. The month ranked as the eighth driest and twelfth warmest November, regionwide, in the 1895-2017 record.
October marks the beginning of the growing season for the Primary Hard Red Winter Wheat belt. October-November 2017 was drier than normal with some wetter-than-normal areas, and warmer than normal across most of the agricultural belt, ranking as the 57th driest and 14th warmest October-November, regionwide.
On a national scale, as of November 28th, 2017, 6 percent of corn production, 9 percent of soybean production, 25 percent of hay acreage, 19 percent of cattle inventory, 20 percent of winter wheat production, and 41 percent of spring wheat production were within an area experiencing drought. All of these values are more than they were a month ago. According to November 26th reports by the U.S. Department of Agriculture (USDA), only 12 percent of winter wheat was in poor to very poor condition. But 31 percent of the nation's topsoil moisture and 33 percent of subsoil moisture were short to very short of moisture. These soil moisture conditions were spread across the Plains, West, Lower to Mid-Mississippi Valley, and Southeast.
NOAA Regional Climate Centers:
A more detailed drought discussion, provided by the NOAA Regional Climate Centers and others, can be found below.
As described by the High Plains Regional Climate Center, warm and dry conditions occurred in November across a broad area of the High Plains region to round out the fall season. Although the month started on a cold note, average temperatures by the end of November were above normal throughout western and central portions of the region. Autumn was warm across most of the High Plains.
Widespread dryness accompanied the warmth and precipitation was abysmal, with the majority of the region only receiving 25 percent of normal precipitation, at best. Some parts of the region recorded less than 10 percent of normal precipitation. For instance, the majority of Kansas received less than 0.25 inches (6 mm) of precipitation the entire month. The driest locations included Grand Junction, Colorado, which had its 3rd driest November on record, as well as parts of Kansas, where it was the 8th driest November on record for Topeka, Dodge City, and Goodland. The primary exception to the widespread dryness was Wyoming, where above-normal precipitation occurred in the northern and western portions of the state. In fact, Sheridan had its 8th wettest November on record.
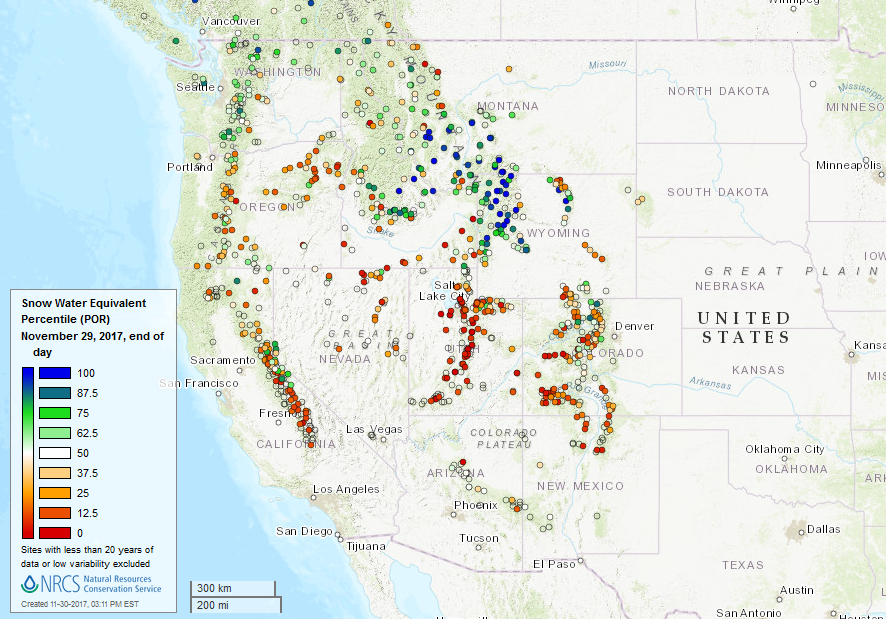
As a result of the warmth and dryness of November, a lack of snowfall was common across the region; this "snow drought" was most evident in Colorado. Only a trace of snow was recorded in Denver, and although it tied with many other years, it was the least snowiest November on record. In fact, it snowed more in Denver in October than it did in November! The lack of snow is concerning for recreational businesses such as ski resorts, and it has implications for spring runoff if this pattern continues. While it is still early in the snow season, the situation is worth watching. According to the U.S. Army Corps of Engineers, Missouri River Basin mountain snowpack above Fort Peck Reservoir and between Fort Peck and Garrison Reservoirs was above average as of the end of November. Snowpack in the Rockies of Wyoming was also above average. The good start to the snowpack season was largely due to early-season snowstorms that blanketed parts of the Upper Missouri Basin, and cooler temperatures in early November helped the snowpack stick around. However, as noted earlier, snowpack was not faring so well in Colorado, particularly in the southern and western portions of the state. November was very warm and dry, and Snow Water Equivalent was less than 25 percent of median in that area. Luckily, snowpack season is just beginning, so there is plenty of time to catch up.
Another impact of the warmth and dryness of November was a rapid decline in soil moisture conditions across the High Plains, as well as streamflows. The greatest soil moisture declines over the course of the month occurred in Nebraska and Kansas, where the percent of topsoil moisture rated short to very short increased from 14% to 32% in Nebraska and 18% to 39% in Kansas. Although the growing season is over, an adequate supply of soil moisture is needed going into winter to ensure enough moisture is available for spring planting. During the winter, the ground is often frozen and does not allow precipitation to enter the soil, so soil moisture cannot easily be recharged.
As for the fall season, precipitation varied across the region. Two primary areas that experienced wet conditions included western and central Wyoming, as well as a swath from western Kansas up through central Nebraska into southeastern South Dakota. North Platte, Nebraska had its 3rd wettest fall on record, while it was the 6th wettest for Huron, South Dakota. Meanwhile, dryness existed throughout a large part of the Dakotas, eastern Kansas, and western Colorado. Grand Junction, Colorado tied for its 9th driest fall on record.
The warmth and widespread dryness in November led to the expansion and intensification of drought conditions across portions of the High Plains. Region-wide, areas experiencing drought or abnormal dryness (D0-D4) increased from approximately 35 percent to 41 percent over the course of the month, according to the USDM. In the Northern Plains, where drought has been present since early summer, conditions improved in Montana but worsened in western North Dakota. Western and southern Montana had a wet month, with some areas receiving as much as 300 percent of normal precipitation. Meanwhile, precipitation was scarce across western North Dakota and, as a result, moderate drought (D1) was re-introduced to the area. Elsewhere in the Northern Plains, drought conditions largely remained the same. Moderate drought was introduced to two other areas in the High Plains in November: western Colorado and south-central Kansas. In western Colorado, the combination of record-breaking warmth and the continuation of below-normal precipitation for the past several months took its toll on soil and vegetative health. Mountain snowpack in this region was below normal in November as well. In Kansas, November precipitation was abysmal, with much of the state receiving less than 25% of normal. The lack of precipitation caused below-normal streamflows in the south-central portion of the state, prompting expansion of drought conditions across the area.
As we enter the winter season, it is worth noting that a La Niña has developed for the second year in a row in the Pacific Ocean. La Niña can influence winter climate in the High Plains. For instance, a colder winter is often favored in the Northern Plains, while warmer and drier conditions are more likely in the Southern Plains. However, this has not always been the case, and other climate patterns can have a greater influence on winter climate but are not as predictable.
As explained by the Southern Regional Climate Center, this month temperatures were warmer than normal and precipitation was drier than normal for most of the Southern region. All of Arkansas and Oklahoma, most of Louisiana and Mississippi, and parts of Tennessee and Texas received 50 percent or less of normal precipitation. There were a few areas of 5 percent or below normal precipitation in northern, western, and southern Texas, southeastern Louisiana, and northern and southeastern Oklahoma. In contrast, parts of central and southern Texas and northern and central Tennessee received 110-150 percent of normal precipitation.
During November 2017, drought conditions worsened from October to extreme drought (D3) in southwest Arkansas and severe drought (D2) in southeast Oklahoma, north Louisiana, northeast Texas, and north, central, and southern Arkansas. Moderate drought (D1) developed or expanded in north central and southeast Oklahoma, north and central Mississippi, north, central, and southwest Louisiana, and east, central, and southern Texas. Areas experiencing abnormally dry conditions (D0) are east Arkansas, north and south Mississippi, south Tennessee, south Louisiana, central and northwest Oklahoma, and in parts of Texas. From October to November, no areas with drought conditions improved.
As summarized by the Midwest Regional Climate Center, November temperatures were below normal in the upper Midwest and slightly above normal in parts of Missouri, while November precipitation totals ranged from less than 25 percent of normal in the western parts of the region to more than 200 percent of normal in a large area of Ohio. Precipitation totals ranged from less than 0.10 inch (3 mm) near the Iowa-Minnesota-South Dakota border to more than 6.00 inches (152 mm) in northern Ohio. Statewide values ranged from 20 percent of normal for Iowa to 154 percent of normal in Ohio. For the fall season (September to November), drier-than-normal conditions stretched from Missouri to Wisconsin while wetter-than-normal conditions in the surrounding areas. There was a lot of variation during the season with states having months ranking among both the driest and the wettest. Fall temperatures were slightly above normal for much of the region. September and October were warmer than normal and then cooler in November.
Drought in November was most prominent in Missouri though small areas of Iowa, Minnesota, and Illinois were also affected. The drought in Missouri did not expand in November but it did intensify. At the beginning of the month, the drought was all classified as moderate drought and by the end of the month, about half of the Missouri drought was classified as severe drought. Harvest of corn and soybeans neared an end in November. The corn harvest was behind the 5-year average in parts of the region. Some states were a week or two behind average during much of the fall.
As noted by the Southeast Regional Climate Center, precipitation was well below normal across much of the Southeast region during November, with monthly totals ranging from 50 to less than 5 percent of normal. At least 31 long-term stations, with two or more located in every state, observed November precipitation totals that were ranked within their five lowest values on record. Several long-term stations tied their highest count of November days with no measurable precipitation, including Fairhope 2 NE, AL (28 days), Gadsden, AL (1953-2017; 27 days), and New Bern, NC (27 days). In contrast, well-above-normal precipitation occurred across portions of northern and southeastern Florida as well as Puerto Rico, where monthly totals were 150 to more than 300 percent of normal.
Temperatures were near average to above average in Alabama, Georgia, Florida, and western North Carolina during November, while below-average temperatures were observed across central and eastern portions of the Carolinas and Virginia. San Juan, PR (1898-2017) and Miami, FL (1895-2017) tied their third warmest November mean temperature on record, at 81.8 and 77.3 degrees F (27.7 and 25.2 degrees C), respectively.
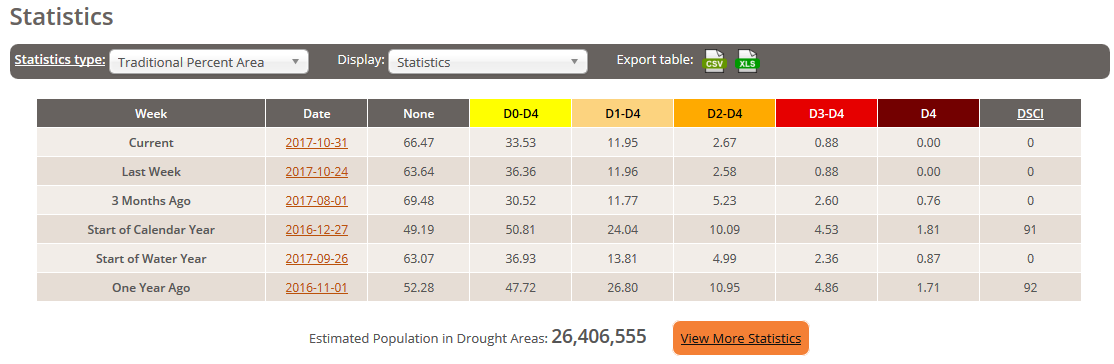
Abnormal dryness (D0) and moderate (D1) drought continued to expand in coverage across the Southeast during November. Indeed, the cumulative extent of abnormal dryness and moderate drought more than doubled within the region, increasing from 23 percent on October 31st to 58 percent on November 28th. Portions of every state were in moderate drought by late November, including south-central Virginia, central North and South Carolina, east-central and southern Georgia, west-central Alabama, and the eastern half of the Florida Panhandle. At least 20 percent of the USGS gages in Georgia, the Carolinas, and Virginia recorded well-below-normal (i.e., less than the 10th percentile) streamflows at the end of the month. Following periods of heavy rainfall during October, vegetable growers in southern Florida were able to resume preparing and planting their fields in early November, as warm and dry weather prevailed. A persistence of dry weather across much of the region during the month was beneficial for crop harvesting (particularly cotton, peanuts, soybeans, and hay) and the planting of winter grains. An exceptional yield of peanuts was reported in Alabama and Georgia, with some growers in Alabama having to ship out the harvested surplus after exceeding their local storage capacity. Mild temperatures in early November maintained the growth of warm season pastures in parts of the region, which allowed some livestock producers to continue grazing their cattle. However, below-average precipitation and insufficient soil moisture impeded the germination of winter grains across the region, prompting many ranchers to begin a supplemental feeding for their herds by the end of the month.
As explained by the Northeast Regional Climate Center, November was drier than normal in the Northeast, with 2.52 inches (64.01 mm) of precipitation, 66 percent of normal. State precipitation ranged from 36 percent of normal in Connecticut to 78 percent of normal in Pennsylvania. Five states ranked this November among their 20 driest. September and November were drier than normal, and October was wetter than normal, so autumn averaged out to be drier than normal. The region received 10.69 inches (271.53 mm) of precipitation, 92 percent of normal. Ten states were drier than normal. November was 1.4 degrees F (0.8 degrees C) colder than normal in the Northeast; with its ninth warmest September, second warmest October, and a colder-than-normal November, the Northeast averaged out to have its fifth warmest autumn since 1895.
The USDM released on November 2 showed 10 percent of the Northeast was abnormally dry. Dryness eased in western Pennsylvania and the northern Panhandle of West Virginia, where above-normal precipitation fell during the month. Conditions also eased in northeastern Massachusetts, southeastern New Hampshire, and parts of eastern Maine. However, abnormal dryness lingered or expanded where below-normal precipitation fell during November, including the eastern Panhandle of West Virginia, central and southern Maryland, south-central and northeastern Pennsylvania, southeastern New York, northern New Jersey, central Vermont, and parts of coastal Maine. The USDM released on November 30 showed 8 percent of the Northeast was abnormally dry.
As summarized by the Western Regional Climate Center, temperatures were above normal across much of the West this month, and record-breaking in the Southwest; several storm systems moved across the northern half of the region, producing near to well above normal precipitation, while the Southwest received little to no precipitation. The record November temperatures in the Southwest were caused by persistent high pressure, which also resulted in very little precipitation. San Diego, California, recorded only 0.02 in (less than 1 mm), 2% of normal and the 4th driest November since records began in 1939. In northern Arizona, Flagstaff recorded 0.01 in (less than 1 mm), less than 1% of normal and the 6th driest in a 125-year record. Albuquerque, New Mexico, reported no measurable precipitation, tied with 22 other years in its 127-year record. The lack of precipitation combined with above normal temperatures resulted in expansion of drought conditions in the Four Corners states; 73% of Arizona and 52% of Utah, as well as portions of western Colorado and western New Mexico, are now reporting moderate or worse drought on the USDM map.
The northern half of the West observed near to well above normal precipitation this month. On the western slope of the Sierra Nevada, Blue Canyon reported 18.69 in (475 mm), 223% of normal and the 6th wettest November since records began in 1940. An atmospheric river storm on the 16th and 17th had conditions favorable for spillover across the Sierra into western Nevada. Around the Inland Northwest, Stanley, Idaho, had its 4th wettest November since records began in 1916, logging 4.0 in (102 mm), 238% of normal. Bozeman, Montana reported 1.66 in (42 mm), 218% of normal and the 5th wettest since records began in 1941. Bozeman also reported 15.2 in (39 cm) snowfall, its 3rd largest November snowfall on record. This month's precipitation helped to erase any abnormally dry or drought conditions in the Pacific Northwest, and eased drought impacts in western and central Montana.
The northern Cascades and northern Rockies ended the month with near to above normal snowpack. The southern Cascades, Sierra Nevada, Great Basin ranges, and central and southern Rockies did not fare as well. For the Sierra and southern Cascades, snow levels generally remained high during storm events and limited snowpack accumulation at lower elevations (less than 7500 ft or 2300 m). While it is still early in the season, this raises concerns of the beginning of a "snow drought", the case when precipitation is near or above normal but snowpack is below normal.
In Alaska, western and northern portions of the state experienced mild conditions while the Panhandle and southeast mainland were somewhat cooler and drier than average. Combined end-of-November sea ice extent for the Chukchi and Bering Seas was the lowest on record (since 1978), contributing to the mild temperatures in the north. Utqiagvik (Barrow) experienced its warmest November in a 98-year record at 17.2 F (-8.2 C), 16.5 F (9.2 C) above normal. In the southeast, Yakutat received 2.14 in (54 mm) of precipitation for November, 15% of normal and the 2nd driest in a 101-year record. To the south, precipitation was below to near normal across Hawaii, with some areas of the windward side of the Big Island experiencing above normal precipitation. Hilo recorded 20.53 in (521 mm) of rainfall, 132% of normal. The precipitation that occurred during October and November was sufficient to reduce drought impacts across the state. At the end of this month, only 26% of the state was experiencing drought conditions, compared with 47% at the end of October.
Pacific Islands: The NOAA National Weather Service (NWS) offices, the Pacific ENSO Applications Climate Center (PEAC), and partners provided reports on conditions across the Pacific Islands.
In the U.S. Affiliated Pacific Islands (USAPI) (maps — Federated States of Micronesia [FSM], Northern Mariana Islands, Marshall Islands [RMI], Republic of Palau, American Samoa, basinwide), November 2017 was drier than normal at Saipan, Guam, Koror, Kapingamarangi, Pohnpei, Kwajalein, and Majuro, and wetter than normal at Yap, Chuuk, Lukonor, Kosrae, and Pago Pago.
Rainfall amounts were below the minimum thresholds (4 or 8 inches) required to meet most monthly water needs at Fananu, Kapingamarangi, and Ulithi (in the FSM); and Rota and Saipan (in the Marianas). November rainfall was above the monthly minimum thresholds at the rest of the regular reporting stations in Micronesia. The 4- and 8-inch thresholds are important because, if monthly precipitation falls below the threshold, then water shortages or drought become a concern.
Significant dryness developed in the northern Marshall Islands in December 2016, with 6 of the last 12 months each having less than 2 inches at Utirik (9 had less than 8 inches), and 5 of the last 12 months having less than 2 inches each at Wotje (9 had less than 8 inches). Eight inches is the monthly minimum in the RMI. November 2017 was the first 8-plus-inch month since November 2016 at Utirik with 9.29 inches of rain. Wotje had 9.09 inches this month. November 2017 ranked as the sixth wettest November in 16 years of data for Utirik, but long-term dryness is still evident with July-November 2017 ranking as the driest such 5-month period out of 8 years of data. Jaluit still had the second driest March-November out of 34 years of data and Ailinglapalap the second driest May-November out of 33 years of data.
As measured by percent of normal precipitation, Saipan has been drier than normal in the short term (November and the last 3 months [September-November]) as well as the long term (year to date [January-November] and last 12 months [December 2016-November 2017]). Kapingamarangi was drier than normal in the short term and near to drier than normal in the long term. Pohnpei was drier than normal in the short term but near to wetter than normal in the long term. Lukonor was drier than normal in the long term but near to wetter than normal in the short term. Guam was drier than normal for November but near to wetter than normal for the other three time periods. Koror, Kwajalein, and Majuro were drier than normal for November but wetter than normal for the other three time periods. Chuuk was drier than normal for the year to date but near to wetter than normal for the other three time periods. Kosrae, Pago Pago, and Yap were wetter than normal for all four time periods.
| Station Name | Dec 2016 | Jan 2017 | Feb 2017 | Mar 2017 | Apr 2017 | May 2017 | Jun 2017 | Jul 2017 | Aug 2017 | Sep 2017 | Oct 2017 | Nov 2017 | Dec- Nov |
|---|---|---|---|---|---|---|---|---|---|---|---|---|---|
| Chuuk | 176% | 113% | 114% | 189% | 60% | 83% | 73% | 99% | 91% | 110% | 127% | 105% | 104% |
| Guam NAS | 170% | 155% | 167% | 256% | 340% | 56% | 136% | 97% | 66% | 118% | 161% | 57% | 102% |
| Kapingamarangi | 114% | 159% | 207% | 126% | 159% | 114% | 81% | 102% | 41% | 92% | 72% | 64% | 99% |
| Koror | 64% | 131% | 175% | 245% | 76% | 107% | 89% | 130% | 104% | 161% | 118% | 84% | 110% |
| Kosrae | 168% | 103% | 213% | 150% | 112% | 115% | 80% | 104% | 93% | 155% | 143% | 168% | 111% |
| Kwajalein | 156% | 285% | 212% | 46% | 65% | 77% | 156% | 70% | 64% | 205% | 88% | 83% | 111% |
| Lukonor | 128% | 138% | 66% | 160% | 85% | 80% | 60% | 103% | 63% | 84% | 116% | 136% | 87% |
| Majuro | 103% | 228% | 138% | 199% | 110% | 49% | 118% | 112% | 111% | 187% | 143% | 76% | 124% |
| Pago Pago | 111% | 72% | 153% | 52% | 87% | 240% | 93% | 84% | 145% | 96% | 217% | 127% | 108% |
| Pohnpei | 142% | 182% | 71% | 115% | 96% | 92% | 141% | 113% | 55% | 122% | 81% | 95% | 106% |
| Saipan | 95% | 182% | 199% | 108% | 115% | 66% | 128% | 72% | 65% | 84% | 66% | 62% | 84% |
| Yap | 101% | 198% | 370% | 205% | 110% | 69% | 68% | 121% | 55% | 93% | 156% | 106% | 114% |
| Station Name | Dec 2016 | Jan 2017 | Feb 2017 | Mar 2017 | Apr 2017 | May 2017 | Jun 2017 | Jul 2017 | Aug 2017 | Sep 2017 | Oct 2017 | Nov 2017 | Dec- Nov |
|---|---|---|---|---|---|---|---|---|---|---|---|---|---|
| Chuuk | 19.83" | 11.37" | 8.27" | 15.74" | 7.51" | 9.40" | 8.50" | 11.86" | 11.65" | 12.92" | 14.64" | 11.15" | 142.84" |
| Guam NAS | 8.68" | 6.22" | 5.06" | 5.30" | 8.60" | 1.89" | 8.40" | 9.86" | 9.73" | 14.92" | 18.47" | 4.23" | 101.36" |
| Kapingamarangi | 11.22" | 14.54" | 19.18" | 14.44" | 21.70" | 13.75" | 11.15" | 14.47" | 3.35" | 9.13" | 5.93" | 5.95" | 144.81" |
| Koror | 7.13" | 13.30" | 14.99" | 18.26" | 5.54" | 12.61" | 15.53" | 24.14" | 13.98" | 18.90" | 14.03" | 9.55" | 167.96" |
| Kosrae | 26.99" | 17.21" | 27.51" | 24.16" | 19.62" | 20.34" | 11.73" | 15.57" | 13.23" | 22.02" | 15.65" | 23.21" | 237.24" |
| Kwajalein | 10.36" | 9.00" | 5.60" | 1.07" | 3.44" | 5.20" | 10.80" | 6.91" | 6.28" | 22.06" | 9.83" | 9.40" | 99.95" |
| Lukonor | 14.42" | 11.58" | 5.90" | 14.83" | 9.61" | 9.41" | 6.97" | 16.47" | 8.88" | 8.51" | 13.10" | 12.38" | 132.06" |
| Majuro | 11.77" | 17.65" | 9.50" | 13.07" | 10.36" | 4.93" | 13.03" | 12.52" | 13.00" | 20.93" | 18.21" | 10.27" | 155.24" |
| Pago Pago | 14.24" | 9.57" | 18.32" | 5.60" | 8.14" | 23.23" | 4.94" | 4.66" | 7.78" | 6.26" | 20.11" | 12.89" | 135.74" |
| Pohnpei | 22.83" | 24.00" | 6.76" | 15.16" | 17.68" | 18.45" | 20.85" | 17.45" | 7.82" | 15.27" | 12.31" | 14.13" | 192.71" |
| Saipan | 3.67" | 4.61" | 5.15" | 2.04" | 3.02" | 1.58" | 4.63" | 6.45" | 8.59" | 8.47" | 7.01" | 3.48" | 58.7" |
| Yap | 8.59" | 12.67" | 19.19" | 9.35" | 6.19" | 5.40" | 8.16" | 18.27" | 8.20" | 12.59" | 18.99" | 9.40" | 137" |
| Station Name | Dec 2016 | Jan 2017 | Feb 2017 | Mar 2017 | Apr 2017 | May 2017 | Jun 2017 | Jul 2017 | Aug 2017 | Sep 2017 | Oct 2017 | Nov 2017 | Dec- Nov |
|---|---|---|---|---|---|---|---|---|---|---|---|---|---|
| Chuuk | 11.25" | 10.10" | 7.25" | 8.32" | 12.47" | 11.30" | 11.66" | 11.98" | 12.86" | 11.71" | 11.51" | 10.61" | 136.77" |
| Guam NAS | 5.11" | 4.01" | 3.03" | 2.07" | 2.53" | 3.40" | 6.18" | 10.14" | 14.74" | 12.66" | 11.44" | 7.38" | 99.09" |
| Kapingamarangi | 9.84" | 9.15" | 9.27" | 11.43" | 13.64" | 12.08" | 13.78" | 14.15" | 8.13" | 9.93" | 8.19" | 9.27" | 145.85" |
| Koror | 11.16" | 10.18" | 8.56" | 7.44" | 7.32" | 11.83" | 17.48" | 18.53" | 13.50" | 11.77" | 11.84" | 11.39" | 152.90" |
| Kosrae | 16.11" | 16.67" | 12.93" | 16.06" | 17.51" | 17.75" | 14.64" | 14.91" | 14.22" | 14.22" | 10.94" | 13.83" | 213.87" |
| Kwajalein | 6.66" | 3.16" | 2.64" | 2.35" | 5.26" | 6.72" | 6.93" | 9.87" | 9.74" | 10.74" | 11.18" | 11.28" | 90.41" |
| Lukonor | 11.27" | 8.41" | 8.93" | 9.26" | 11.31" | 11.69" | 11.65" | 15.93" | 14.04" | 10.15" | 11.32" | 9.08" | 151.36" |
| Majuro | 11.39" | 7.74" | 6.88" | 6.58" | 9.42" | 10.11" | 11.01" | 11.17" | 11.69" | 11.17" | 12.73" | 13.44" | 125.25" |
| Pago Pago | 12.84" | 13.34" | 12.00" | 10.68" | 9.39" | 9.66" | 5.33" | 5.55" | 5.38" | 6.53" | 9.26" | 10.14" | 125.57" |
| Pohnpei | 16.08" | 13.18" | 9.55" | 13.17" | 18.41" | 19.96" | 14.81" | 15.43" | 14.26" | 12.55" | 15.27" | 14.83" | 182.36" |
| Saipan | 3.85" | 2.53" | 2.59" | 1.89" | 2.63" | 2.38" | 3.62" | 8.91" | 13.13" | 10.09" | 10.62" | 5.61" | 70.25" |
| Yap | 8.51" | 6.39" | 5.19" | 4.56" | 5.63" | 7.85" | 12.04" | 15.08" | 14.82" | 13.50" | 12.18" | 8.83" | 120.31" |
The following analysis of historical data for the USAPI stations in the Global Historical Climatology Network-Daily (GHCN-D) dataset, augmented with fill-in data from the 1981-2010 Normals, helps put the current data into historical perspective by computing ranks based on the period of record. The table below lists the precipitation ranks for November 2017, June-November 2017 (last 6 months), and December 2016-November 2017 (the last 12 months). Some stations have a long period of record and their dataset is fairly complete, while other stations have a shorter period of record and the dataset has some missing data.
Rank of 1 = driest.
| Station | Nov 2017 Rank |
Nov No. of Years |
Jun- Nov 2017 Rank |
Jun- Nov No. of Years |
Dec 2016- Nov 2017 Rank |
Dec- Nov No. of Years |
Period of Record |
| Jaluit | 19 | 34 | 2 | 34 | 10 | 32 | 1981-2017 |
| Koror | 28 | 67 | 54 | 66 | 60 | 66 | 1951-2017 |
| Woleai | 21 | 33 | 8 | 25 | 9 | 22 | 1968-2017 |
| Yap | 35 | 67 | 33 | 66 | 49 | 66 | 1951-2017 |
| Majuro | 16 | 64 | 56 | 64 | 54 | 63 | 1954-2017 |
| Mili | 26 | 34 | MSG | 33 | MSG | 31 | 1981-2017 |
| Ulithi | 7 | 36 | 5 | 35 | MSG | 32 | 1981-2017 |
| Ailinglapalap | 12 | 34 | 6 | 33 | 18 | 31 | 1981-2017 |
| Kosrae | 47 | 50 | 28 | 37 | 23 | 30 | 1954-2017 |
| Lukonor | 26 | 34 | 7 | 21 | 9 | 21 | 1981-2017 |
| Saipan | 8 | 37 | 3 | 37 | 5 | 28 | 1981-2017 |
| Pohnpei | 25 | 67 | 18 | 66 | 40 | 66 | 1951-2017 |
| Kwajalein | 26 | 66 | 38 | 66 | 37 | 65 | 1952-2017 |
| Kapingamarangi | 10 | 29 | 5 | 16 | 8 | 15 | 1962-2017 |
| Chuuk | 32 | 67 | 24 | 66 | 36 | 66 | 1951-2017 |
| Guam | 3 | 61 | 18 | 61 | 32 | 60 | 1957-2017 |
| Nukuoro | 34 | 34 | 32 | 33 | 32 | 32 | 1981-2017 |
| Pago Pago | 33 | 52 | 38 | 52 | 38 | 51 | 1966-2017 |
| Wotje | 22 | 33 | 26 | 33 | 16 | 30 | 1981-2017 |
| Utirik | 11 | 16 | 1 | 6 | MSG | 2 | 1985-2017 |


[top]
State/Regional/National Moisture Status
A detailed review of drought and moisture conditions is available for all contiguous U.S. states, the nine standard regions, and the nation (contiguous U.S.):
| northeast u. s. | east north central u. s. | central u. s. |
| southeast u. s. | west north central u. s. | south u. s. |
| southwest u. s. | northwest u. s. | west u. s. |
| Contiguous United States |
[top]
Contacts & Questions