|
Contents Of This Report: |


|
Please note that the values presented in this report are based on preliminary data. They will change when the final data are processed, but will not be replaced on these pages.
National Drought Overview
|
|
[top]
Detailed Drought Discussion
Overview

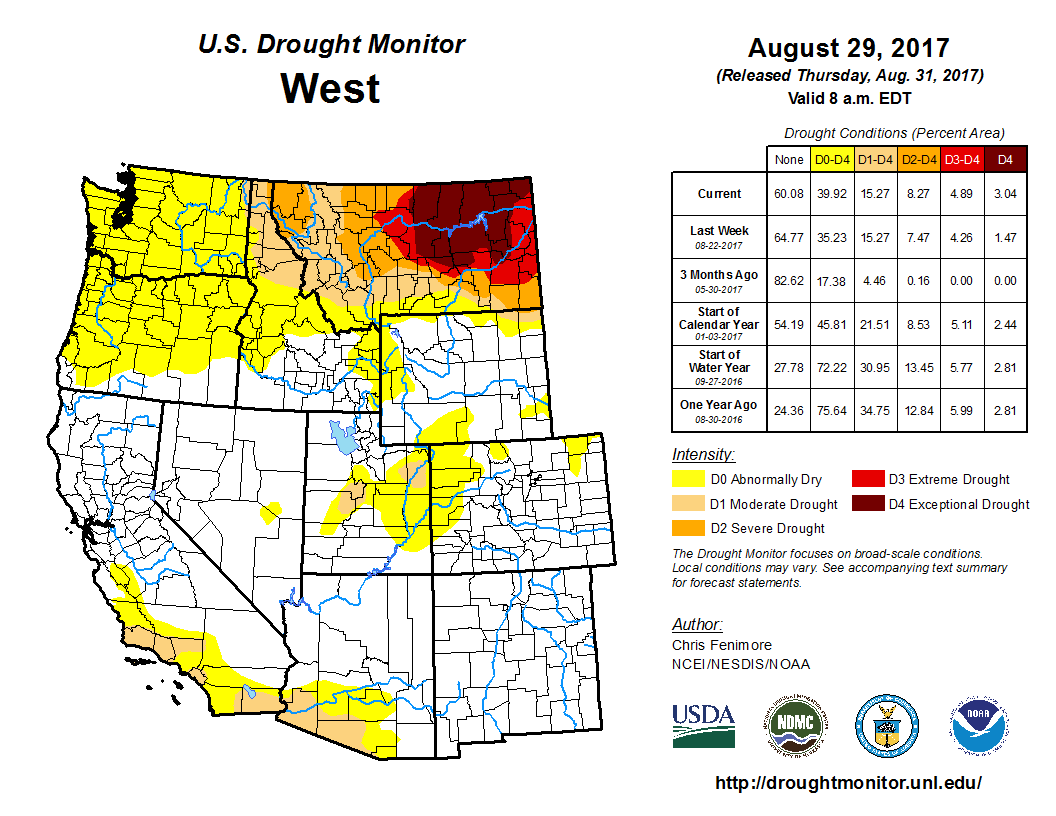
The U.S. Drought Monitor drought map valid August 29, 2017.
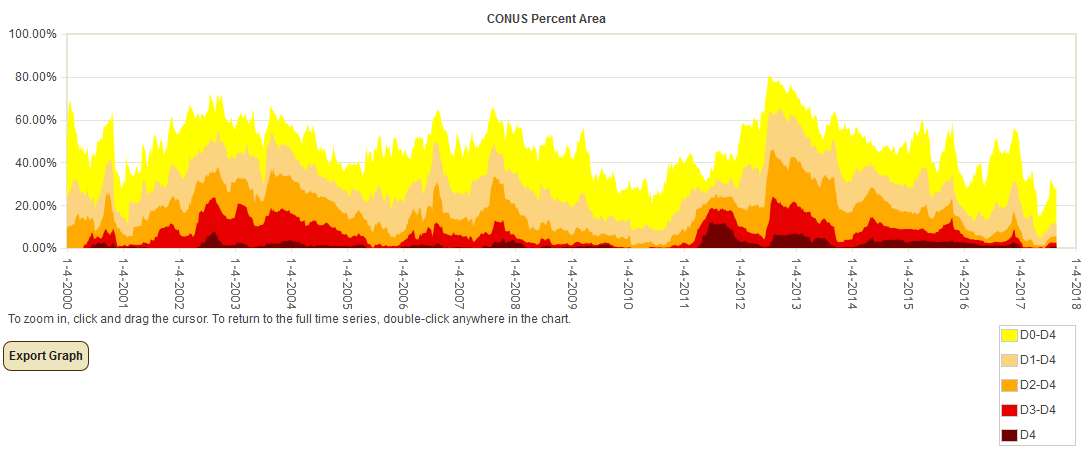
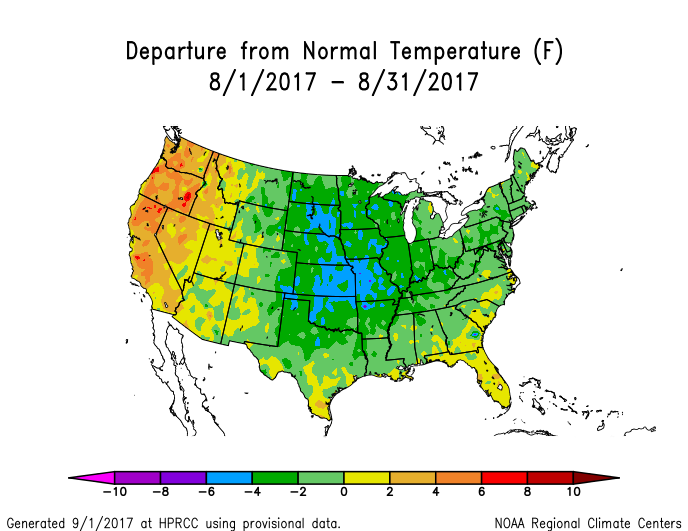
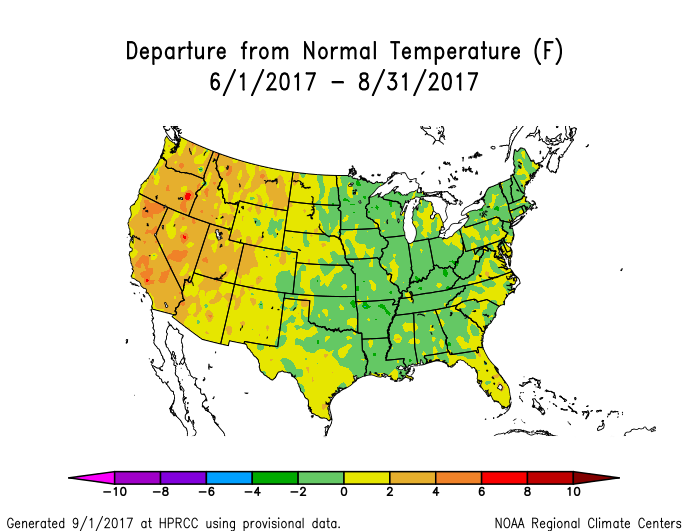
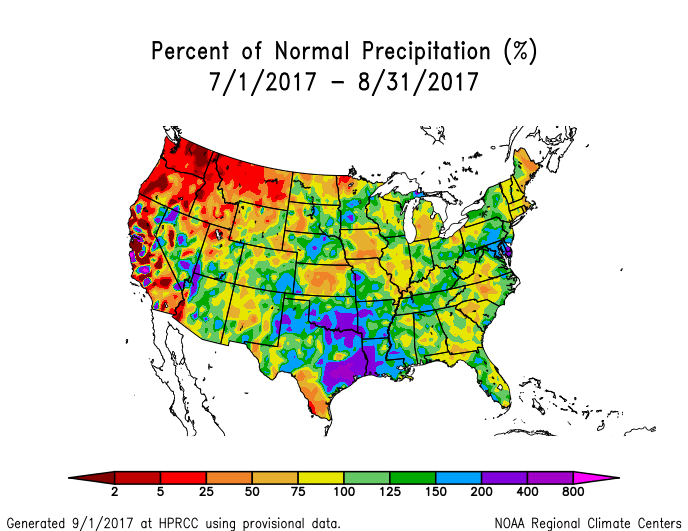
During August 2017, several troughs moved across the CONUS in the upper-level circulation, with the overall monthly pattern consisting of an enhanced ridge across the West and an enhanced trough across the East. The ridge resulted in warmer- and drier-than-normal weather across the West, especially in the Pacific Northwest and northern Rockies. Fronts and surface lows moving in the eastern trough brought cooler-than-normal weather to much of the country east of the Rockies. Some of the fronts and lows triggered showers and thunderstorms which gave parts of the Plains, South, and Upper Great Lakes above-normal precipitation. Record rains from Hurricane Harvey inundated parts of Texas and the Lower Mississippi Valley. Areas of drought and abnormal dryness contracted in the Plains and parts of the Southwest and Mid-Atlantic states, but expanded across the Pacific Northwest to Montana High Plains and in parts of the central Plains, Midwest, New England, and Southeast. Above-normal precipitation in Alaska contracted drought and abnormal dryness. There was both expansion and contraction of drought and abnormal dryness in Hawaii and Puerto Rico. The expansion and contraction of drought balanced each other out, with the USDM-based national moderate-to-exceptional drought footprint across the CONUS changing little from the end of July, staying at about 11.8 percent at the end of August (it dropped from 11.0 percent to 10.0 percent for all of the U.S.). According to the Palmer Drought Index, which goes back to the beginning of the 20th century, about 9.8 percent of the CONUS was in moderate to extreme drought at the end of August, an increase from last month's 7.8 percent.
Drought conditions at the end of the month, as depicted on the August 29th, 2017 USDM map, included the following core drought and abnormally dry areas:
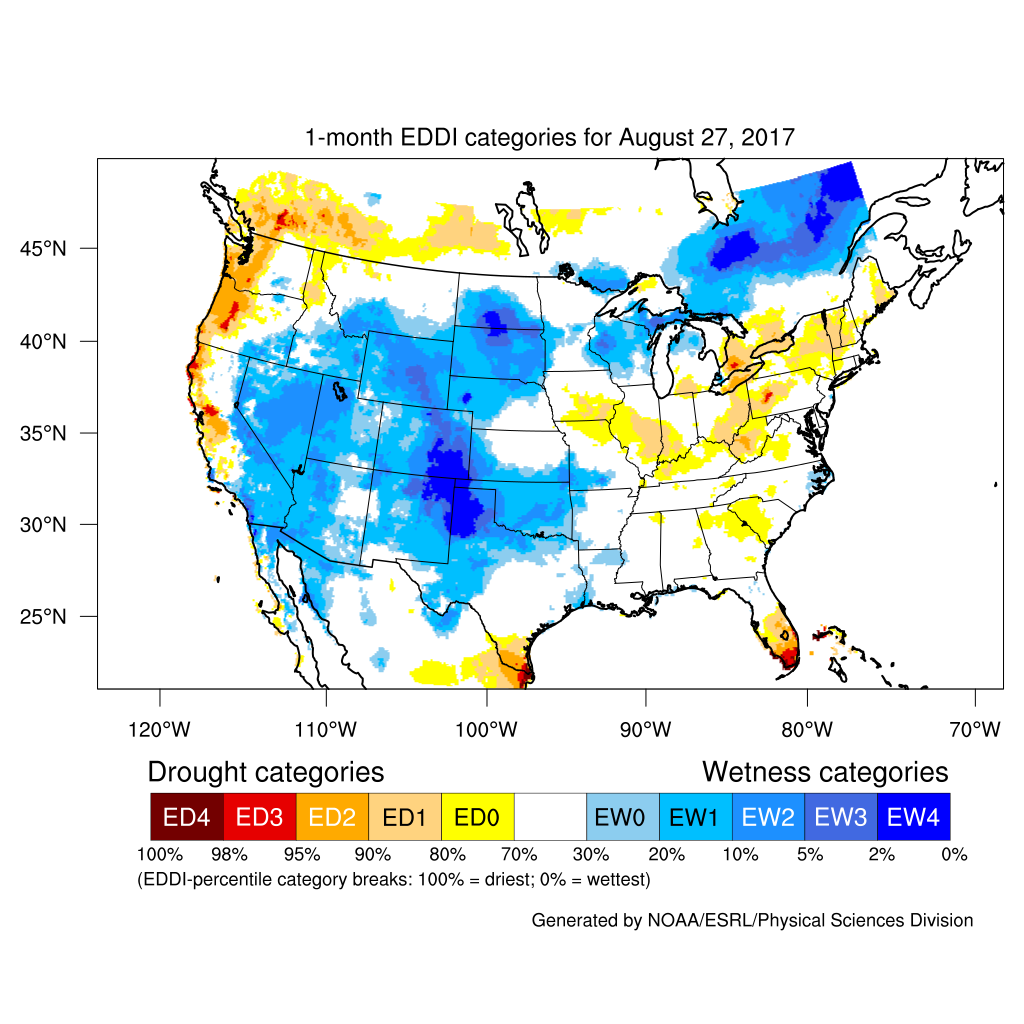
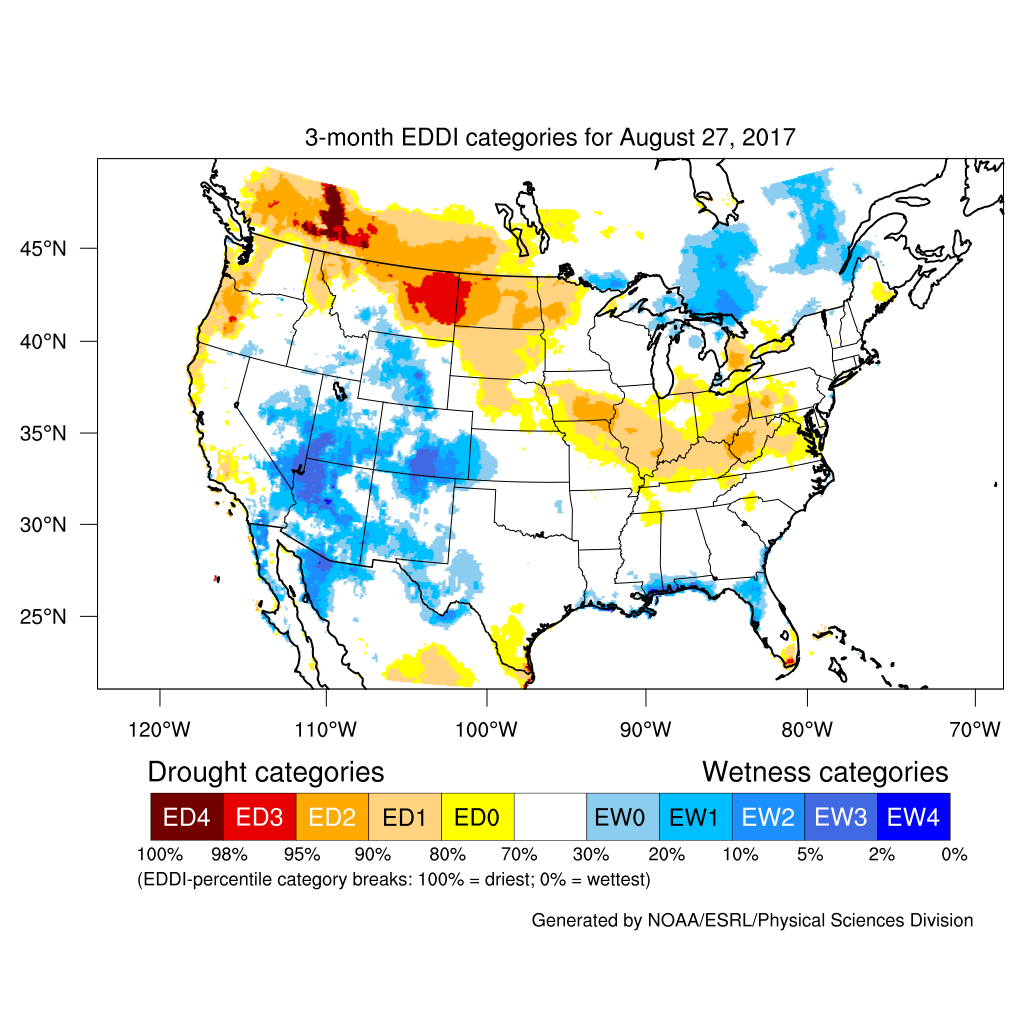
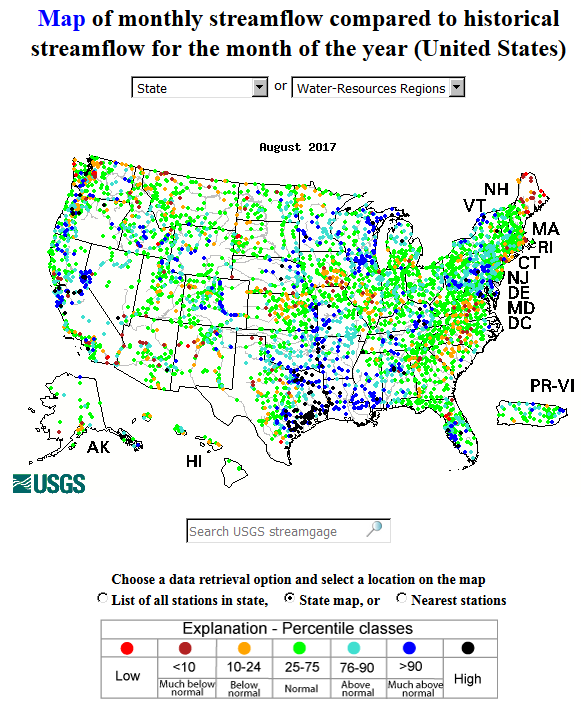
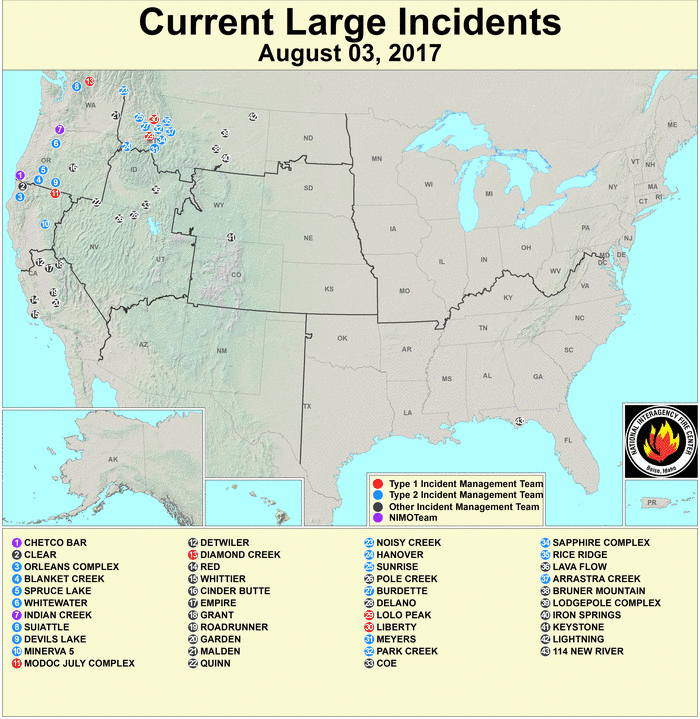
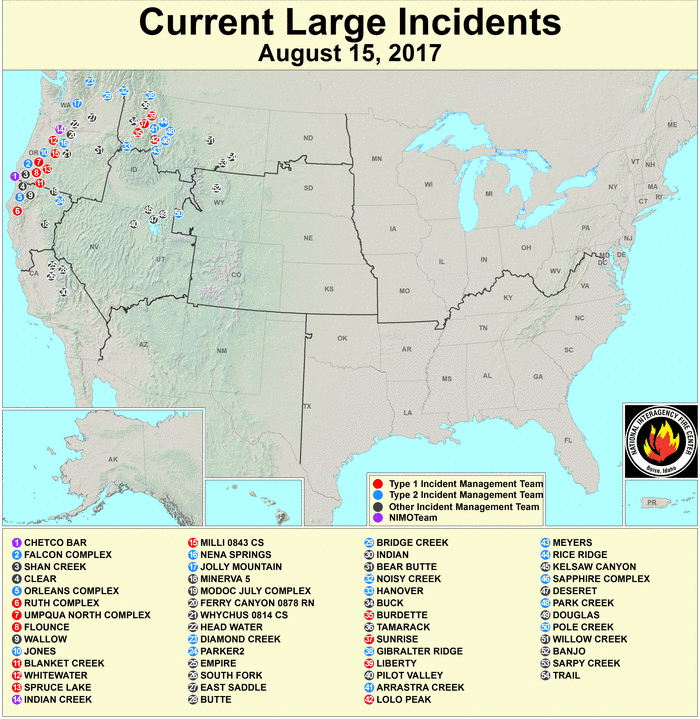
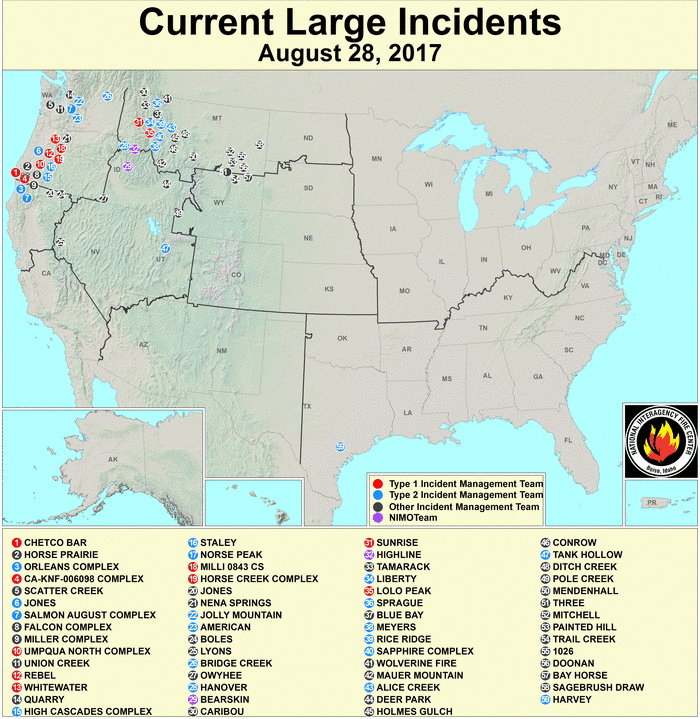
- Abnormal dryness (D0) to exceptional (D4) drought expanded in the High Plains of Montana but contracted in the northern Plains from Nebraska to the Dakotas — These changing conditions were reflected in a number of drought indices and indicators, including evapotranspiration (Evaporative Drought Demand Index [EDDI] for August and the summer, Evaporative Stress Index [ESI]), streamflow, and soil moisture (NLDAS top soil and total soil moisture, GRACE root zone and surface soil moisture, CPC model, Leaky bucket model, VIC model, SMOS satellite-based analysis). August 27th U.S. Department of Agriculture (USDA) reports of soil moisture conditions revealed very dry conditions in the northern Plains, with 97 percent of the topsoil moisture and 89 percent of the subsoil moisture short to very short (dry to very dry) in Montana, while the statistics were 52 percent for topsoil and 54 percent for subsoil in North Dakota, 43 percent for topsoil and 60 percent for subsoil in South Dakota, and 57 percent for topsoil and 60 percent for subsoil in Wyoming. Moisture stress on crops, and on vegetation in general (Vegetation Drought Response Index [VegDRI], Quick Drought Response Index [QuickDRI]), continued in Montana but improved further east as the month wore on (Crop Moisture Index [CMI] for weeks 1, 2, 3, 4, 5). The USDA reports indicated that pasture and rangeland were in poor to very poor condition for 67 percent of Montana, 62 percent of North Dakota, and 59 percent of South Dakota. Crop condition was poor to very poor for 32 percent of sorghum, 24 percent of corn, and 17 percent of soybeans in South Dakota; 18 percent of corn and 16 percent of soybeans in North Dakota; and 13 percent of corn and 10 percent of soybeans in Nebraska. Low yields were reported for winter wheat, and 23 percent of the corn crop was in poor to very poor condition, in Montana, and large wildfires burned throughout the month in the state (wildfire maps for August 3, 15, 28, 31).
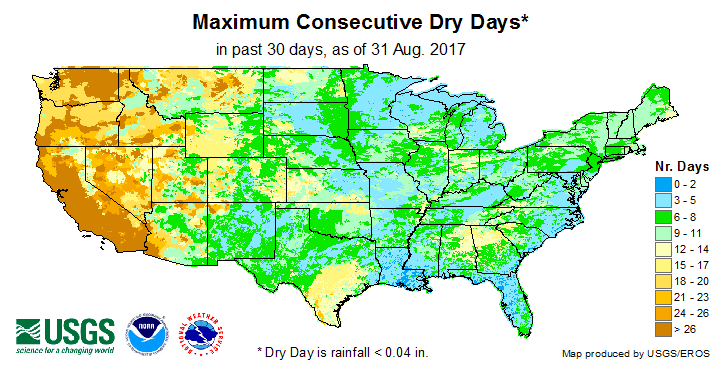
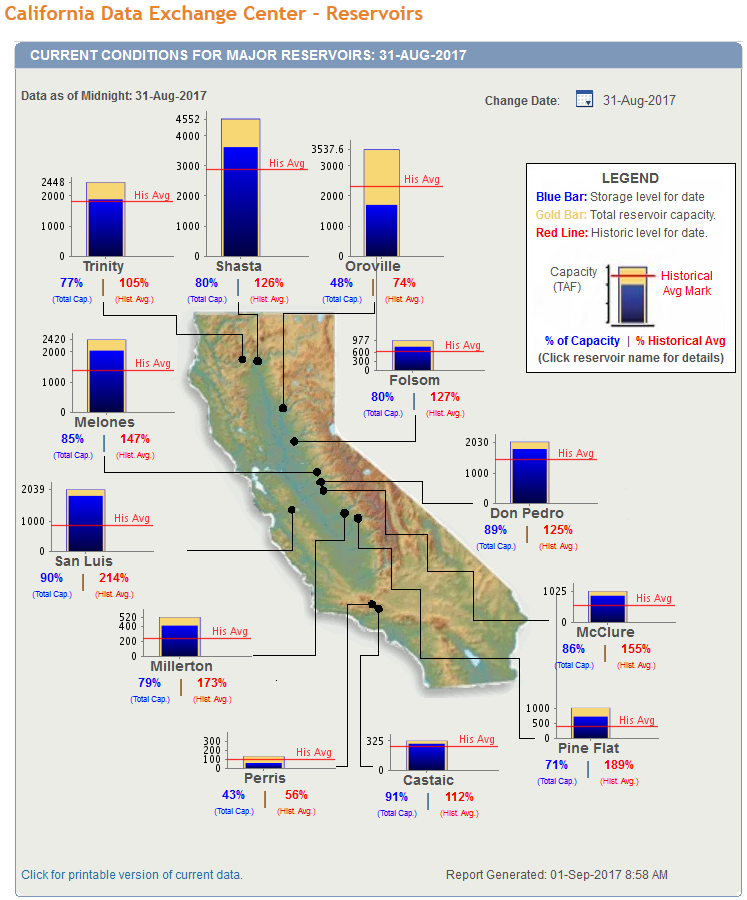
- Abnormal dryness and moderate (D1) to severe (D2) drought expanded in the northern Rockies and Pacific Northwest, and abnormal dryness to moderate drought lingered in parts of the Southwest (southern California and Arizona) and Great Basin — This was reflected in indices such as evapotranspiration (EDDI, ESI), groundwater (USGS and GRACE observations), number of rain days and consecutive dry days, some reservoirs, persistent widespread wildfires (wildfire maps for August 3, 15, 28, 31), and soil moisture (NLDAS top soil and total soil moisture, GRACE root zone and surface soil moisture, CPC model, Leaky bucket model, VIC model, SMOS satellite-based analysis). August 27th USDA reports of soil moisture conditions revealed very dry conditions across much of the West, with 85 percent of the topsoil moisture and 82 percent of the subsoil moisture short to very short in Oregon. The statistics were 79 percent for topsoil and 51 percent for subsoil in Washington, 64 percent for topsoil and 59 percent for subsoil in Idaho, 55 percent for topsoil and 52 percent for subsoil in Utah, 60 percent for topsoil and 45 percent for subsoil in Nevada, and (in spite of the wet winter) 70 percent for topsoil and 65 percent for subsoil in California. Moisture stress on crops, and on vegetation in general (QuickDRI), continued and expanded (CMI for weeks 1, 2, 3, 4, 5). USDA reports indicated that 58 percent of the pasture and rangeland in Washington, and 44 percent in Oregon, was in poor to very poor condition.
- Moderate drought expanded in the central Plains (Kansas) but drought and abnormal dryness contracted in the southern Plains — The Kansas dryness was reflected in low soil moisture (NLDAS top soil and total soil moisture, SMOS satellite-based analysis) and USDA reports, with 31 percent of the topsoil and subsoil moisture short or very short and 16 percent of the corn crop in poor to very poor condition.
- Abnormally dry to severe drought conditions expanded, and extreme (D3) drought developed, in Hawaii.
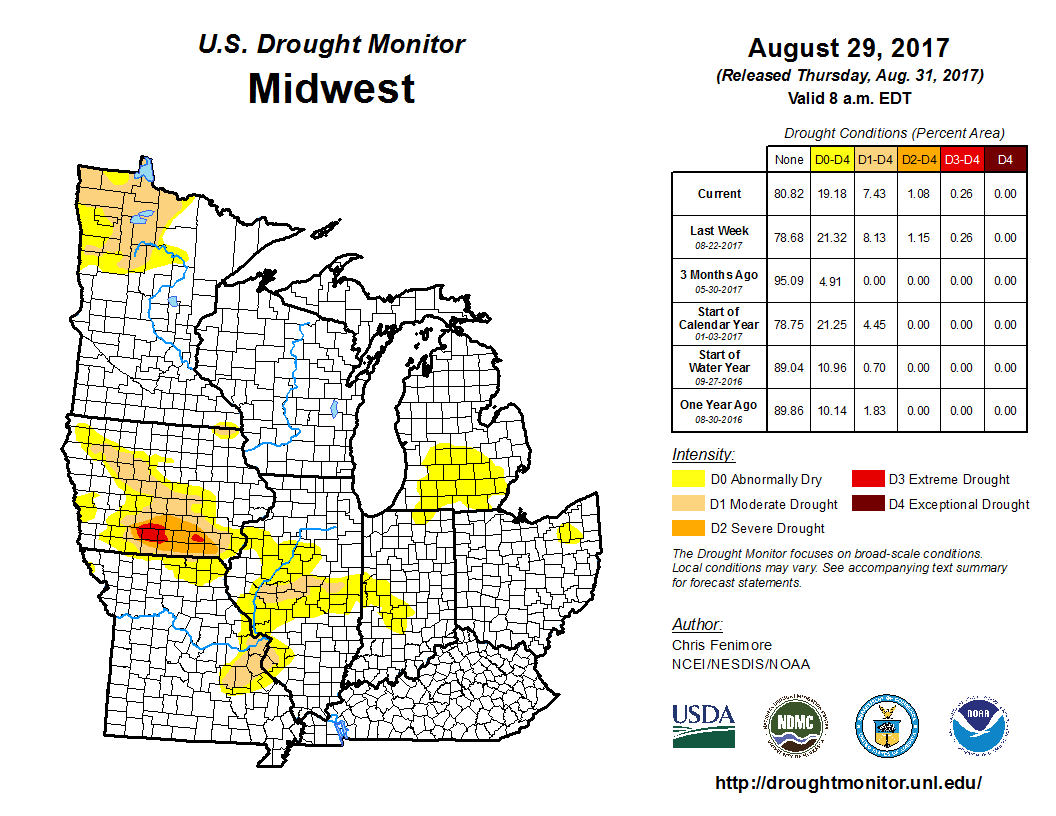
- There was some expansion and contraction of drought in the Midwest, with extreme drought developing in Iowa — The Iowa dryness was reflected in groundwater (GRACE) and soil moisture (NLDAS top soil and total soil moisture, GRACE root zone and surface soil moisture, CPC model, Leaky bucket model, VIC model, SMOS satellite-based analysis) indices. August 27th USDA reports indicated 39 percent of the topsoil moisture and 49 percent of the subsoil moisture short to very short in Iowa, with the statistics 48 percent for topsoil and 46 percent for subsoil moisture in Illinois, 51 percent for topsoil and 46 percent for subsoil in Michigan, and 41 percent for topsoil and 35 percent for subsoil in Indiana. Pasture and rangeland were impacted by the dryness (40 percent in poor to very poor condition in Iowa) but the corn crop was not so much (only 12 percent in poor to very poor condition in Iowa, 13 percent in Michigan, 14 percent in Illinois, and 18 percent in Indiana).
- Abnormal dryness and moderate drought expanded in the Northeast (especially Maine) — The Maine dryness was reflected in evapotranspiration (ESI), groundwater (USGS observations), streamflow (USGS observations), and soil moisture (NLDAS top soil and total soil moisture, CPC model, SMOS satellite-based analysis) indicators, plus USDA reports with 84 percent of the topsoil and 92 percent of the subsoil moisture short or very short.
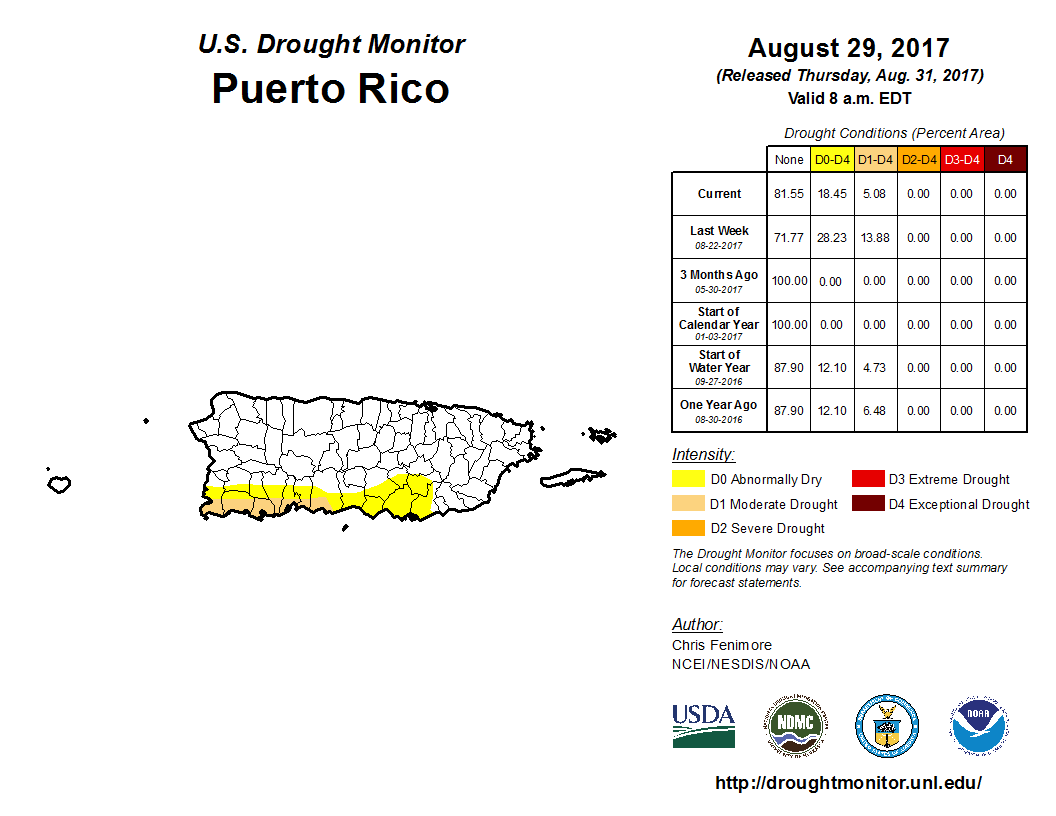
- Abnormal dryness and moderate drought shrank in Puerto Rico, abnormal dryness shrank and moderate drought disappeared in Alaska, and abnormal dryness lingered in parts of the Southeast — USDA reports indicated 56 percent of the topsoil and 44 percent of the subsoil moisture was short or very short in Georgia, but the dryness did not seem to be impacting agricultural activities much.
Palmer Drought Index
The Palmer drought indices measure the balance between moisture demand (evapotranspiration driven by temperature) and moisture supply (precipitation). The Palmer Z Index depicts moisture conditions for the current month, while the Palmer Hydrological Drought Index (PHDI) and Palmer Drought Severity Index (PDSI) depict the current month's cumulative moisture conditions integrated over the last several months. While both the PDSI and PHDI indices show long-term moisture conditions, the PDSI depicts meteorological drought while the PHDI depicts hydrological drought. The PDSI map shows less severe and extensive drought in parts of the country than the PHDI map because the meteorological conditions that produce drought and wet spell conditions are not as long-lasting as the hydrological impacts.
|
 |
Used together, the Palmer Z Index and PHDI maps show that short-term dry conditions occurred across much of the Pacific Northwest to Montana High Plains, making long-term drought conditions worse in Montana and contracting the long-term wet conditions in the Northwest. Short-term dryness also was evident across much of the Southwest and in parts of the Midwest, Northeast, and Southeast. Short-term wet conditions in the northern Plains reduced long-term drought conditions in August compared to the end of July. The excessive short-term wet conditions in the southern Plains to Lower Mississippi Valley created widespread long-term wet conditions in August where little long-term wetness was evident last month.
Standardized Precipitation Index
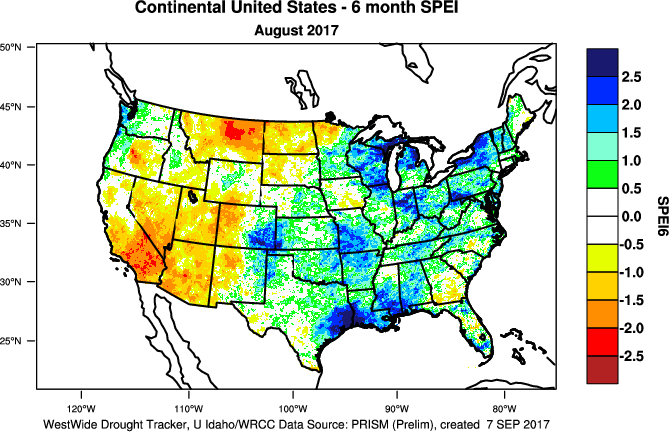
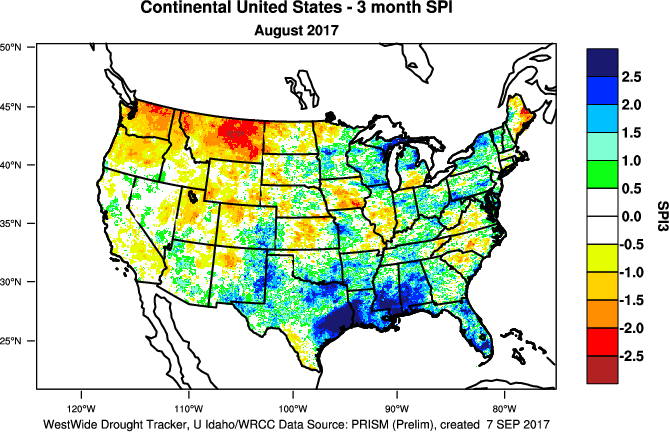
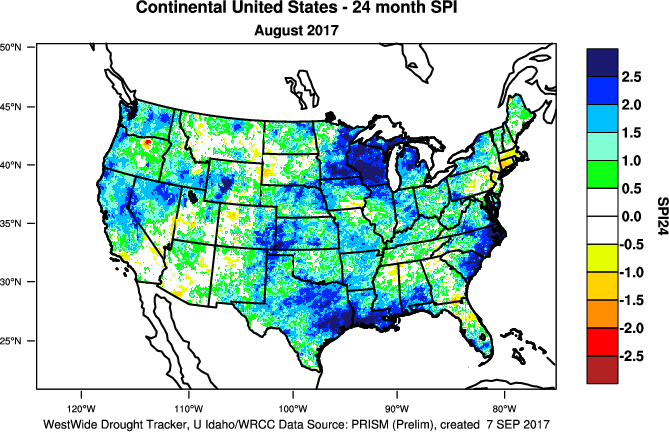
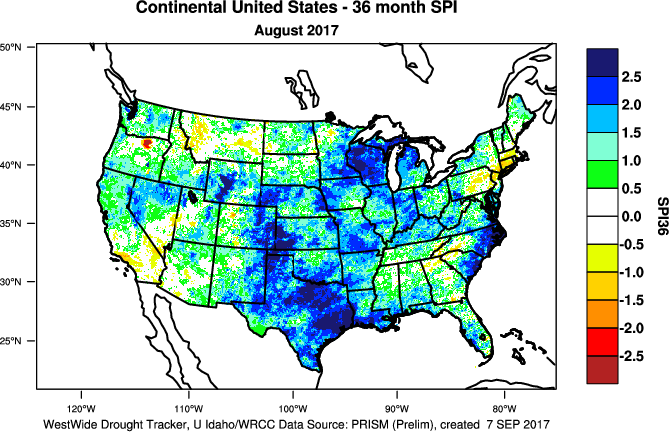
The Standardized Precipitation Index (SPI) measures moisture supply. The SPI maps here show the spatial extent of anomalously wet and dry areas at time scales ranging from 1 month to 24 months.
 |
 |
 |
The SPI maps illustrate how moisture conditions have varied considerably through time and space over the last two years. Dryness in the Pacific Northwest to northern and central Rockies and High Plains is evident at the 1- to 3-month time scales, while the Pacific Northwest shows up as wet at the 6- to 24-month time scales. Much of the northern Plains is dry on the 6- to 9-month maps, while parts of the northern Plains have dryness at 2, 3, and 12 to 24 months. Areas of dryness can be seen in the Southwest at the 1-, 2-, and 6-month time scales. Central Kansas is consistently dry for the last 1 to 3 months. Much of the Midwest is dry in August (1-month SPI), parts of the region is dry at 3 months, and southeast Iowa is consistently dry for the last 1 to 12 months. In the Northeast, Maine has dryness for 1-3 months, while southern New England shows up as dry at the 1- to 2-month and 12- to 24-month time scales. Parts of the Southeast have dryness on the 1- to 3-month SPI maps. On the other hand, much of the West is wet at the 9- to 24-month time scales, the Great Lakes is wet at the 6- to 24-month time scales, and wetness dominates the southern Plains to Lower Mississippi Valley at all time scales.
 |
 |
 |
Standardized Precipitation Evapotranspiration Index
The SPI measures water supply (precipitation), while the SPEI (Standardized Precipitation Evapotranspiration Index) measures the combination of water supply (precipitation) and water demand (evapotranspiration as computed from temperature). Warmer temperatures tend to increase evapotranspiration, which generally makes droughts more intense.
 2-month SPEI for current month.
|
 2-month SPI for current month.
|
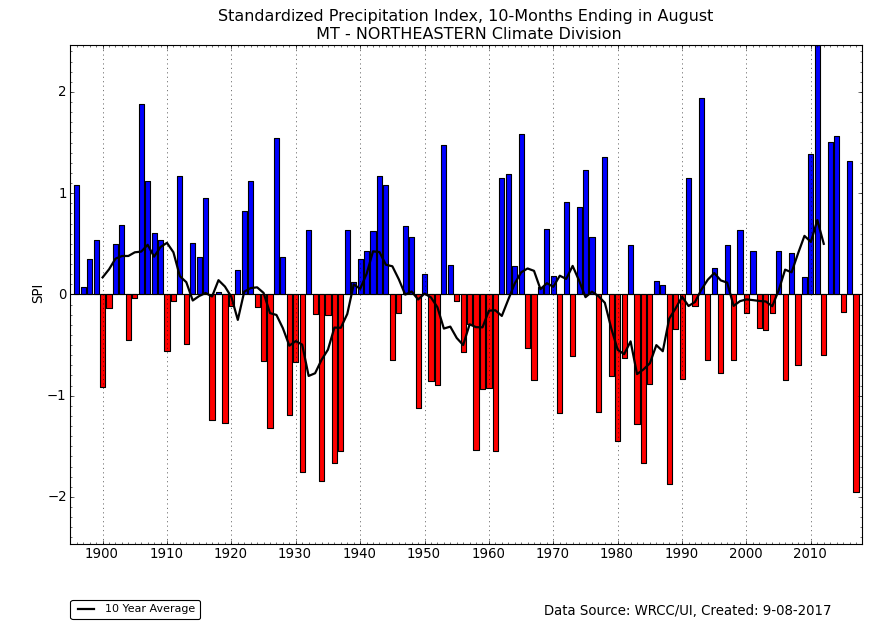
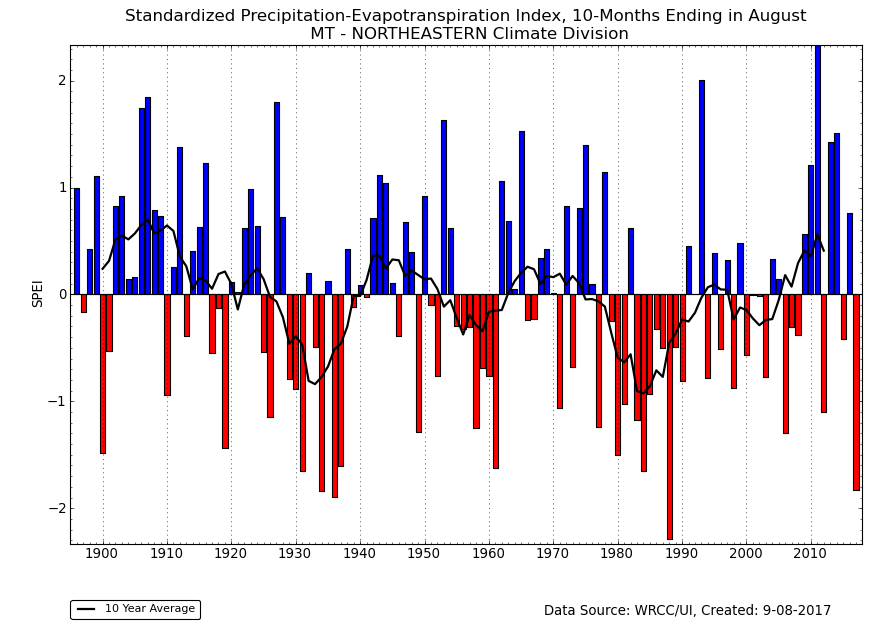
10-month SPI, Northeast Montana (climate division 6), August, 1895-2017.
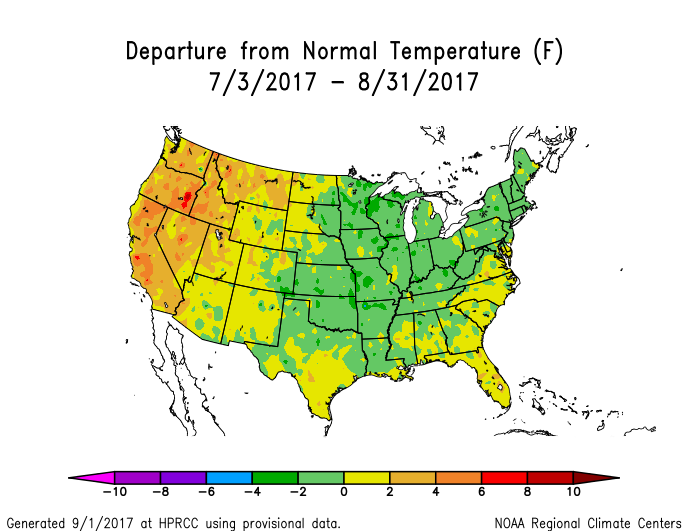
The last one to three months have been unusually hot and dry in the West, especially in the Northwest (August temperatures and precipitation, June-August temperatures, precipitation). This was especially the case during the last two months (July-August temperatures, precipitation). July-August 2017 was the driest and fifth warmest for Montana, 17th driest and warmest for Oregon, second driest and fourth warmest for Washington, and 13th driest and fourth warmest for Idaho. Warmer-than-normal temperatures worsen drought conditions where low precipitation occurs (SPEI maps for August, July-August) (SPI maps for August, July-August). The combination of the extreme heat and dryness gave Idaho, Oregon, and Washington the most severe SPEI in the 1895-2017 record, and Montana the second most severe SPEI (after 2003). California, with the warmest and 55th driest July-August, also had the most severe July-August SPEI on record, but it should be noted that this is California's dry season when barely any precipitation normally falls, so the record SPEI value is largely due to the record heat.
Northeast Montana (climate division 6) has been record dry for the last ten months (precipitation for November-August, December-August, January-August, February-August, March-August, April-August, May-August, June-August). November 2016-August 2017 was the driest such 10-month period in the 1895-2017 record, but it was only the 15th warmest. This resulted in the driest SPI and fourth most extreme SPEI. Even so, it is comparable to the SPEI values of the 1930s. Only November 1987-August 1988 (most extreme SPEI), November 1935-August 1936, and November 1933-August 1934 were worse droughts by this measure.
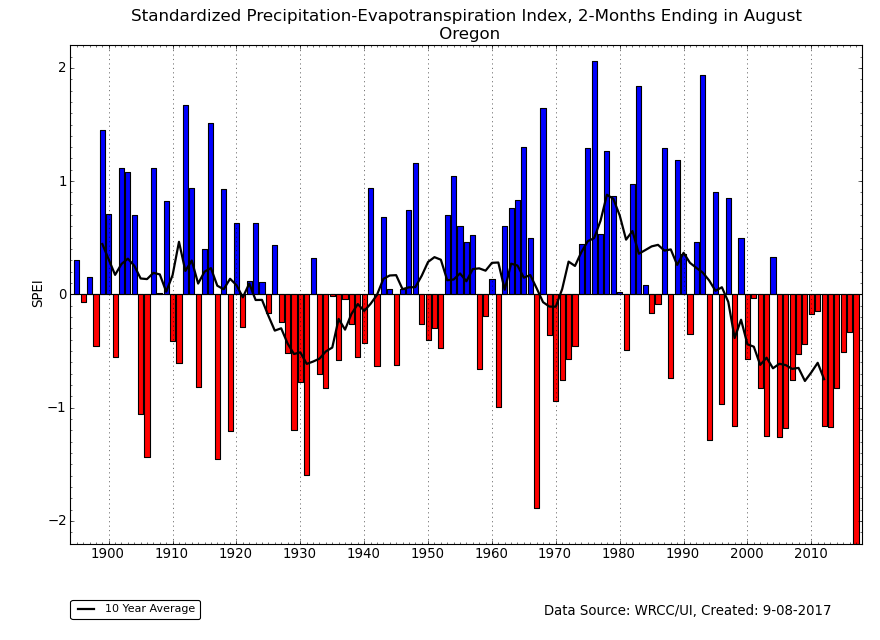 2-month SPEI for Oregon, August, 1895-2017.
|
 2-month SPEI for Washington, August, 1895-2017.
|
A trough has dominated the circulation pattern over the eastern CONUS for much of the last four months, resulting in cooler-than-average temperatures east of the Rockies for the last one to three months and not-as-warm anomalies there at the 6-month time scale. But warmer-than-normal temperatures have dominated most of the country for the last eight to twelve months. Since much of the country for most of this time (outside of the West recently) has been wet, the SPEI and SPI maps show similar patterns (SPEI maps for the last August and the last 2, 3, 6, 8, 12 months) (SPI maps for the last August and the last 2, 3, 6, 8, 12 months). The excessive heat and dryness in the West for the last six years shows up as an increasing divergence in the depiction there on the SPEI and SPI maps (SPEI maps for the last 12, 24, 36, 48, 60, 72 months) (SPI maps for the last 12, 24, 36, 48, 60, 72 months).
 72-month SPEI for current month.
|
 72-month SPI for current month.
|
In California, the last twelve months have been wet, ranking as the fifth wettest September-August on record, but most of the previous 15 years have been dry. The dryness has been compounded by persistent and unusually warmer-than-normal temperatures; this has been occurring for the last 35 years, but especially for the last four to five years when record to near-record warmth occurred. September 2014-August 2015 was the warmest September-August on record, 1996 second warmest, 2014 third warmest, 2016 fourth warmest, 2013 sixth warmest, 2000 seventh warmest, and 2017 ninth warmest. The heat has increased evapotranspiration and exacerbated drought conditions. While the 72-month SPI registered dryness, it was nowhere near record. However, the 72-month SPEI for the last 72 months was second driest on record; last year's 72-month SPEI was record dry. This even with the fifth wettest September-August this year.
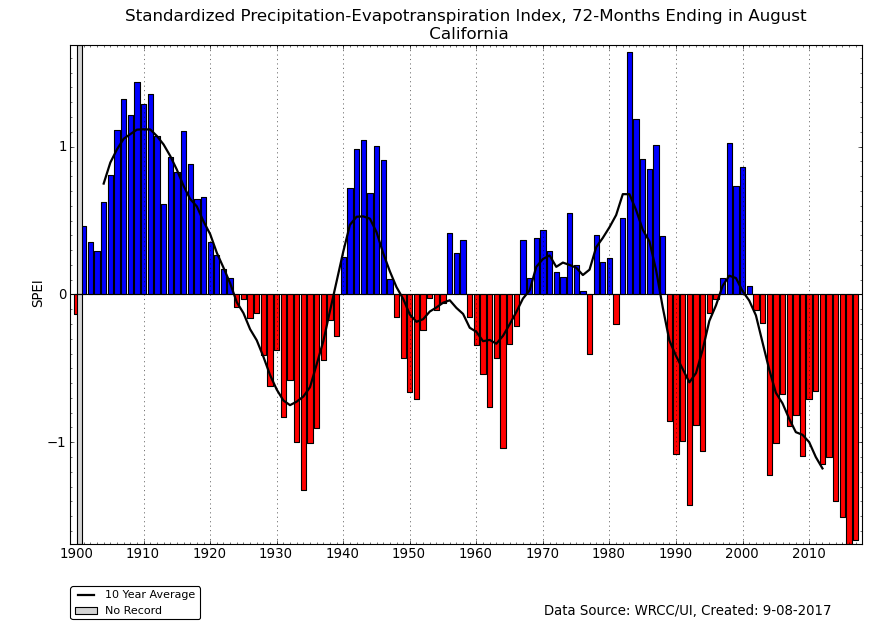 72-month SPEI for California, August, 1895-2017.
|
 California statewide temperature, September-August, 1895-2017.
|
Regional Discussion
 NOAA Crop Moisture Index
|
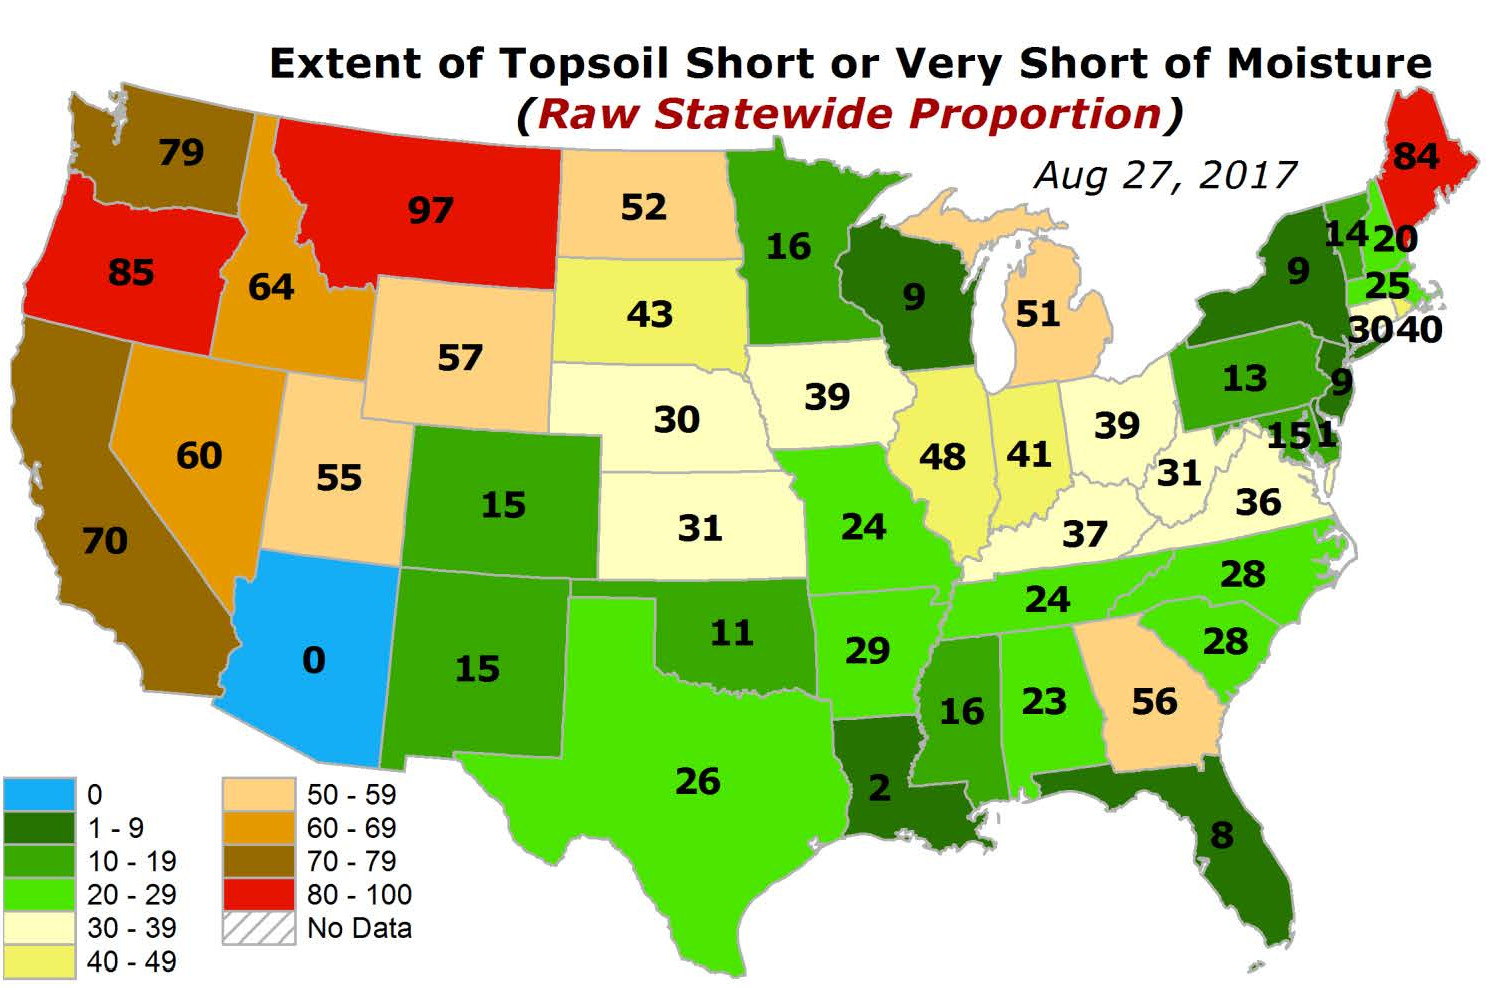 USDA soil moisture conditions
|
 NOAA soil moisture percentiles
|
CONUS Agricultural & Hydrological Impacts:
Drought conditions at the end of August 2017 were reflected in a number of meteorological, hydrological, and agricultural indicators, both observed and modeled. These include: evapotranspiration (EDDI, ESI), streamflow, groundwater (USGS and GRACE observations), number of rain days and consecutive dry days, soil moisture (NLDAS top soil and total soil moisture, GRACE root zone and surface soil moisture, CPC model, Leaky bucket model, VIC model, SMOS satellite-based analysis), vegetation stress (VegDRI, QuickDRI), and CMI (weeks 1, 2, 3, 4, 5), as well as the PHDI, SPI, SPEI, and other drought indices. On a national scale, as of August 29th, 2017, 15 percent of hay acreage, eleven percent of cattle inventory, ten percent of corn production, eleven percent of soybean production, and 18 percent of winter wheat production were within an area experiencing drought, but 57 percent of spring wheat production was. As noted by the USDA, only twelve percent of the nation's corn crop, eleven percent of soybeans, and 22 percent of the nation's pasture and rangeland were in poor to very poor condition, but 38 percent of the nation's topsoil moisture and 38 percent of subsoil moisture were short to very short of moisture. As seen earlier, conditions were more extreme on a statewide basis.

Hilo, Hawaii, precipitation, February-August, 1950-2017.
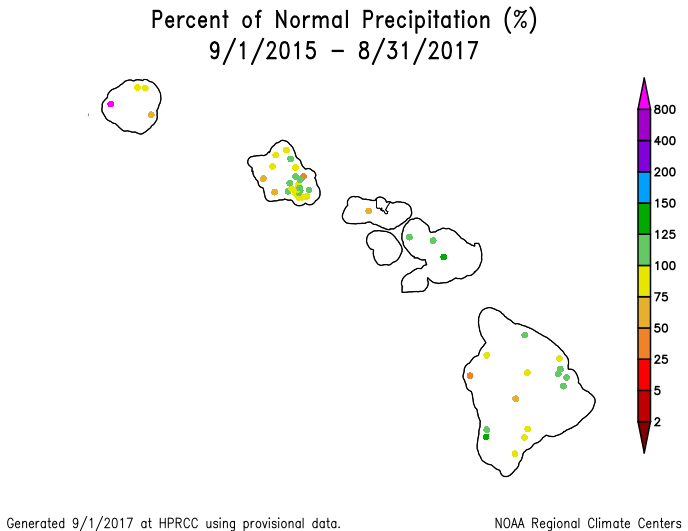
Hawaii: August 2017 had a mixed precipitation anomaly pattern across the Hawaiian Islands. Dryness was evident over the southern islands during the last 2 months and in places across the islands during the last 3 months. The Big Island was dry at the 5-, 6-, and 8-month time scales, with Hilo having the sixth driest March-August, fourth driest February-August, and seventh driest January-August in the 1950-2017 record. Drier-than-normal conditions tended to dominate the anomaly pattern for the last 11 to 12 months, especially over the Big Island and Oahu. A mixed anomaly pattern was evident at longer time scales (last 24 to 36 months). On the USDM map, moderate drought conditions contracted but severe drought expanded and extreme drought appeared this month; moderate to extreme drought covered about two-thirds of the state on the August 29th, 2017 USDM map.

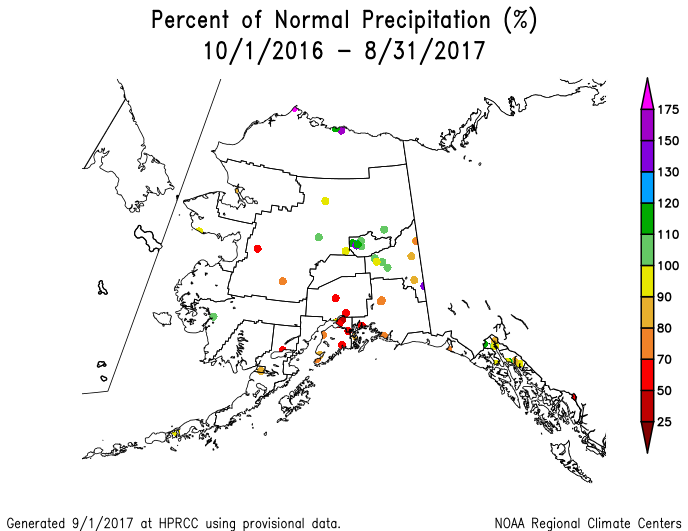
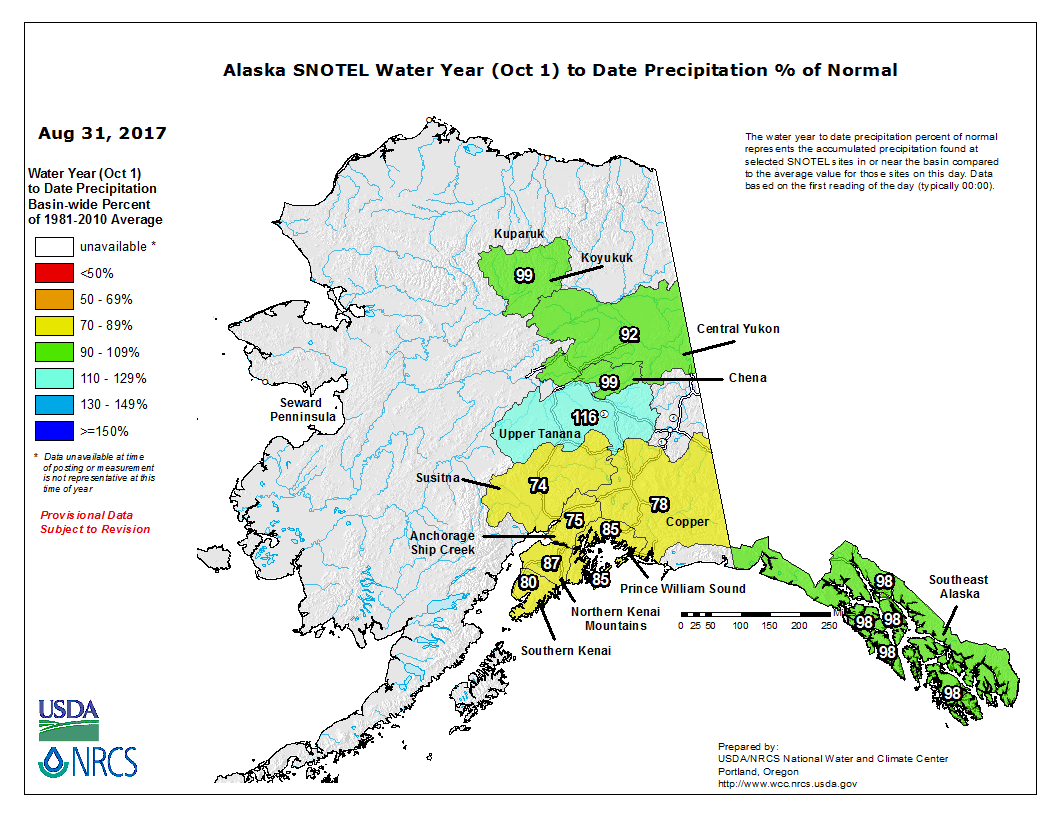
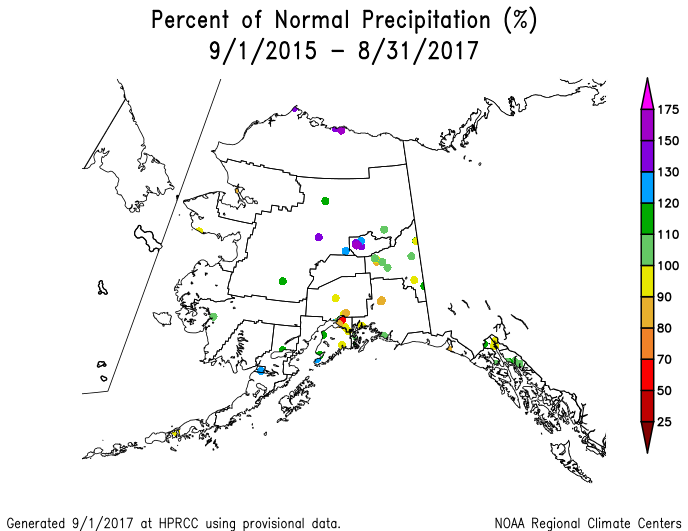
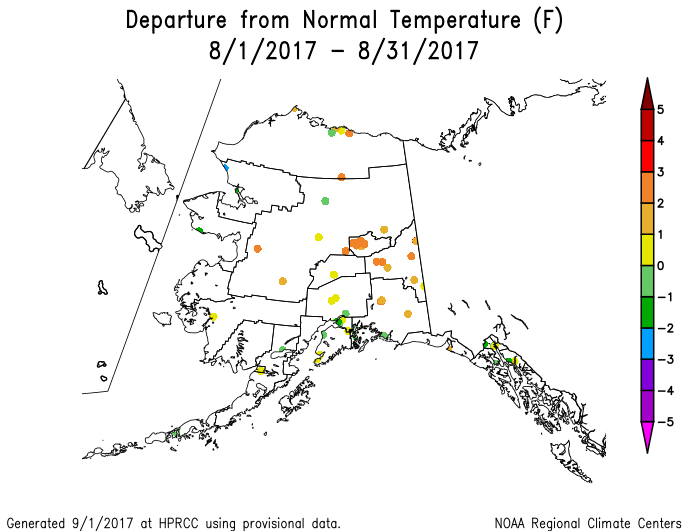
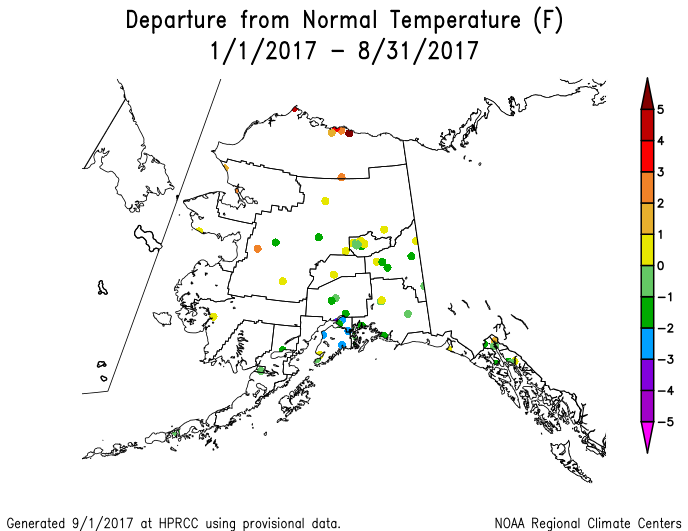
Alaska precipitation percentiles map, August 2017.
Alaska: August 2017 was drier than normal in the northwest and interior southeast, based on the low elevation station and gridded maps, and wetter than normal elsewhere, except the high elevation (SNOTEL) stations had a more mixed anomaly pattern. There was a little bit more dryness (less wet conditions) at the 2- and 3-month (low elevation station, gridded, divisional maps) time scales. Dry conditions were more pronounced at the 5-, 6-, and 8-month (low elevation station, gridded, divisional maps) time scales, especially in the northwest and southwest regions. Drier-than-normal conditions were more widespread and intense for the last 11 (low elevation station, SNOTEL station, SNOTEL basin maps) to 12 months (low elevation station, divisional maps), especially in the southerly locations. The precipitation anomaly pattern was mixed at 24 to 36 months. August was cooler than normal in the northwest and warmer than normal elsewhere (low elevation station, gridded, divisional maps). Warmer-than-normal conditions dominated during July-August and the summer (June-August) (low elevation station, gridded, divisional maps). The southeast was near to cooler than normal during March-August and January-August (low elevation station, gridded, divisional maps), with warmer-than-normal conditions continuing to the north and west. This pattern was also evident for the last 11 to 12 months (low elevation station, divisional maps). Moderate drought disappeared this month and abnormal dryness shrank to about ten percent of the state on the August 29th USDM map.
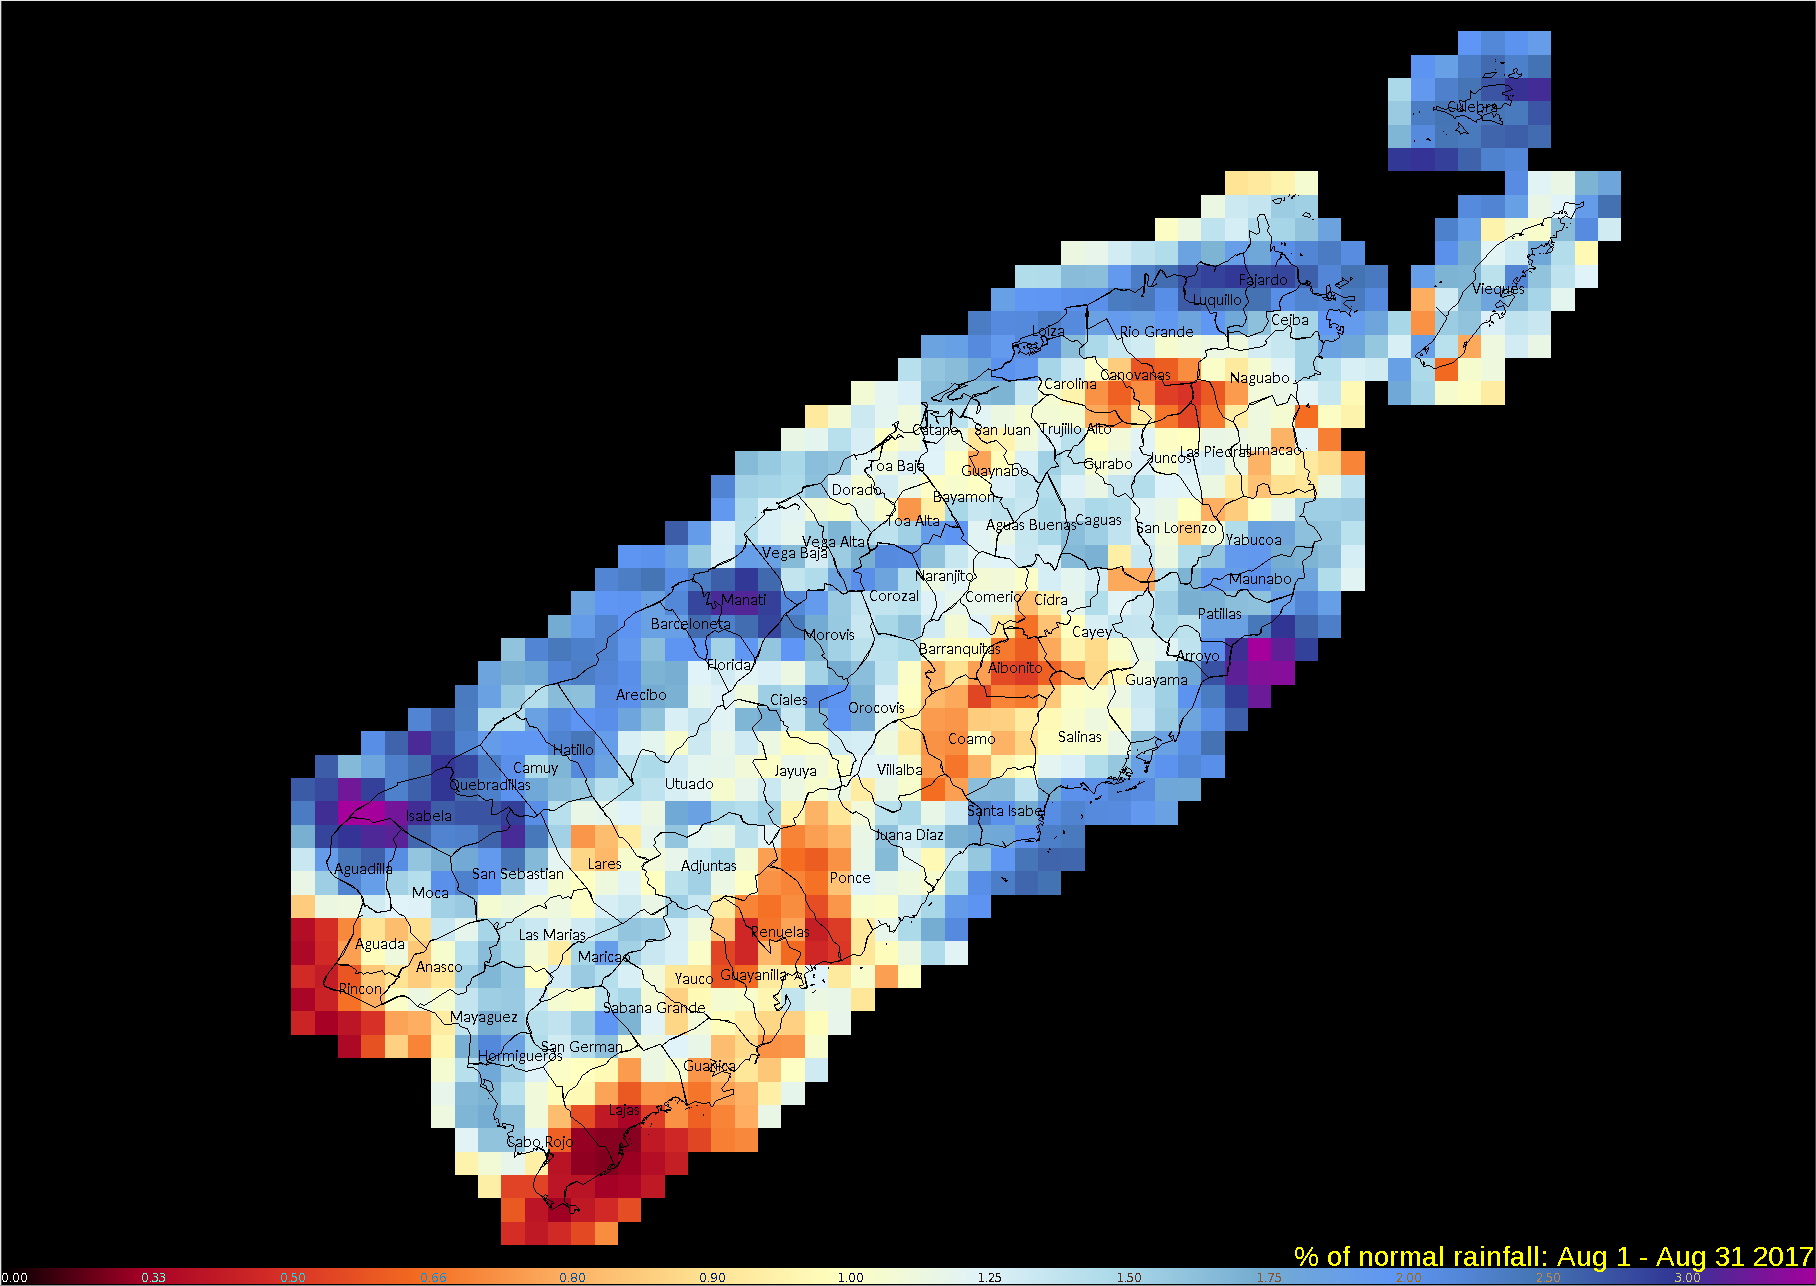
Puerto Rico percent of normal precipitation, August 2017 (provided by the NOAA/NWS Southeast River Forecast Center).
Puerto Rico: Much of Puerto Rico was wetter than normal during August, with parts of the interior and coastal west drier than normal. Precipitation anomaly maps for other time scales were not available this month. The rains improved soil moisture conditions, with only the southwest coastal areas still having dry soils. As seen on the August 29th, 2017 USDM map, abnormal dryness and drought shrank this month, with about 5.1 percent of Puerto Rico in moderate drought and 18.5 percent abnormally dry or worse.
CONUS State Precipitation Ranks:

|

|
August 2017 was drier than normal across the Pacific Northwest to northern High Plains, much of the Midwest and Southwest, and parts of the Southeast and Northeast. On a statewide basis, 13 states ranked in the driest third of the historical record with Montana having the eleventh driest August and Rhode Island the twelfth driest August in the 1895-2017 record. However, the last two months were extremely dry in Montana, with July-August 2017 ranking as the driest July-August on record. Washington had the second driest July-August on record.

|

|
At the 3-month time scale, dryness was evident in the Pacific Northwest, northern to central Rockies and Plains, and parts of the Midwest, Northeast, and Southeast. Eleven states ranked in the driest third of the 1895-2017 record, including Montana which had the second driest June-August and Washington which was seventh driest.

|

|
The dryness persisted at the 6-month time scale in the northern Plains with areas of dryness in the Southwest. Five states ranked in the driest third of the historical record, including North Dakota and Montana which had the eighth driest March-August. The northeast climate division in Montana had the driest March-August on record.
The year-to-date was drier than normal in the northern Plains, with wet conditions dominating elsewhere. Three states ranked in the driest third of the historical record, including North Dakota which had the seventh driest January-August. Again, the northeast climate division in Montana had the driest January-August on record.
There were some areas of below-normal precipitation for the last 12 months, but wetness dominated in the CONUS. On a statewide basis, only Massachusetts ranked in the driest third of the historical record.
 Primary Corn and Soybean Belt precipitation, August, 1895-2017.
|
 Primary Corn and Soybean Belt precipitation, March-August, 1895-2017.
|
August 2017 was drier than normal across the eastern portions of the Primary Corn and Soybean agricultural belt and wetter than normal in the northwest and south, while temperatures were cooler than normal regionwide. The month ranked as the 37th wettest and ninth coolest August, regionwide, in the 1895-2017 record. March marks the beginning of the growing season for the Primary Corn and Soybean agricultural belt. March-August 2017 was warmer and wetter than normal across most of the region, ranking as the 15th wettest and 33rd warmest March-August, regionwide, on record.
NOAA Regional Climate Centers:
A more detailed drought discussion, provided by the NOAA Regional Climate Centers and others, can be found below.
As described by the High Plains Regional Climate Center, August temperatures were largely below normal for much of the High Plains region and the month had a mix of wet and dry conditions. The cool temperatures have producers concerned about drying crops down for harvest and the risk of an early frost or freeze that would be especially detrimental to late-planted and replanted crops. For instance, Growing Degree Days (GDDs) accumulate less quickly during cooler weather, which slows the progress of crop growth and delays crops from reaching maturity. The precipitation pattern in August indicated mostly dry conditions in the western High Plains and across much of Kansas with wetter conditions to the east. While the August dryness was not record-breaking, the excessive wetness throughout the Dakotas and Nebraska was particularly impactful, as heavy rains relieved drought conditions across these areas but caused flash flooding as well. One concern that has come about as a result of recent wetness is the drying down of crops for harvest. Typically, crops are dried naturally in Nebraska due to expected low relative humidity values in the fall. However, with the extra moisture present, propane may need to be used for drying, which could lead to a shortage of supply and an increase in cost.
As for the summer season, it was warm and dry across the majority of the High Plains with the exception of eastern parts of the region where summer temperatures were slightly below normal. Salina, Kansas had its 4th driest summer on record, while Valentine, Nebraska and Minot, North Dakota had their 5th driest summers. Despite the presence of drought this summer across parts of the Dakotas, excessive precipitation in August brought up summer precipitation totals and prevented many locations from having record-breaking dryness for the season. Prolonged dryness continued along the Kansas/Nebraska border and across northern Kansas, resulting in flows along several streams running below normal. Amidst the dryness, there were pockets of wetter conditions across central Nebraska, southeastern Colorado, and extreme eastern Kansas. For instance, Alamosa, Colorado had its 7th wettest summer on record.
Thanks to cooler temperatures and heavy rainfall during the month of August, drought conditions eased in portions of the High Plains. According to the USDM, the area experiencing abnormally dry or drought conditions (D0-D4) decreased from approximately 62 percent to 50 percent, and only one quarter of the region was in drought (D1-D4) by the end of the month. Beneficial rainfall occurred across parts of the Dakotas and northern Nebraska where it was needed the most. These areas received greater than 200 percent of normal precipitation during August. The rainfall helped with the green up of pastures and improvement of soil moisture and row crop conditions. However, other areas of the region missed out on the rainfall. For instance, central Kansas was dry this summer, receiving less than 70 percent of normal precipitation. As a result, moderate drought (D1) expanded in the area during August. Conditions also worsened in southwestern South Dakota, where extreme drought conditions (D3) expanded. While on the periphery of the High Plains region, it is important to note that Montana has been dealing with impacts from the Northern Plains drought. Conditions worsened across the state in August, as it was very dry throughout most of the month. Most of the state's topsoil moisture continued to be short to very short, and over two-thirds of its pastureland was in poor to very poor condition. Dry lightning has sparked fires and burned thousands of acres, and the irrigation season ended early in some locations.
As explained by the Southern Regional Climate Center, August had below to near normal temperatures and above-normal precipitation for most of the region. Hurricane Harvey resulted in heavy precipitation across parts of Louisiana and Texas, while other parts of Texas, Oklahoma, and Arkansas, and most of Louisiana, were also wetter than normal. There were clusters of 50-75 percent of normal precipitation in southern Tennessee, and central and southwestern Texas. A few areas in southwestern Texas reported 2-25 percent of normal precipitation.
Over the month of August 2017, drought conditions improved for most parts of the region, such as areas in Oklahoma and central and northern Texas. In contrast, drought conditions worsened in southern Texas. Currently, there are areas of moderate drought present in southwestern Texas. At this time there are no areas of severe, extreme, or exceptional drought. There are a few small areas of abnormally dry conditions in southern Texas, northern Oklahoma, and northeastern Mississippi.
As summarized by the Midwest Regional Climate Center, August precipitation in the Midwest was largely limited to Minnesota, western Iowa, Missouri and Kentucky as dry conditions prevailed across most of the central Midwest. Region-wide, the Midwest had 3.80 inches (96.5 mm) which was 0.14 inches (3.5 mm) above normal. Areas of southwestern Minnesota, and western Missouri had more than twice the normal amount, while western Iowa, eastern southeastern Kentucky, northeastern Minnesota and the U.P. of Michigan had less than 75 percent of normal. Precipitation for the June through August period was 11.98 inches (304.3 mm) which was 0.02 inches (0.5 mm) above normal. However, many precipitation extremes occurred. Portions of Iowa, central Illinois and southern Lower Michigan had less than 75 percent of normal, while areas in Missouri, Ohio, Wisconsin and the U.P. of Michigan had more than 125 percent of normal. Rainfall often fell in extreme amounts with extended dry periods in between. August temperatures were below normal across nearly all of the Midwest. For the summer, the Midwest was slightly cooler than normal.
Drought persisted across western Iowa and northwestern Minnesota in August and worsened in southern Iowa. Drought coverage across the Midwest remained at less than 9 percent during the month. Extreme drought was added to several counties in south-central Iowa during the middle of August. Moderate drought was also added in central Illinois along with an expansion of abnormally dry conditions in southern Lower Michigan.
As noted by the Southeast Regional Climate Center, temperatures were below average (driven primarily by unusually cool maximum temperatures) across interior portions of the Southeast region during August, while near-average to above-average temperatures were observed along much of the coastal plain. Precipitation was highly variable across the Southeast region during August, with several wet extremes recorded. Unusual dryness was found in portions of east-central and southeastern Florida, the Florida Keys, the southern half of Georgia, central South Carolina, and south-central North Carolina, where monthly precipitation totals were 2 to 5 inches (50.8 to 127 mm) below normal. Monthly precipitation ranged from well below normal to well above normal across Puerto Rico and the U.S. Virgin Islands.
Drought conditions (D1 and greater) were not observed across the mainland portion of the Southeast region during August. However, below-average precipitation caused abnormally dry (D0) conditions to persist across central portions of North Carolina and Virginia, with additional development occurring in areas of South Carolina and Georgia during the second half of August. A narrow strip of moderate (D1) drought persisted along the southwestern coast of Puerto Rico, but drought conditions were removed from the south-central portion of the island. During the first half of the month, croplands and pastures were aided by mild temperatures and near-average to above-average rainfall across much of the region, but excessive wetness in some areas prevented agricultural producers from harvesting crops and cutting hay. Favorable weather conditions, including consistent rainfall and few days of extreme heat, throughout much of August and summer contributed to exceptional yields of corn in Alabama and peanuts in Georgia. However, some farmers in Alabama had to spray fungicides regularly in their soybean and peanut fields, as abundant precipitation increased fungal disease pressure on these crops. In addition, persistent rainfall during early August caused wine grapes to rot across northern Georgia, despite a steady application of fungicides in some vineyards. Coupled with a multi-day period of excessive heat, predominately dry weather during the latter half of the month stressed crops and pastures across central portions of the Carolinas and Virginia, as well as southern Georgia. Many livestock producers in central Virginia had to begin a supplemental feeding for their herds due to insufficient grazing conditions, with some producers preparing to purchase hay reserves for autumn and winter.
As explained by the Northeast Regional Climate Center, August was a drier-than-normal month for the Northeast. The region picked up 3.56 inches (90.42 mm) of rain, which was 92 percent of normal. Eight states were drier than normal, one wrapped up the month at normal, and three were wetter than normal. Precipitation ranged from 45 percent of normal in Rhode Island, its 12th driest August, to 176 percent of normal in Delaware, its 16th wettest August. Summer ended on the wet side of normal for the region with 13.19 inches (335.03 mm) of rain, 107 percent of normal. Seven states received above-normal precipitation, with precipitation for all states ranging from 78 percent of normal in Maine to 147 percent of normal in Delaware, its 13th wettest summer. For the first time since March 2015, all twelve Northeast states had a monthly average temperature that was colder than normal.
The USDM released on August 3 showed 2 percent of the Northeast — portions of northern and eastern Maine — was in a moderate drought. Abnormal dryness covered 8 percent of the region, including portions of New York's Long Island, southeastern New Hampshire, and southern, eastern, and northern Maine. Moderate drought and abnormal dryness expanded in Maine during the month. Abnormal dryness also expanded in southeastern New Hampshire, was introduced in southeastern Massachusetts, southern Rhode Island, and southern Connecticut, and lingered across Long Island. The USDM released on August 31 showed 5 percent of the Northeast was in a moderate drought and 8 percent of the region was abnormally dry.
As summarized by the Western Regional Climate Center, August temperatures were above normal for the coastal states and western Great Basin and generally near normal elsewhere. The Pacific and Inland Northwest were drier than normal, while parts of California and the Great Basin observed well above normal precipitation associated with monsoon thunderstorms.
More specifically, this month was drier than normal in the Pacific Northwest, however, it should be noted that August is typically one of the driest months of the year in this area. Seattle, Washington, reported 0.02 in (0.5 mm), 2% of normal and the 3rd driest August since records began in 1945. Seattle saw its longest run of dry days on record this year, with 55 consecutive days of no measurable precipitation ending August 11. Roseburg, Oregon, received no measurable precipitation this month, as is 21 other years in its 119-year record. Normal August rainfall is 0.47 in (12 mm) at Roseburg. Drier than normal conditions were also present across northern Idaho and Montana, where August precipitation is more significant. Great Falls reported 0.06 in (1.5 mm), 4% of normal and the 4th driest August since records began in 1937. Montana saw expansion and increase in severity of drought conditions in the US Drought Monitor this month; more than 90% of the state is now experiencing moderate to exceptional drought. Precipitation was variable across the area typically impacted by North American Monsoon activity, with scattered areas of above, below, and near normal precipitation. August began with well above normal temperatures, especially in the Pacific Northwest, associated with an amplified ridge. The passage of a couple low-pressure systems helped to moderate temperatures in the coastal states mid-month, and a building ridge raised temperatures again over the last week of the month.
Wildfires impacted the West all month. National Preparedness Level reached 5, the highest level, this month. In Oregon, the Chetco Bar Fire near Brookings burned over 142,000 acres (57,000 hectares) and destroyed 5 homes. In northern California, the Ponderosa Fire near Oroville has burned over 4,000 acres (1,600 hectares) and destroyed 32 homes. The Rice Ridge Fire near Seeley Lake, Montana, burned roughly 40,000 acres (16,000 hectares) by the end of August and prompted the evacuation of nearly all residents of Seeley Lake. Smoke from wildfires in British Columbia and within the region produced extended periods of poor air quality. Some of the greatest impacts were seen in central/eastern Washington as well as the Seattle area, where air quality reached levels considered "unhealthy" at times.
In Alaska, precipitation was near to well above normal for most of the state, though some locations in the Southcentral region observed below normal precipitation. For example, Cordova logged 15.51 in (394 mm), 175% of normal, while Gulkana recorded 1.07 in (27 mm), 59% of normal. Temperatures were near normal across much of Alaska, except for the Interior region, where temperatures were 1-3 F (0.5-1.5 C) above normal at some locations. Fairbanks reported an average 58.8 F (14.9 C), 2.7 F (1.5 C) above normal.
In Hawaii, August temperatures were above normal throughout the state. Lihue, Kauai, reported its all-time warmest month on record at 82.7 F (28.2 C), 3 F (1.7 C) above normal. Precipitation was variable across the state, but most locations reported near normal to slightly below normal precipitation. Kahului, Maui, recorded 0.25 in (9 mm), 52% of normal. Several locations on Oahu reported above normal precipitation; Honolulu recorded 1.85 in (47 mm), 330% of normal.
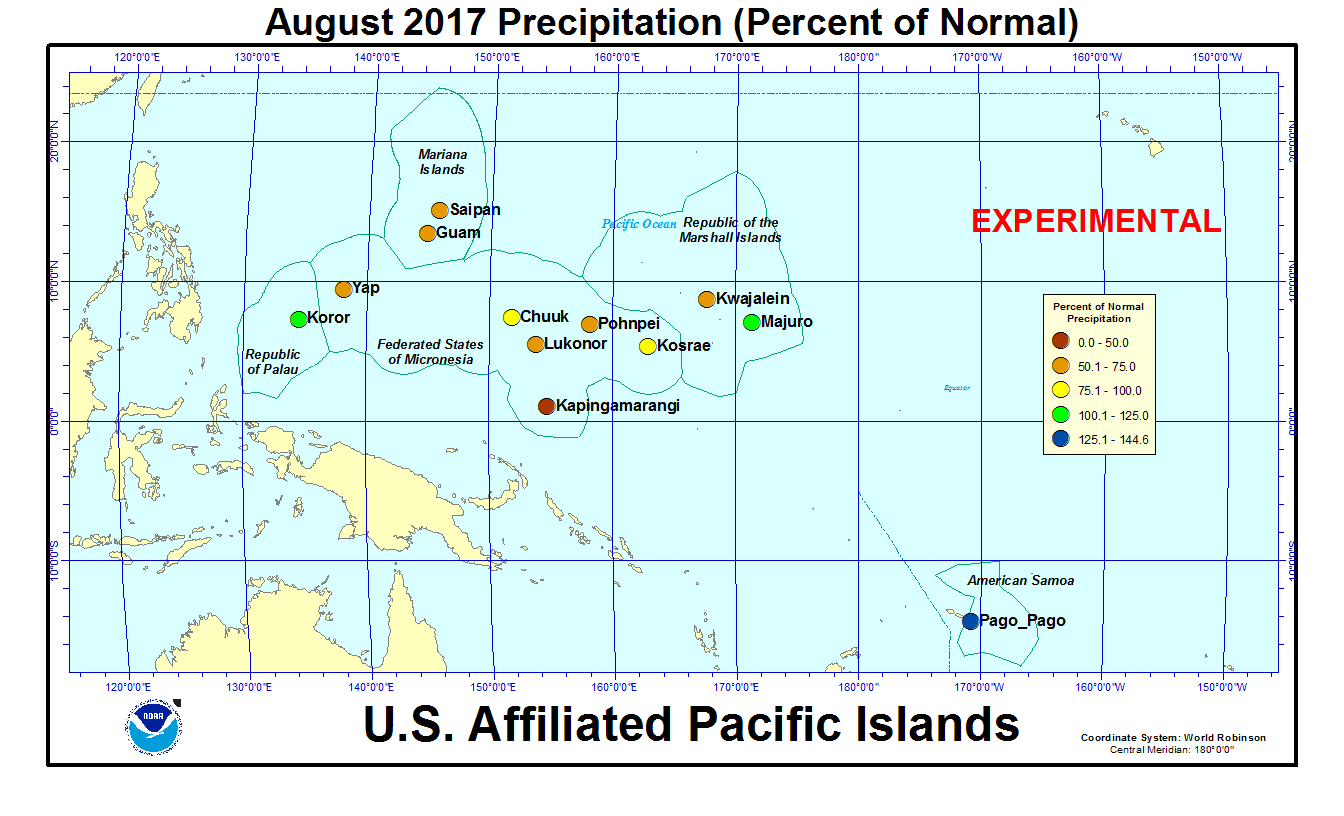
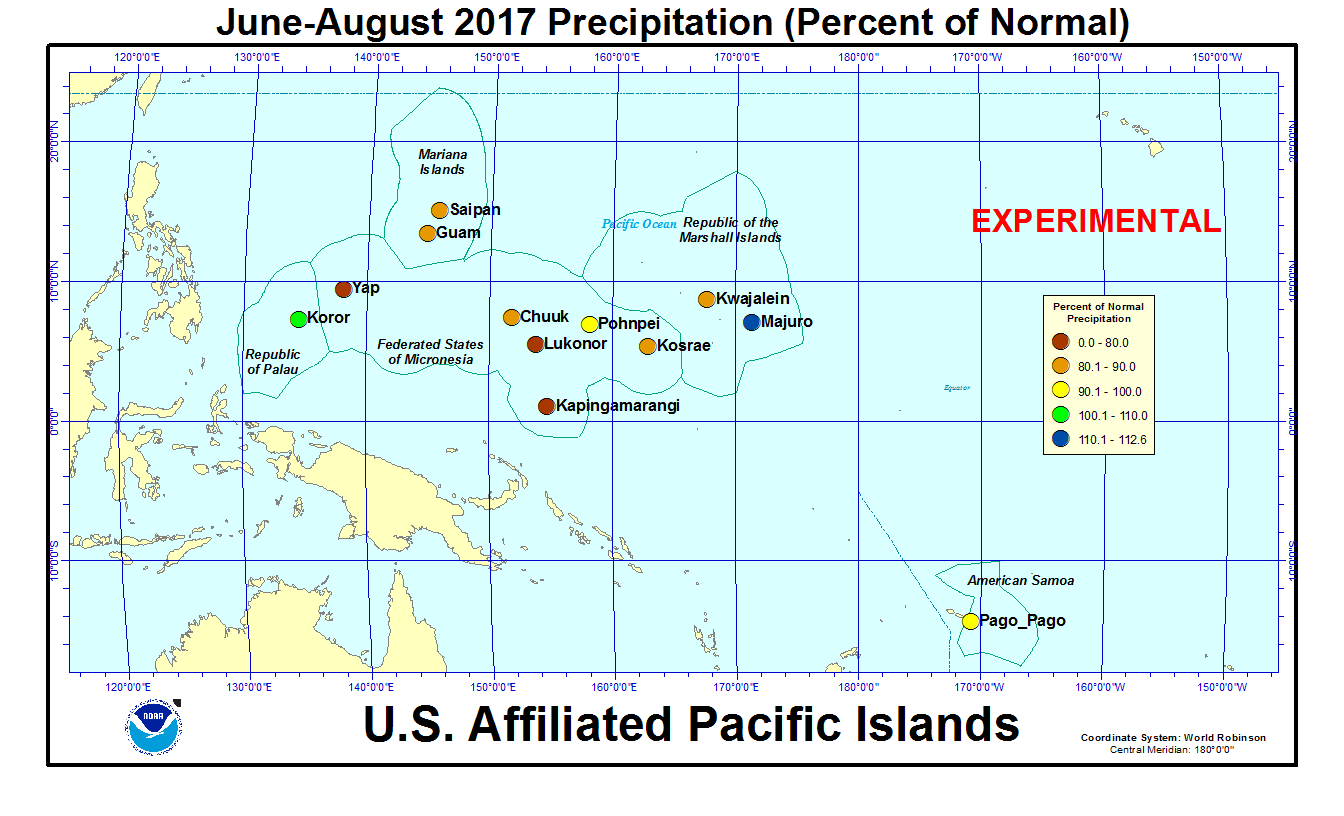
Pacific Islands: The NOAA National Weather Service (NWS) offices, the Pacific ENSO Applications Climate Center (PEAC), and partners provided reports on conditions across the Pacific Islands.
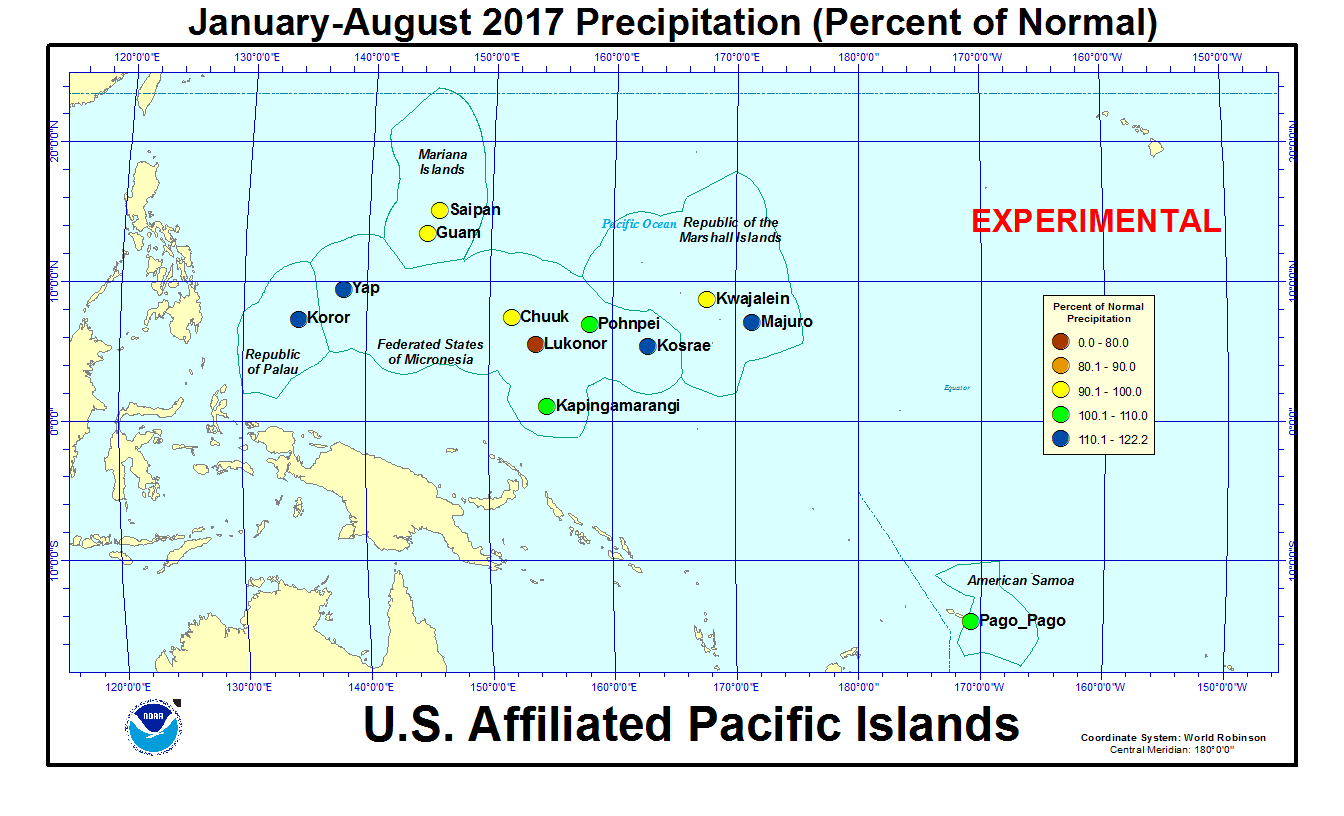
In the U.S. Affiliated Pacific Islands (USAPI) (maps — Federated States of Micronesia, Northern Mariana Islands, Marshall Islands, Republic of Palau, American Samoa, basinwide), August 2017 was drier than normal at most of the stations in Micronesia (Yap, Chuuk, Pohnpei, Kosrae, Lukonor, Kapingamarangi, Kwajalein, Guam, and Saipan) and wetter than normal at Koror, Majuro, and Pago Pago.
Rainfall amounts were below the minimum thresholds (4 or 8 inches) required to meet most monthly water needs at Kapingamarangi, Pingelap, Pohnpei, and Woleai (in the Federated States of Micronesia [FSM]); Ailinglapalap, Jaluit, Kwajalein, Utirik, and Wotje (in the Marshall Islands [RMI]); and Pago Pago (in American Samoa). August rainfall was above the monthly minimum thresholds at the rest of the regular reporting stations in Micronesia. The 4- and 8-inch thresholds are important because, if monthly precipitation falls below the threshold, then water shortages or drought become a concern.
Significant dryness has developed in the northern Marshall Islands since December 2016, with six of the last nine months having less than 2 inches each at Utirik (seven had less than 8 inches), and five of the last nine months having less than 2 inches each at Wotje (eight had less than 8 inches). Eight inches is the monthly minimum in the RMI. The last two months at Utirik were the driest July-August out of 12 years of data, the last three were the driest June-August out of 9 years of data, and the last four and five the driest May-August and April-August out of 7 years of data. The last four months were the second driest May-August out of 33 years of data for Ailinglapalap. The last three and four months were the driest June-August and May-August in 34 years of data at Jaluit, and the last five and six months were the second driest April-August and March-August. The National Weather Service office on Guam issued a revised Drought Information Statement on August 31 which noted that drought continues to be a serious concern for the northern Marshall Islands following an April 24th declaration of a state of emergency by the President of the RMI for the northern atolls and islands affected by the dry conditions.
Parts of the FSM were on the dry side of normal, although drought was not a concern there at this time. Ulithi had the driest June-August and third driest April-August in 35 years of data, Lukonor the third driest May-August in 21 years of data, Pingelap the second driest May-August in 33 years of data, Woleai the sixth driest May-August in 31 years of data, and Chuuk the fifth driest April-August in 66 years of data.
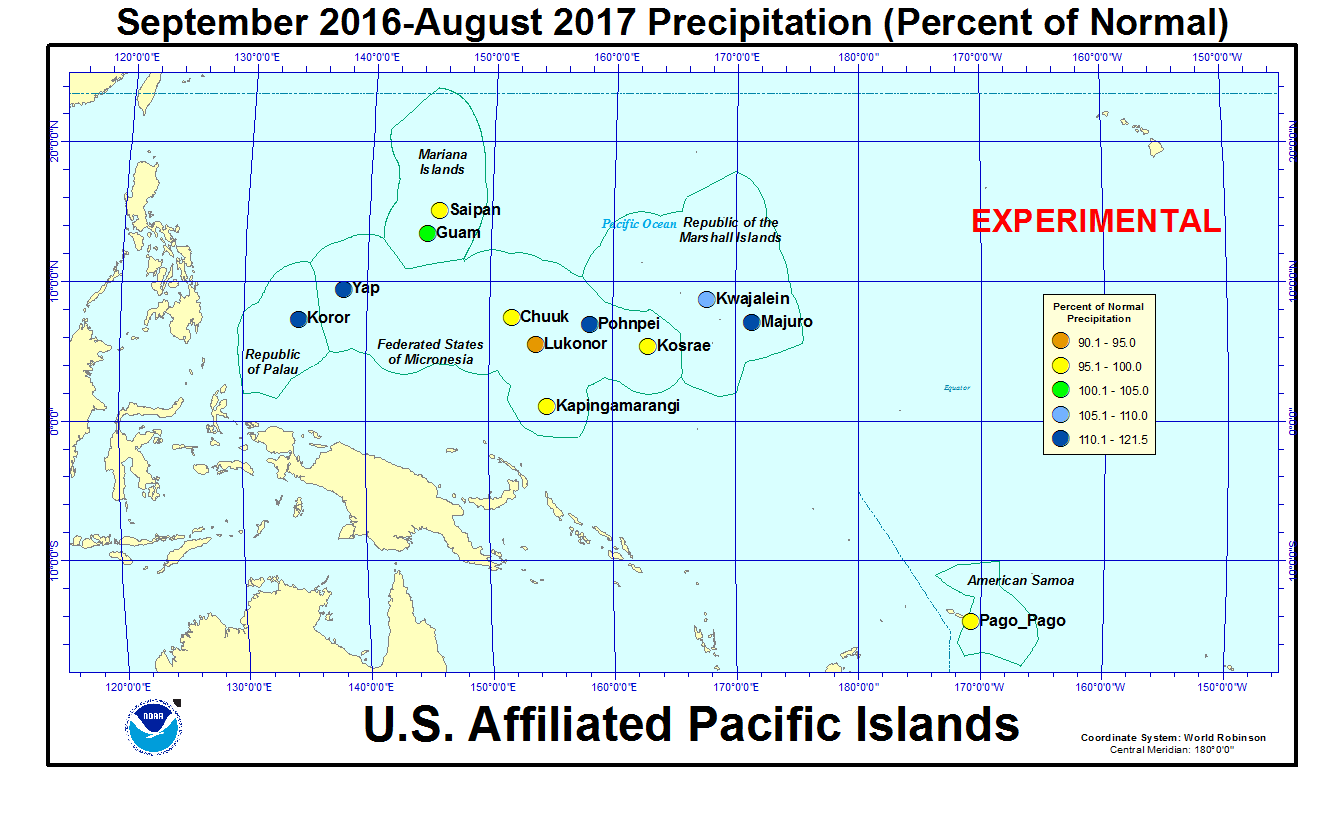
As measured by percent of normal precipitation, Chuuk, Lukonor, and Saipan have been drier than normal in the short term (August and the last 3 months [June-August]) as well as the long term (year to date [January-August] and last 12 months [September 2016-August 2017]). Yap has been drier than normal in the near term and wetter than normal in the long term. Guam and Kwajalein were drier in the near term and year to date, but near to wetter for the last 12 months. Kosrae and Kapingamarangi were wetter than normal for the year to date, but drier than normal at the other three time periods. Pohnpei was drier than normal for August, and Pago Pago was drier than normal for the last 12 months, but both were wetter than normal at the other three time periods. Koror and Majuro were near to wetter than normal at all four time periods.
| Station Name | Sep 2016 | Oct 2016 | Nov 2016 | Dec 2016 | Jan 2017 | Feb 2017 | Mar 2017 | Apr 2017 | May 2017 | Jun 2017 | Jul 2017 | Aug 2017 | Sep- Aug |
|---|---|---|---|---|---|---|---|---|---|---|---|---|---|
| Chuuk | 86% | 58% | 98% | 176% | 113% | 114% | 189% | 60% | 83% | 73% | 99% | 91% | 96% |
| Guam NAS | 124% | 115% | 137% | 170% | 155% | 167% | 256% | 340% | 56% | 136% | 97% | 66% | 104% |
| Kapingamarangi | 77% | 26% | 71% | 114% | 159% | 207% | 126% | 159% | 114% | 81% | 102% | 41% | 96% |
| Koror | 115% | 153% | 144% | 64% | 131% | 175% | 245% | 76% | 107% | 89% | 130% | 104% | 113% |
| Kosrae | 89% | 90% | 56% | 168% | 103% | 213% | 150% | 112% | 115% | 80% | 104% | 93% | 97% |
| Kwajalein | 64% | 168% | 126% | 156% | 285% | 212% | 46% | 65% | 77% | 156% | 70% | 64% | 109% |
| Lukonor | 120% | 74% | 198% | 128% | 138% | 66% | 160% | 85% | 80% | 60% | 103% | 63% | 90% |
| Majuro | 123% | 120% | 129% | 103% | 228% | 138% | 199% | 110% | 49% | 118% | 112% | 111% | 122% |
| Pago Pago | 83% | 55% | 127% | 111% | 72% | 153% | 52% | 87% | 240% | 93% | 84% | 145% | 95% |
| Pohnpei | 144% | 120% | 115% | 142% | 182% | 71% | 115% | 96% | 92% | 141% | 113% | 55% | 112% |
| Saipan | 191% | 48% | 79% | 95% | 182% | 199% | 108% | 115% | 66% | 128% | 72% | 65% | 98% |
| Yap | 66% | 164% | 156% | 101% | 198% | 370% | 205% | 110% | 69% | 68% | 121% | 55% | 115% |
| Station Name | Sep 2016 | Oct 2016 | Nov 2016 | Dec 2016 | Jan 2017 | Feb 2017 | Mar 2017 | Apr 2017 | May 2017 | Jun 2017 | Jul 2017 | Aug 2017 | Sep- Aug |
|---|---|---|---|---|---|---|---|---|---|---|---|---|---|
| Chuuk | 10.04" | 6.73" | 10.39" | 19.83" | 11.37" | 8.27" | 15.74" | 7.51" | 9.40" | 8.50" | 11.86" | 11.65" | 131.29" |
| Guam NAS | 15.65" | 13.14" | 10.13" | 8.68" | 6.22" | 5.06" | 5.30" | 8.60" | 1.89" | 8.40" | 9.86" | 9.73" | 102.66" |
| Kapingamarangi | 7.61" | 2.14" | 6.58" | 11.22" | 14.54" | 19.18" | 14.44" | 21.70" | 13.75" | 11.15" | 14.47" | 3.35" | 140.13" |
| Koror | 13.51" | 18.06" | 16.38" | 7.13" | 13.30" | 14.99" | 18.26" | 5.54" | 12.61" | 15.53" | 24.14" | 13.98" | 173.43" |
| Kosrae | 12.71" | 9.87" | 7.76" | 26.99" | 17.21" | 27.51" | 24.16" | 19.62" | 20.34" | 11.73" | 15.57" | 13.23" | 206.7" |
| Kwajalein | 6.90" | 18.73" | 14.16" | 10.36" | 9.00" | 5.60" | 1.07" | 3.44" | 5.20" | 10.80" | 6.91" | 6.28" | 98.45" |
| Lukonor | 12.23" | 8.41" | 18.02" | 14.42" | 11.58" | 5.90" | 14.83" | 9.61" | 9.41" | 6.97" | 16.47" | 8.88" | 136.73" |
| Majuro | 13.73" | 15.28" | 17.36" | 11.77" | 17.65" | 9.50" | 13.07" | 10.36" | 4.93" | 13.03" | 12.52" | 13.00" | 152.2" |
| Pago Pago | 5.45" | 5.12" | 12.86" | 14.24" | 9.57" | 18.32" | 5.60" | 8.14" | 23.23" | 4.94" | 4.66" | 7.78" | 119.91" |
| Pohnpei | 18.13" | 18.39" | 17.00" | 22.83" | 24.00" | 6.76" | 15.16" | 17.68" | 18.45" | 20.85" | 17.45" | 7.82" | 204.52" |
| Saipan | 19.31" | 5.07" | 4.42" | 3.67" | 4.61" | 5.15" | 2.04" | 3.02" | 1.58" | 4.63" | 6.45" | 8.59" | 68.54" |
| Yap | 8.89" | 20.00" | 13.78" | 8.59" | 12.67" | 19.19" | 9.35" | 6.19" | 5.40" | 8.16" | 18.27" | 8.20" | 138.69" |
| Station Name | Sep 2016 | Oct 2016 | Nov 2016 | Dec 2016 | Jan 2017 | Feb 2017 | Mar 2017 | Apr 2017 | May 2017 | Jun 2017 | Jul 2017 | Aug 2017 | Sep- Aug |
|---|---|---|---|---|---|---|---|---|---|---|---|---|---|
| Chuuk | 11.71" | 11.51" | 10.61" | 11.25" | 10.10" | 7.25" | 8.32" | 12.47" | 11.30" | 11.66" | 11.98" | 12.86" | 136.77" |
| Guam NAS | 12.66" | 11.44" | 7.38" | 5.11" | 4.01" | 3.03" | 2.07" | 2.53" | 3.40" | 6.18" | 10.14" | 14.74" | 99.09" |
| Kapingamarangi | 9.93" | 8.19" | 9.27" | 9.84" | 9.15" | 9.27" | 11.43" | 13.64" | 12.08" | 13.78" | 14.15" | 8.13" | 145.85" |
| Koror | 11.77" | 11.84" | 11.39" | 11.16" | 10.18" | 8.56" | 7.44" | 7.32" | 11.83" | 17.48" | 18.53" | 13.50" | 152.90" |
| Kosrae | 14.22" | 10.94" | 13.83" | 16.11" | 16.67" | 12.93" | 16.06" | 17.51" | 17.75" | 14.64" | 14.91" | 14.22" | 213.87" |
| Kwajalein | 10.74" | 11.18" | 11.28" | 6.66" | 3.16" | 2.64" | 2.35" | 5.26" | 6.72" | 6.93" | 9.87" | 9.74" | 90.41" |
| Lukonor | 10.15" | 11.32" | 9.08" | 11.27" | 8.41" | 8.93" | 9.26" | 11.31" | 11.69" | 11.65" | 15.93" | 14.04" | 151.36" |
| Majuro | 11.17" | 12.73" | 13.44" | 11.39" | 7.74" | 6.88" | 6.58" | 9.42" | 10.11" | 11.01" | 11.17" | 11.69" | 125.25" |
| Pago Pago | 6.53" | 9.26" | 10.14" | 12.84" | 13.34" | 12.00" | 10.68" | 9.39" | 9.66" | 5.33" | 5.55" | 5.38" | 125.57" |
| Pohnpei | 12.55" | 15.27" | 14.83" | 16.08" | 13.18" | 9.55" | 13.17" | 18.41" | 19.96" | 14.81" | 15.43" | 14.26" | 182.36" |
| Saipan | 10.09" | 10.62" | 5.61" | 3.85" | 2.53" | 2.59" | 1.89" | 2.63" | 2.38" | 3.62" | 8.91" | 13.13" | 70.25" |
| Yap | 13.50" | 12.18" | 8.83" | 8.51" | 6.39" | 5.19" | 4.56" | 5.63" | 7.85" | 12.04" | 15.08" | 14.82" | 120.31" |
An analysis of historical data for the USAPI stations in the Global Historical Climatology Network-Daily (GHCN-D) dataset, augmented with fill-in data from the 1981-2010 Normals, indicated that recent dryness developed at some stations and long-term wet conditions were evident at others. The following table lists the precipitation ranks for August 2017, April-August 2017 (last 5 months), and September 2016-August 2017 (the last 12 months). Some stations have a long period of record and their dataset is fairly complete, while other stations have a shorter period of record and the dataset has some missing data.
Rank of 1 = driest.
| Station | Aug 2017 Rank |
Aug No. of Years |
Apr- Aug 2017 Rank |
Apr- Aug No. of Years |
Sep 2016- Aug 2017 Rank |
Sep- Aug No. of Years |
Period of Record |
| Jaluit | 2 | 34 | 2 | 34 | 15 | 32 | 1981-2017 |
| Koror | 34 | 67 | 39 | 66 | 59 | 66 | 1951-2017 |
| Woleai | 4 | 36 | 7 | 31 | 11 | 23 | 1968-2017 |
| Yap | 6 | 67 | 15 | 66 | 50 | 66 | 1951-2017 |
| Majuro | 44 | 64 | 30 | 63 | 53 | 63 | 1954-2017 |
| Ulithi | 4 | 36 | 3 | 35 | MSG | 32 | 1981-2017 |
| Ailinglapalap | 7 | 33 | 4 | 33 | 21 | 31 | 1981-2017 |
| Kosrae | 24 | 49 | 15 | 40 | 17 | 29 | 1954-2017 |
| Lukonor | 4 | 21 | 4 | 21 | 10 | 20 | 1981-2017 |
| Saipan | 10 | 37 | 9 | 37 | 11 | 28 | 1981-2017 |
| Pohnpei | 3 | 67 | 29 | 66 | 50 | 66 | 1951-2017 |
| Kwajalein | 10 | 66 | 13 | 65 | 29 | 65 | 1952-2017 |
| Kapingamarangi | 4 | 27 | 13 | 20 | 8 | 15 | 1962-2017 |
| Chuuk | 23 | 67 | 5 | 66 | 19 | 66 | 1951-2017 |
| Guam | 16 | 61 | 25 | 61 | 36 | 60 | 1957-2017 |
| Nukuoro | 6 | 34 | 26 | 33 | 28 | 32 | 1981-2017 |
| Pago Pago | 37 | 52 | 32 | 52 | 20 | 51 | 1966-2017 |
| Wotje | 3 | 34 | 15 | 34 | 13 | 31 | 1981-2017 |
| Utirik | 3 | 14 | 1 | 7 | MSG | 2 | 1985-2017 |


![Evaporative Stress Index [ESI]](/monitoring-content/sotc/drought/2017/08/ESI-20170831_04Week.png)
![Vegetation Drought Response Index [VegDRI]](/monitoring-content/sotc/drought/2017/08/VegDRI_eMODIS_wk35_Aug272017.png)
![Quick Drought Response Index [QuickDRI]](/monitoring-content/sotc/drought/2017/08/qdri_20170827_conus_text.png)
[top]
State/Regional/National Moisture Status
A detailed review of drought and moisture conditions is available for all contiguous U.S. states, the nine standard regions, and the nation (contiguous U.S.):
| northeast u. s. | east north central u. s. | central u. s. |
| southeast u. s. | west north central u. s. | south u. s. |
| southwest u. s. | northwest u. s. | west u. s. |
| Contiguous United States |
[top]
Contacts & Questions