|
Contents Of This Report: |


|
Please note that the values presented in this report are based on preliminary data. They will change when the final data are processed, but will not be replaced on these pages.
National Drought Overview
|
|
[top]
Detailed Drought Discussion
Overview
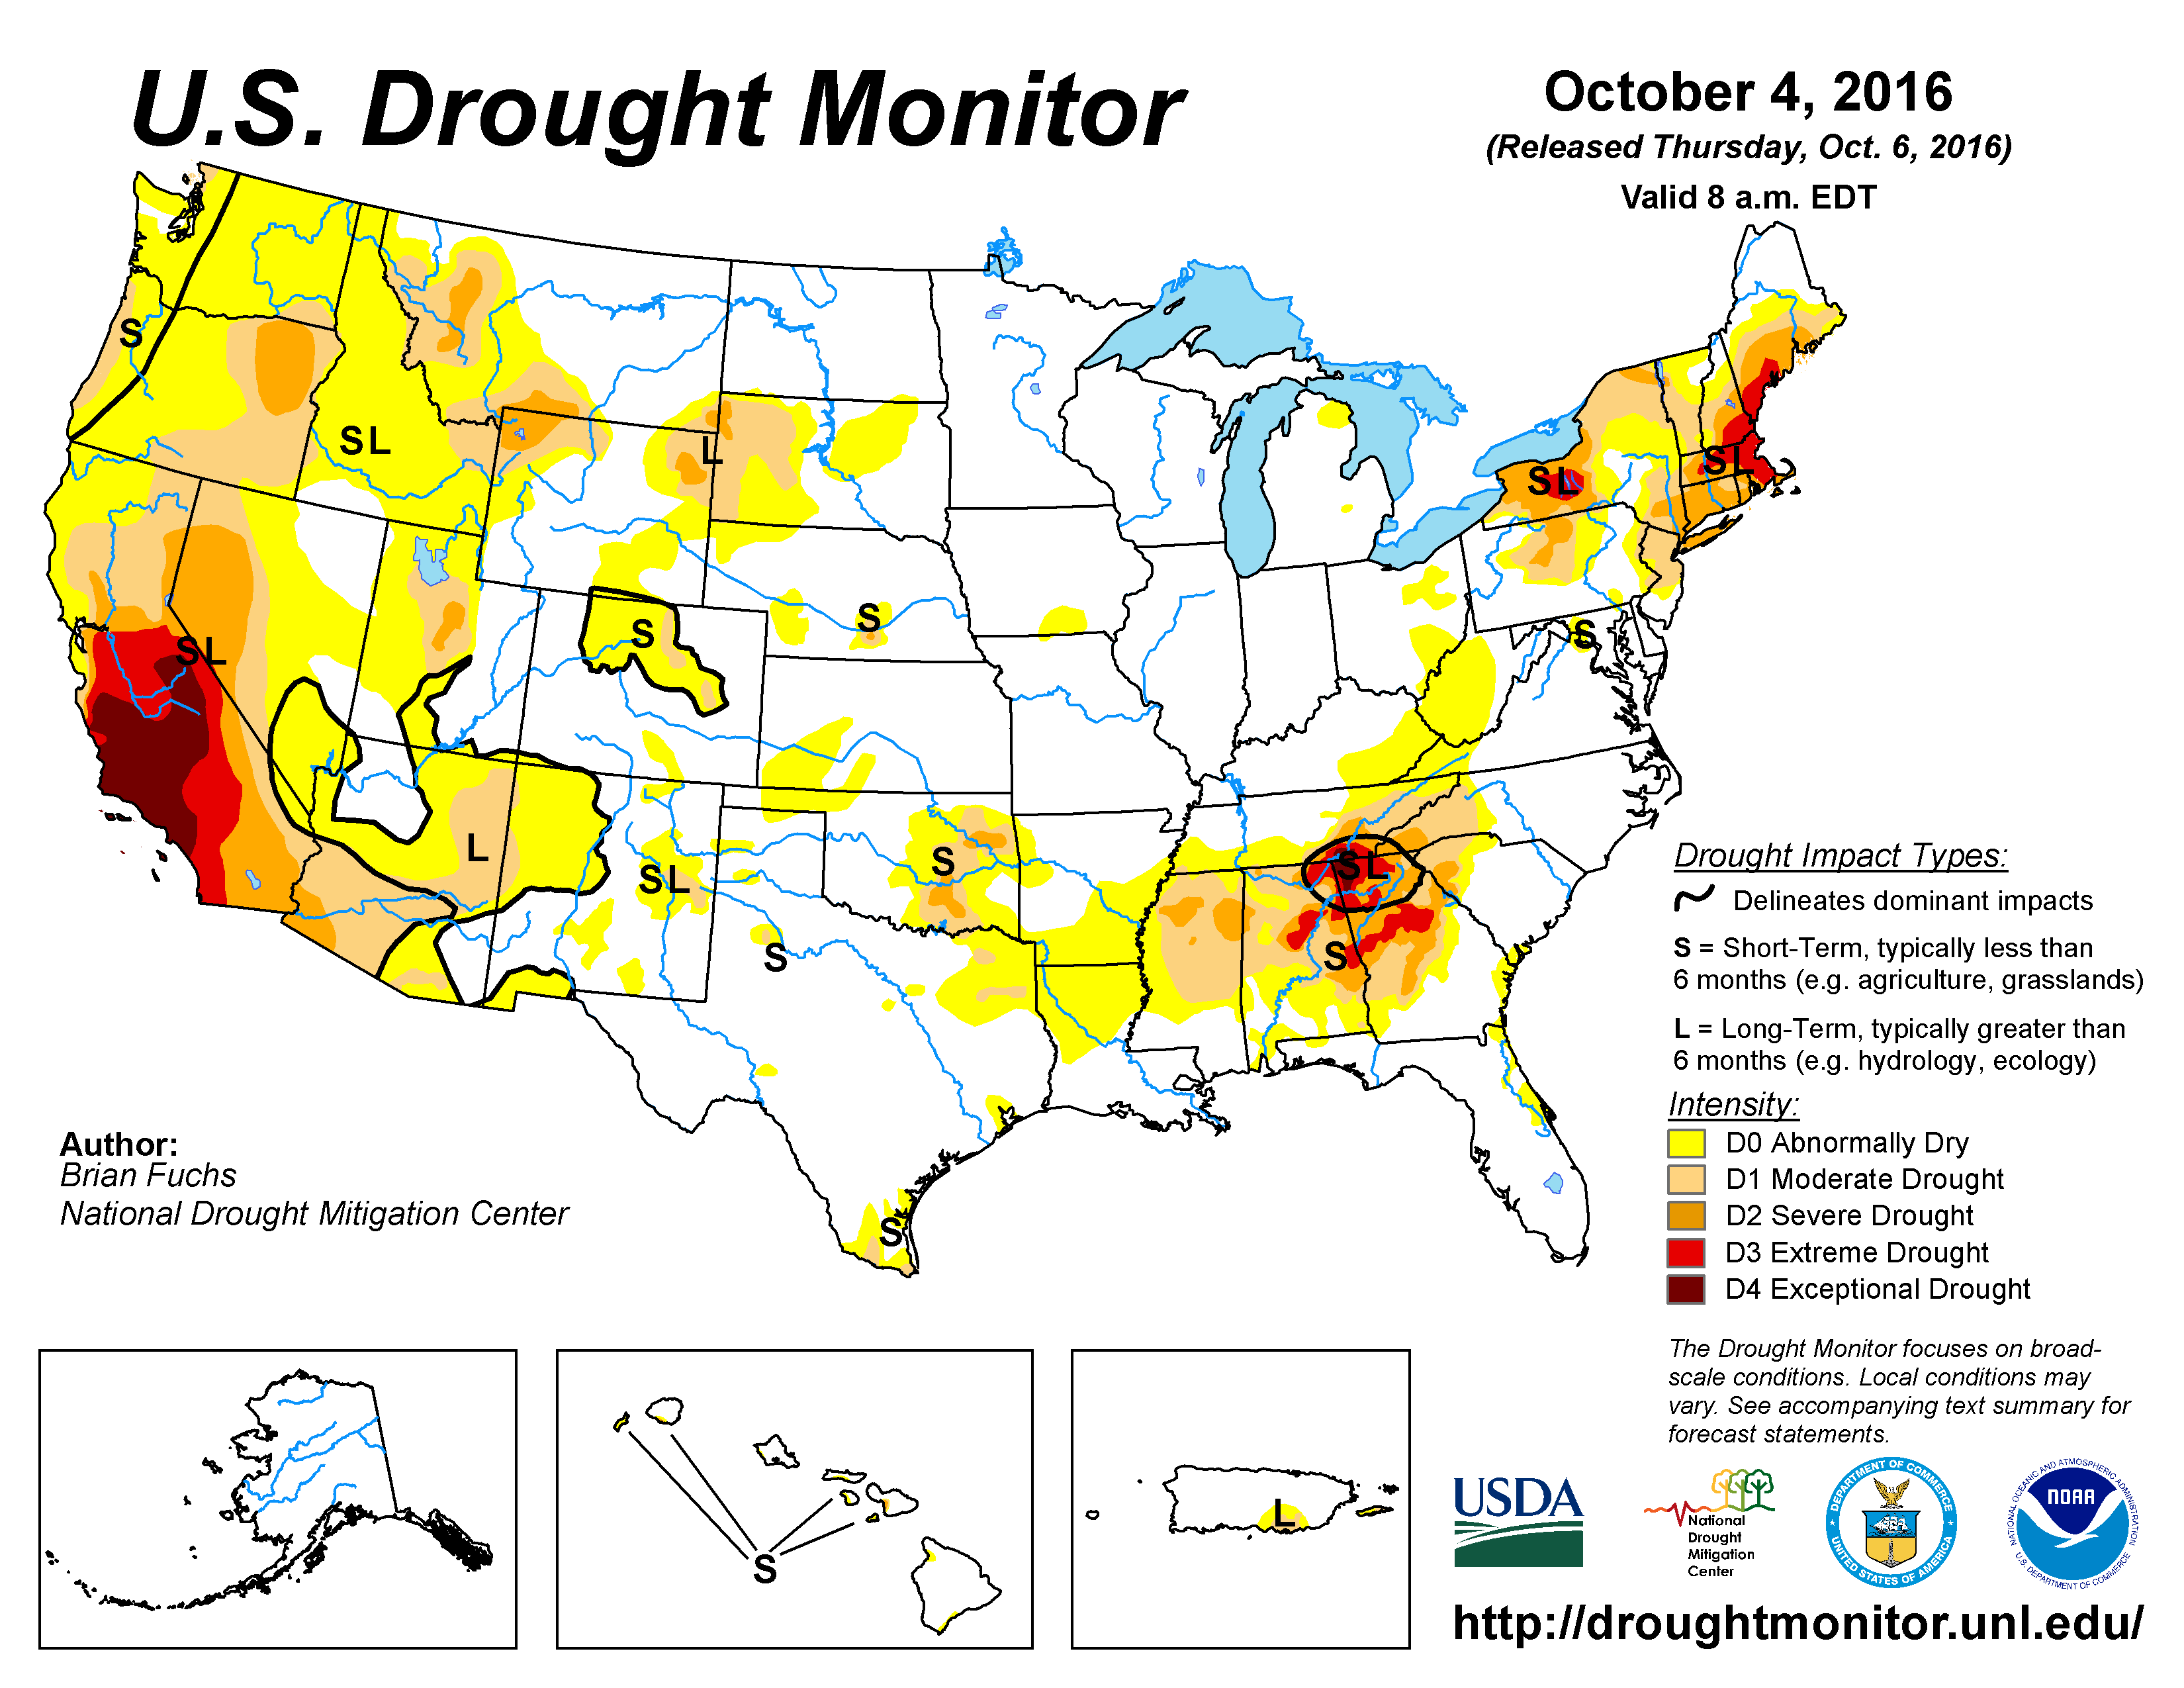
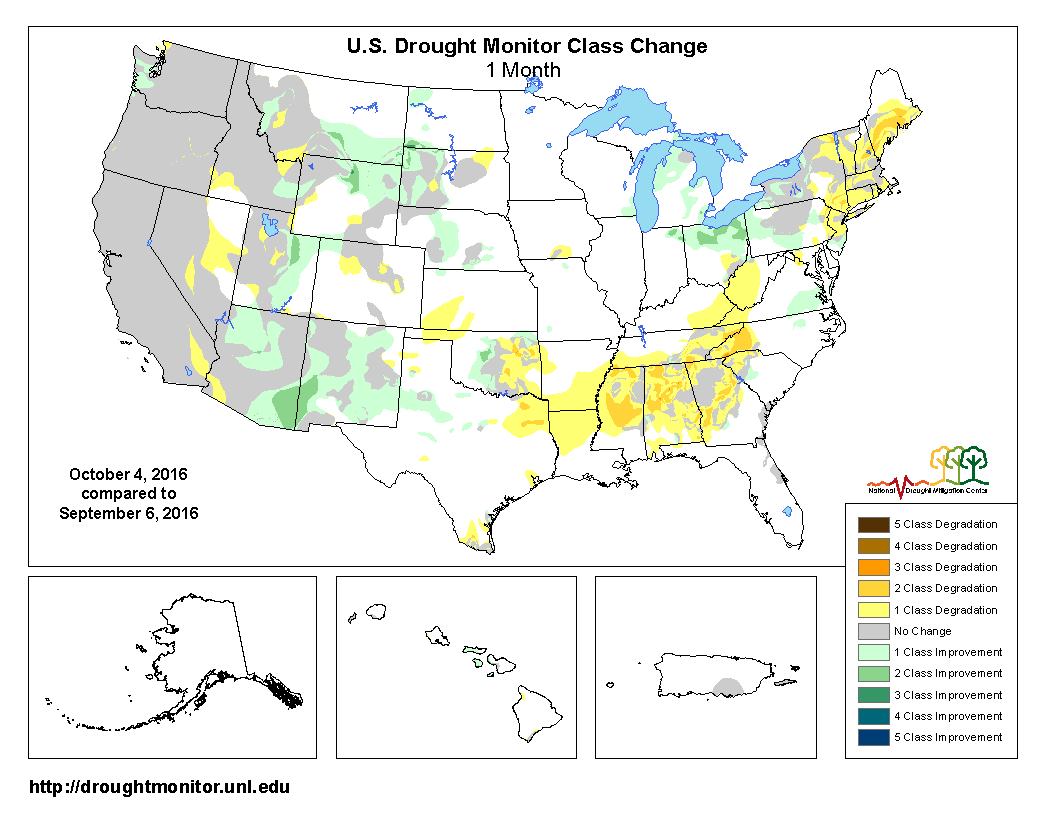
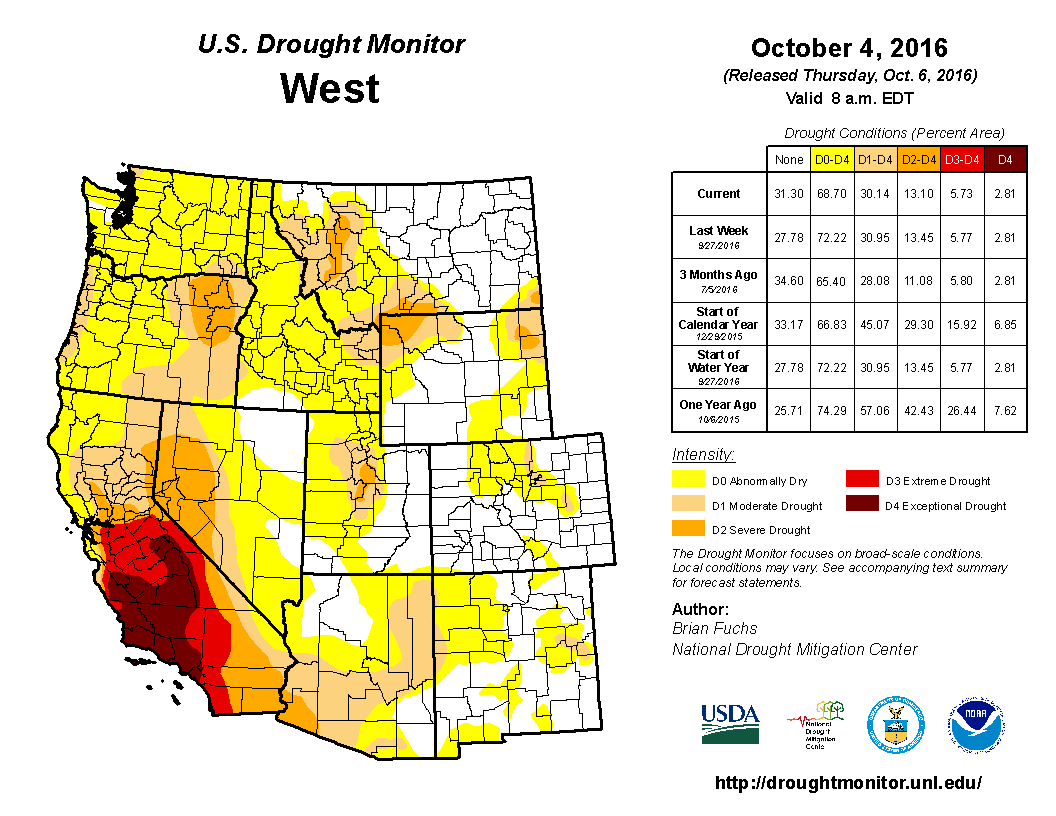
The U.S. Drought Monitor drought map valid October 4, 2016.
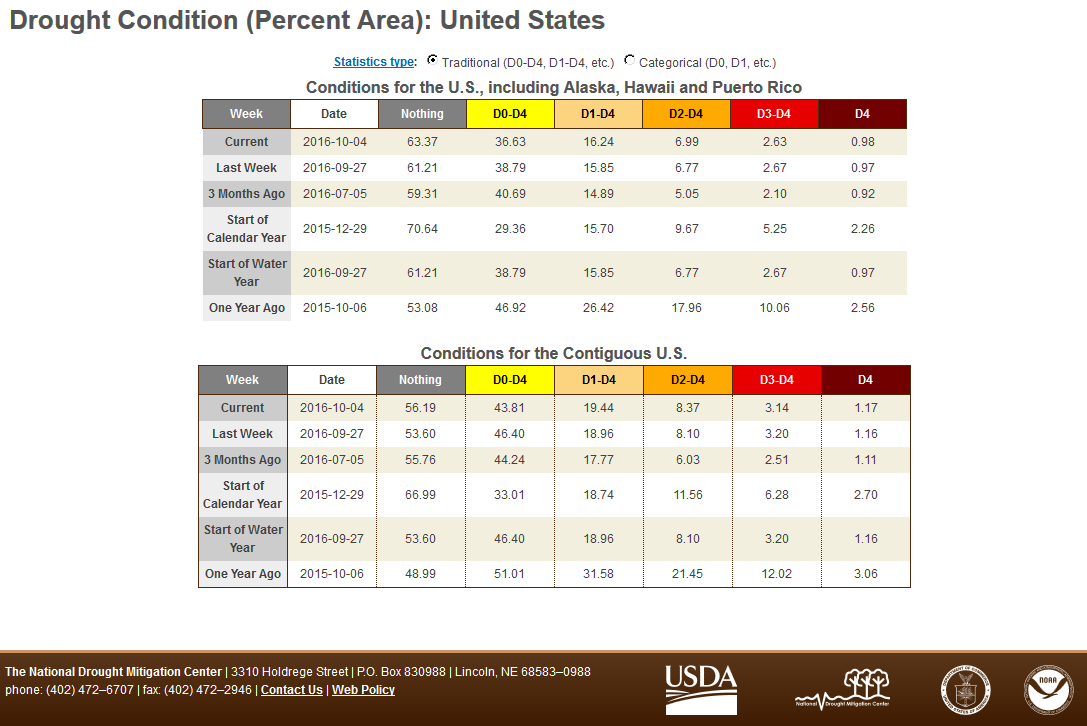
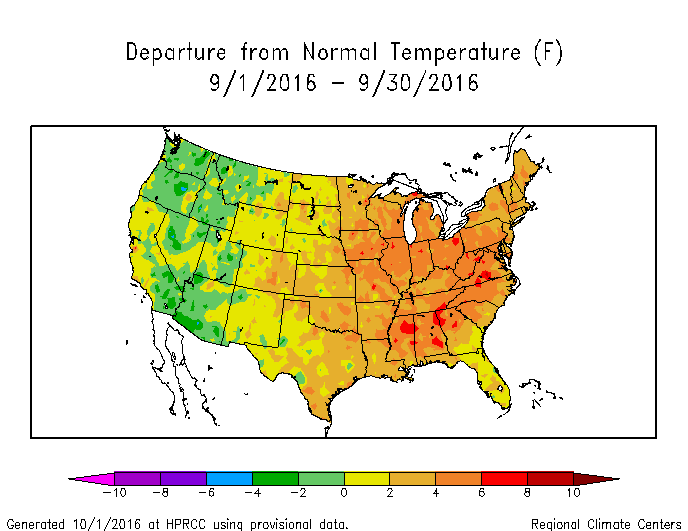
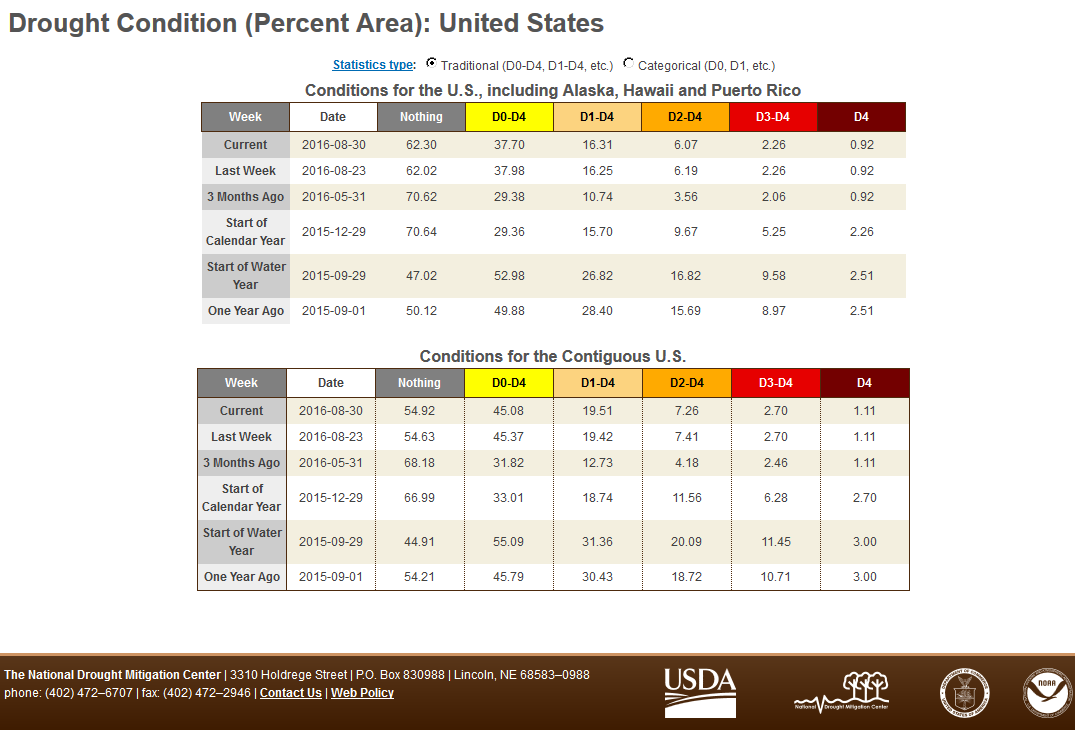
During September 2016, the influence of the warm and dry North Pacific and North Atlantic (Bermuda) subtropical highs was challenged by cooler and wetter troughs and lows in the jet stream flow. The Bermuda High, along with persistent upper-level ridging at the jet stream level, resulted in above-normal temperatures across the CONUS east of the Rockies, while troughs were dominant over western North America, bringing cooler-than-normal air over the West. As they migrated across the CONUS, the troughs dragged cold fronts and surface lows along with them which provided a lifting mechanism that produced areas of precipitation. The monthly precipitation pattern was also affected by tropical moisture dropped by hurricanes and tropical storms along the East Coast, or that was entrained into the Southwest monsoon. The end result was a monthly precipitation pattern that was drier than normal across the Far West, Central Rockies to High Plains, Lower Mississippi Valley to Central Appalachians, and much of the Northeast, and wetter than normal from the interior West to Northern Plains, Southern High Plains to Upper Midwest, and along the coast from Florida to the Mid-Atlantic states. The unusually warmer than normal temperatures in the eastern U.S. enhanced evapotranspiration which exacerbated conditions, especially where it was unusually dry. When precipitation is integrated across the CONUS, September 2016 ranked as the 40th wettest September in the 1895-2016 record. This month's precipitation anomaly pattern resulted in expansion of drought in the South and New England and contraction in parts of the West and Midwest. September was wetter than normal over much of Alaska, which wasn't suffering from drought or abnormal dryness, and Hawaii, where drought conditions improved, and parts of Puerto Rico, where drought also shrank. Drought contraction and expansion roughly balanced each other out, so the USDM-based national moderate-to-exceptional drought footprint decreased only slightly across the CONUS from 19.5 percent at the end of August to 19.4 percent at the end of September (from 16.3 percent to 16.2 percent for all of the U.S.). According to the Palmer Drought Index, which goes back to the beginning of the 20th century, about 21.6 percent of the CONUS was in moderate to extreme drought at the end of September, about the same as last month.
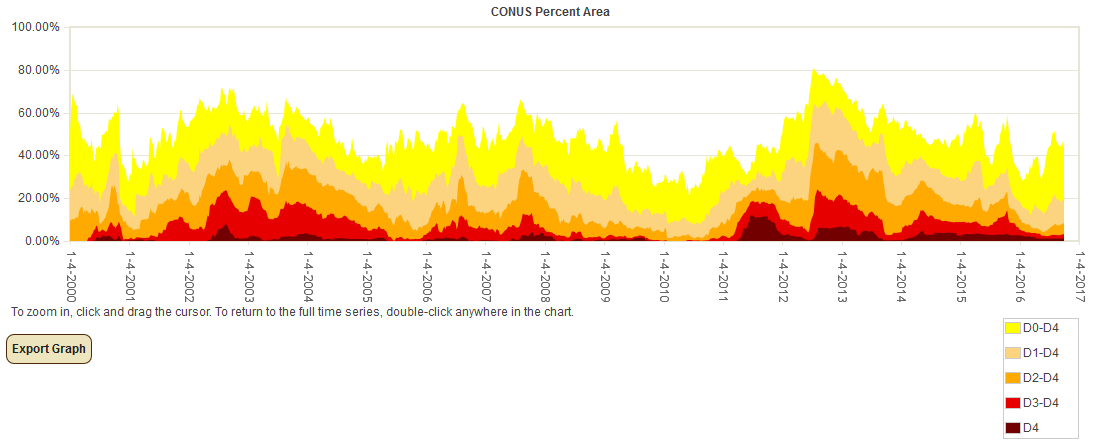
Percent area of the CONUS in moderate to exceptional drought, January 4, 2000 to present, based on the U.S. Drought Monitor.
Palmer Drought Index
The Palmer drought indices measure the balance between moisture demand (evapotranspiration driven by temperature) and moisture supply (precipitation). The Palmer Z Index depicts moisture conditions for the current month, while the Palmer Hydrological Drought Index (PHDI) and Palmer Drought Severity Index (PDSI) depict the current month's cumulative moisture conditions integrated over the last several months. While both the PDSI and PHDI indices show long-term moisture conditions, the PDSI depicts meteorological drought while the PHDI depicts hydrological drought. The PDSI map shows less severe and extensive drought in parts of the West than the PHDI map because the meteorological conditions that produce drought and wet spell conditions are not as long-lasting as the hydrological impacts.
|
 |
Used together, the Palmer Z Index and PHDI maps show that short-term dry conditions occurred across parts of the West and much of the Deep South and Northeast. This short-term dryness expanded or intensified long-term dry conditions in September compared to August in the South and Northeast, and reduced the intensity of long-term wet conditions in the Lower Mississippi Valley and eastern Texas. Short-term wet conditions reduced long-term drought conditions in the Northern Rockies and expanded or intensified long-term wet conditions in the Upper Midwest.
Standardized Precipitation Index
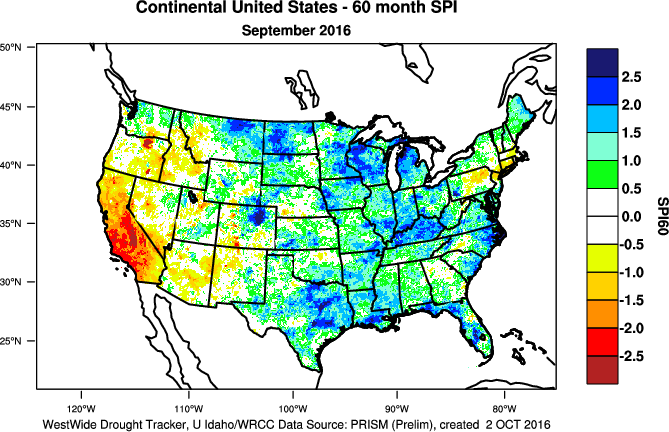
The Standardized Precipitation Index (SPI) measures moisture supply. The SPI maps here show the spatial extent of anomalously wet and dry areas at time scales ranging from 1 month to 24 months.
 |
 |
 |
The SPI maps illustrate how moisture conditions have varied considerably through time and space over the last two years. Dryness dominates much of the Far West for the last 1 to 6 months, parts of the Rocky Mountains at the 6- to 24-month time scales, and parts of the Central Rockies to Central High Plains at the 1 to 3-month time scales. The long-term dryness in California is evident in Southern California at the 12- to 24-month time scales. Dry conditions dominate much of the Northeast at all time scales, the Southeast to Lower Mississippi Valley for September, and much of the Southeast for the last 1 to 9 months. Wet conditions dominate much of the West for the last 1 to 2 months and are evident in parts of the West at the 3- to 24-month time scales. It has been predominantly wet in the Northern Plains to Upper Midwest, and along parts of the Mid-Atlantic Coast, at all time scales, and from the Plains to Ohio Valley for the last 2 to 24 months.
 |
 |
 |
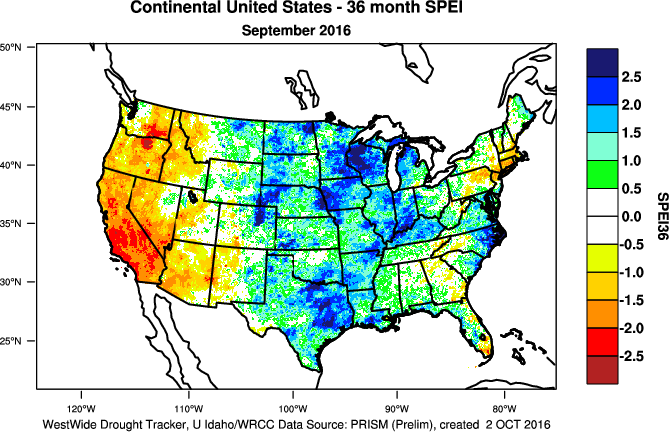
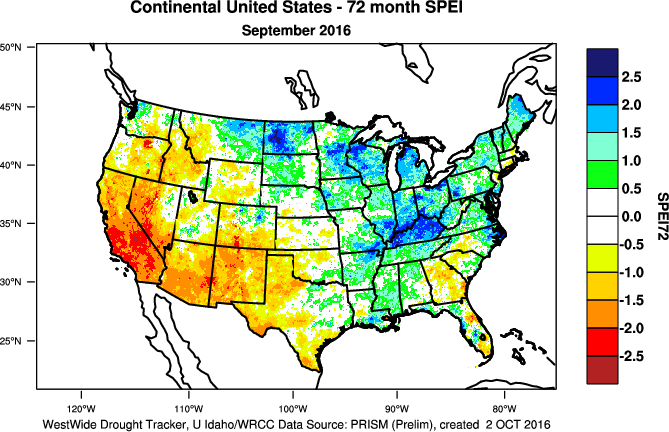
Standardized Precipitation Evapotranspiration Index
The SPI measures water supply (precipitation), while the SPEI (Standardized Precipitation Evapotranspiration Index) measures the combination of water supply (precipitation) and water demand (evapotranspiration as computed from temperature). Warmer temperatures tend to increase evapotranspiration, which generally makes droughts more intense.
 1-month SPEI for current month.
|
 1-month SPI for current month.
|
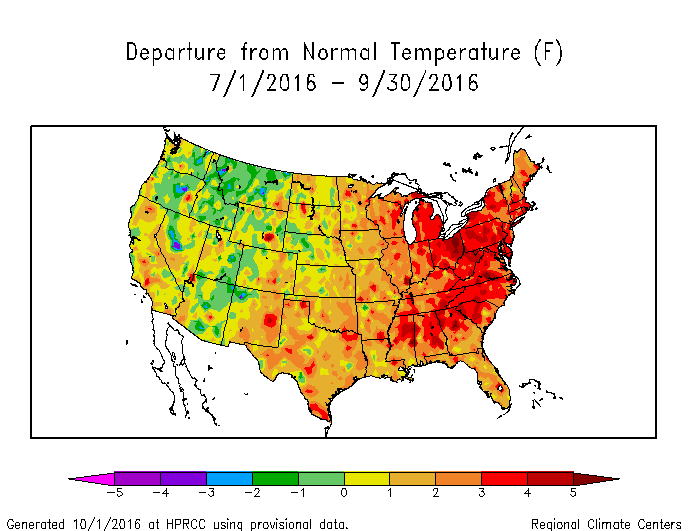
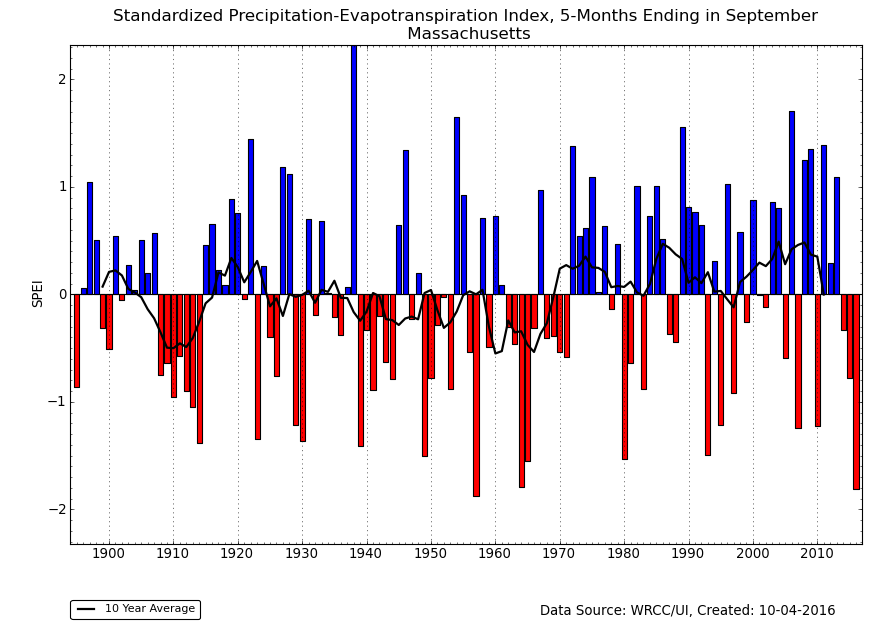
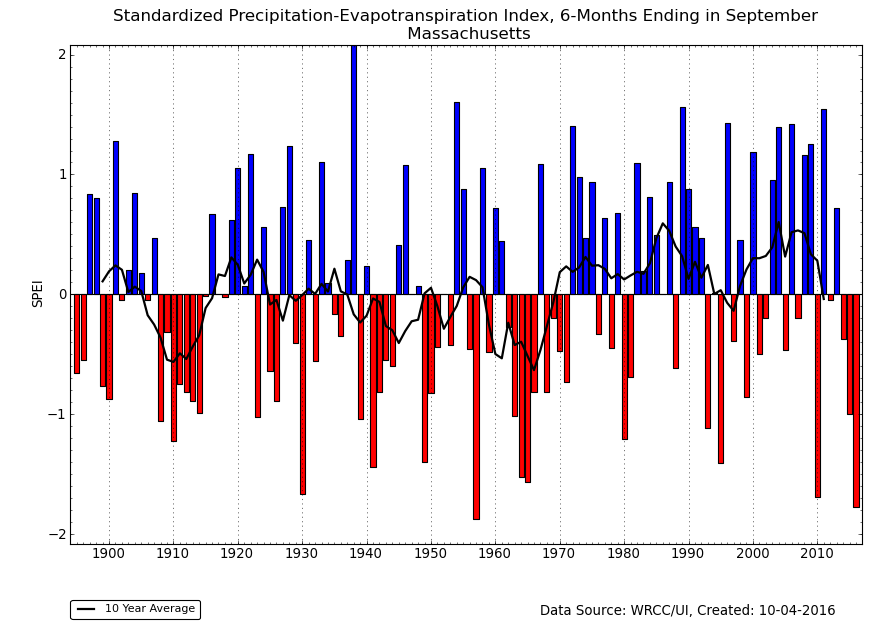
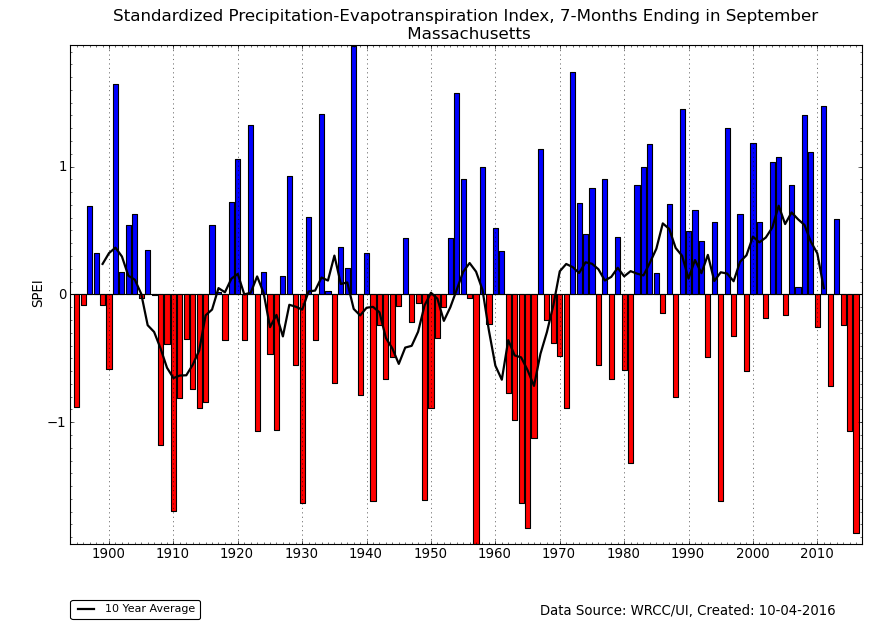
Temperatures were much warmer than normal across the States east of the Mississippi River during September. The combination of these unusually warm temperatures and the lack of precipitation resulted in the 1-month SPEI map showing more severe drought conditions than the 1-month SPI map in the South to Northeast. When the heat and dryness of the last three months is examined, the 3-month (July-September) SPEI map shows more severe drought conditions than the SPI map in the Southeast and Northeast and also in parts of the West. Warmer-than-average temperature anomalies for the last six months in the West and East contributed to more severe drought on the 6-month SPEI map compared to the SPI map, especially in the West, Southeast, and Northeast where precipitation was below normal. The fifth driest and fifth warmest April-September in the 1895-2016 record gave Massachusetts the second most severe SPEI for the last 4, 5, 6, and 7 months. The last two decades have seen a marked warming trend in April-September temperature in Massachusetts. Widespread warm temperature anomalies for the last 12 months resulted in more severe drought in the areas with below-normal precipitation on the September 2016 12-month SPEI map compared to the SPI map, mainly parts of the West and Northeast. Differences in the SPEI and SPI are even noticeable at the 24-month time scale in the Northeast.

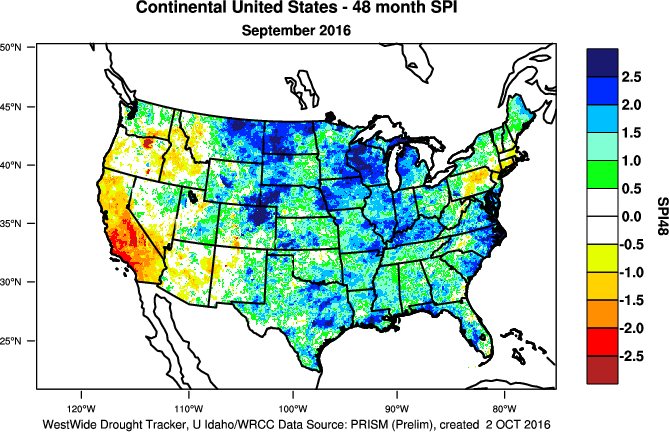
Significant differences between the SPEI and SPI maps begin to appear in the West at the 24-month time frame (SPEI vs. SPI) and become increasingly significant at the 36-month (SPEI vs. SPI), 48-month (SPEI vs. SPI), 60-month (SPEI vs. SPI), and even 72-month (SPEI vs. SPI) time scales. This is due to persistent above-normal temperatures in the West for the last several years which have increased evapotranspiration and exacerbated drought conditions. Thirteen of the last 17 years (October-September periods) rank in the top 20 warmest category, with last year (October 2014-September 2015) being the warmest. Even with widespread cooler-than-normal temperatures across the West in August and September 2016, the October 2015-September 2016 12-month temperature still ranked as the fourth warmest on record.
 |
 |
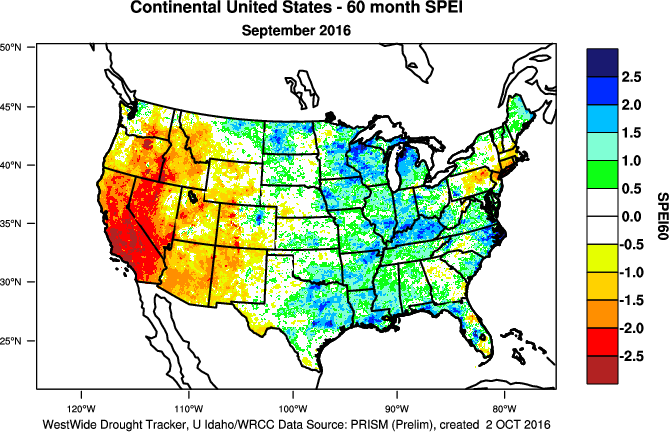 |
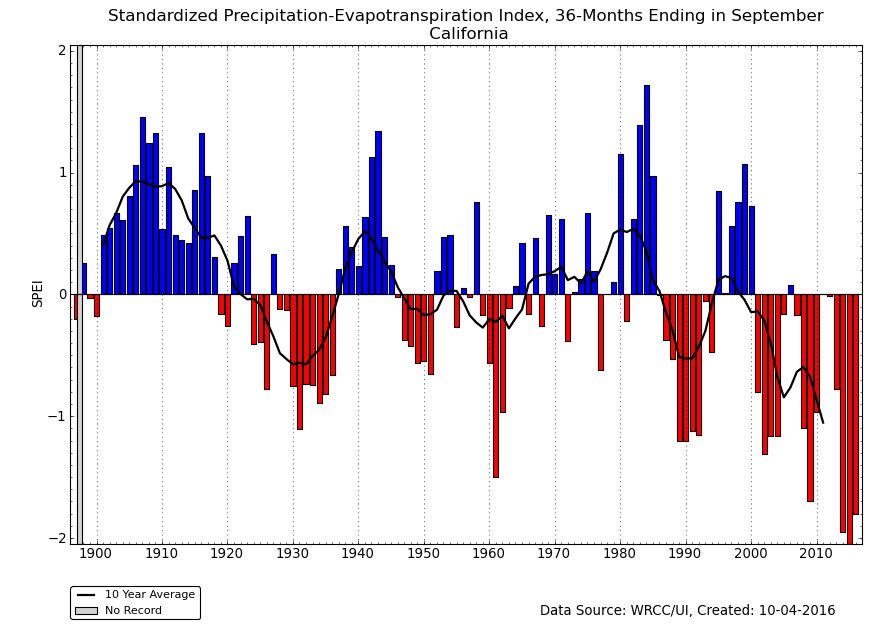
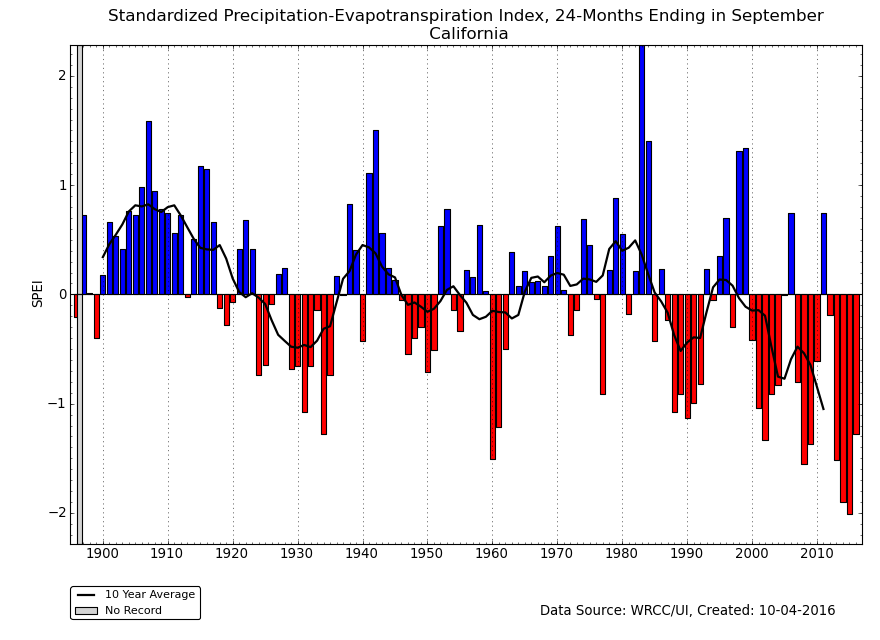
This is especially the case in California, where the last four October-September 12-month periods ranked in the top nine warmest such periods for the state in the 1895-2016 record. The last four years cap a period of persistent unusual warmth which has lasted over three decades. The precipitation for the last 12 months gave California a statewide precipitation rank of 51st wettest (71st driest) for October 2015-September 2016. But the persistent dryness since 2000 still gave the state the driest SPI for the last 60 months and fifth driest for the last 48 months. When the temperature is factored in, California has had the most severe SPEI on record for the last 60 and 72 months, second most severe SPEI for the last 48 months, and third most severe SPEI for the last 36 months. Even the last 24 months ranked as the eighth driest, in spite of precipitation in the recent 12 months. Nearby Nevada had the second most severe SPEI for the last 60 months.
 California statewide temperature, October-September, 1895-2016.
|
 California statewide 60-month SPEI for September, 1895-2016.
|
Regional Discussion
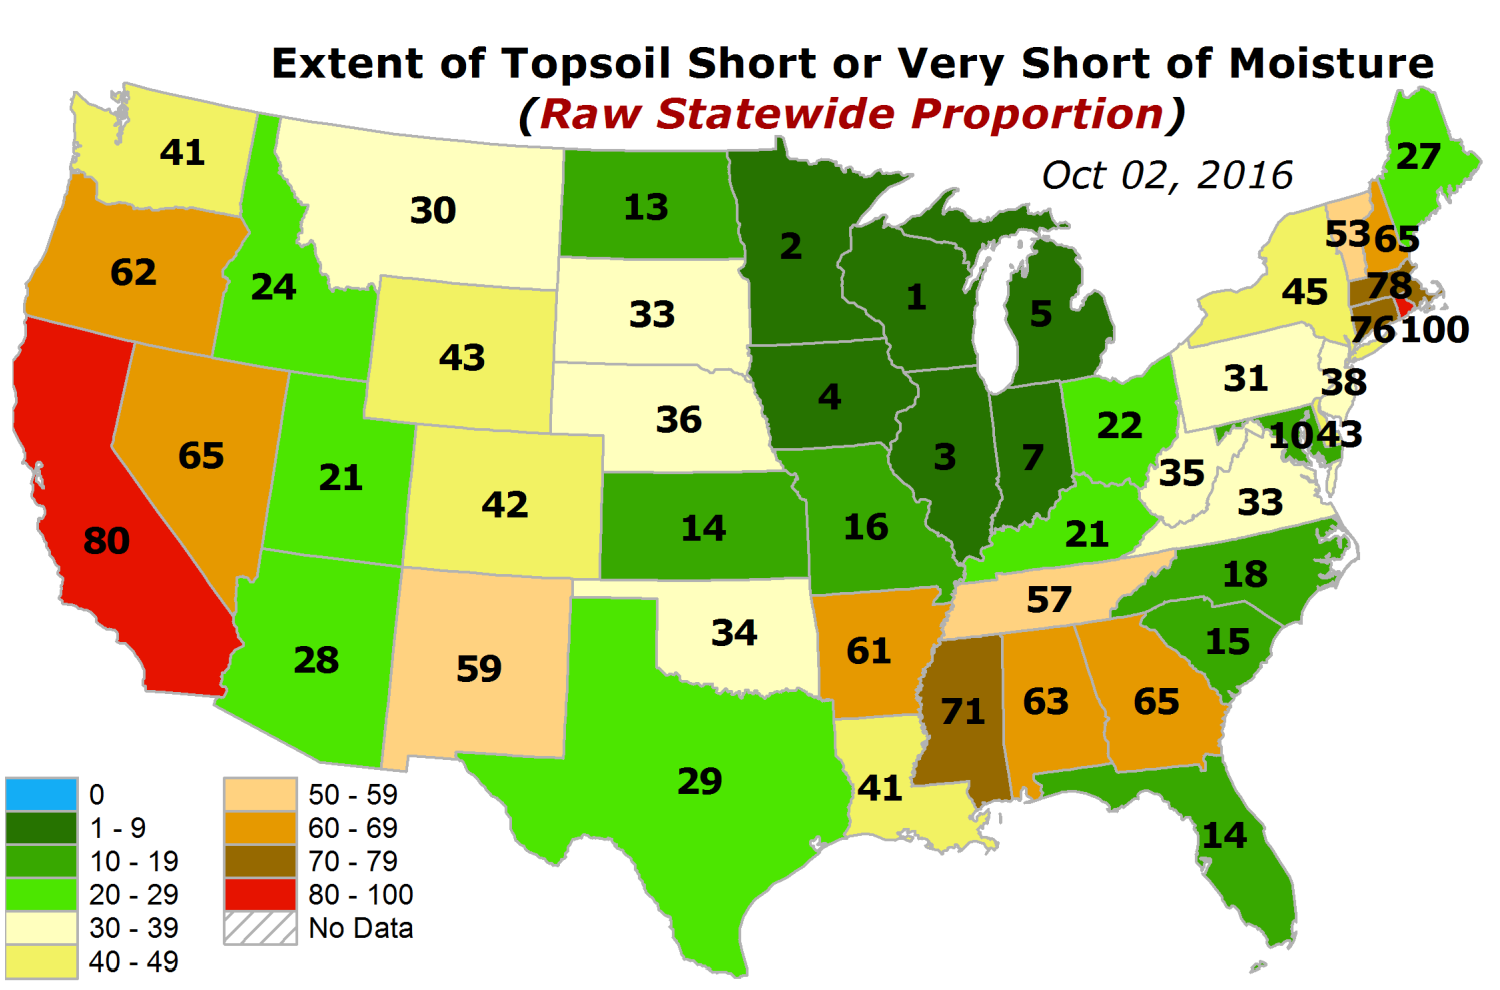 USDA topsoil and subsoil short and very short of moisture.
|
 West Statewide reservoirs status.
|
CONUS Agricultural & Hydrological Impacts:
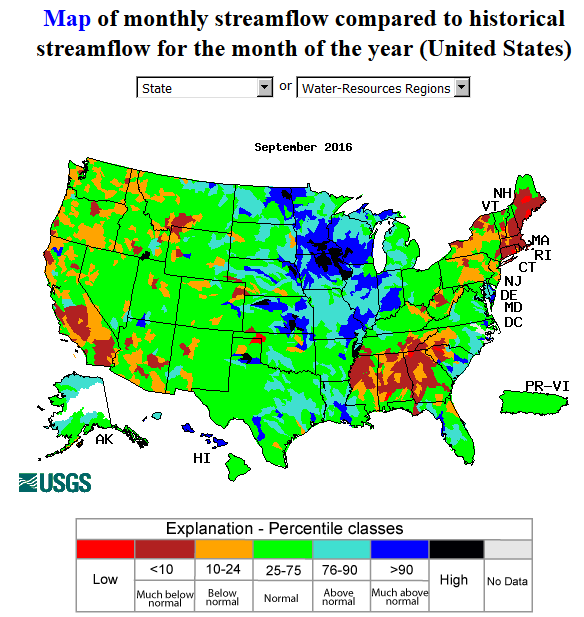
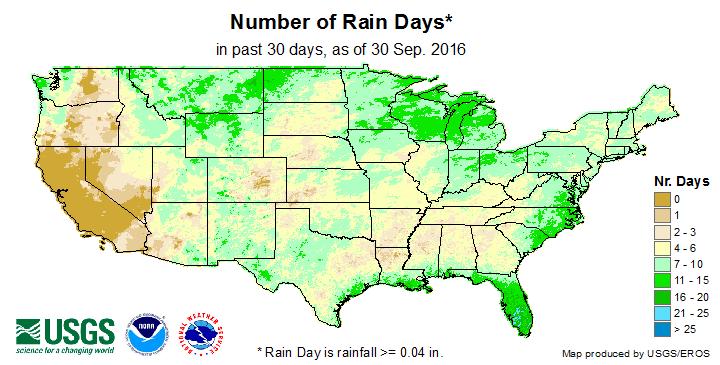
The dry and hot weather of September exacerbated drought conditions in the East, while long-term drought continued in the West. This is reflected in numerous agricultural, hydrological, and other meteorological indicators, both observed and modeled. The dry weather, with increased evapotranspiration, dried soils (USDA observations, SMOS satellite-based model, Leaky Bucket model, CPC model, NLDAS model, VIC model) and stressed vegetation (VegDRI and the NOAA satellite-based VHI, stressed vegetation index, and drought risk index) (Crop Moisture Index [CMI] for weeks 1, 2, 3, 4, and 5). Where the dry conditions have been continuing for several months, hydrological conditions such as streamflow and groundwater supplies were reduced, as well as reservoir levels in the West. The dry conditions during September are reflected in number of rain days and number of consecutive dry days as well as total precipitation. On a national scale, as of September 27th, 14 percent of the nation's cattle inventory, 15 percent of the nation's hay, 8 percent of winter wheat production, and 2 percent of corn and soybean production were in drought. These percentages are within a percent or two of the values for the end of August. According to October 3rd U.S. Department of Agriculture (USDA) reports, only 8 percent of the nation's corn crop and 7 percent of soybeans were rated in poor to very poor condition, but 15 percent of the cotton crop and 18 percent of the pasture and rangeland were so rated, which are about the same as at the end of August. And 25 percent of the nation's topsoil moisture and 25 percent of the subsoil moisture were rated short to very short (dry to very dry), both also about the same as last month. On a regional basis, conditions varied and were more extreme.
Drought conditions at the end of the month, as depicted on the October 4th USDM map, included the following CONUS core drought and abnormally dry areas:
- Abnormally dry to moderate (D1) drought conditions covered a large part of the western U.S., with pockets of severe (D2) and severe to extreme (D3) drought occurring in the northern portions of the West, and severe to exceptional (D4) drought lingering in California. —
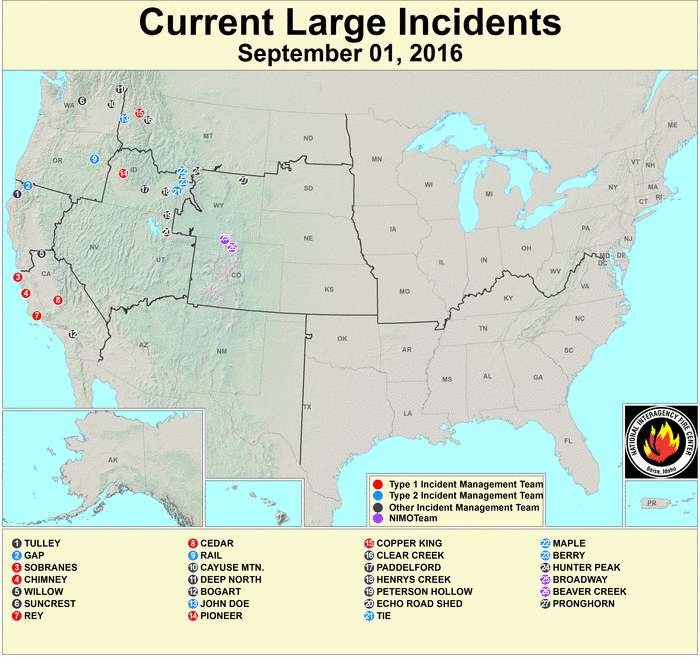
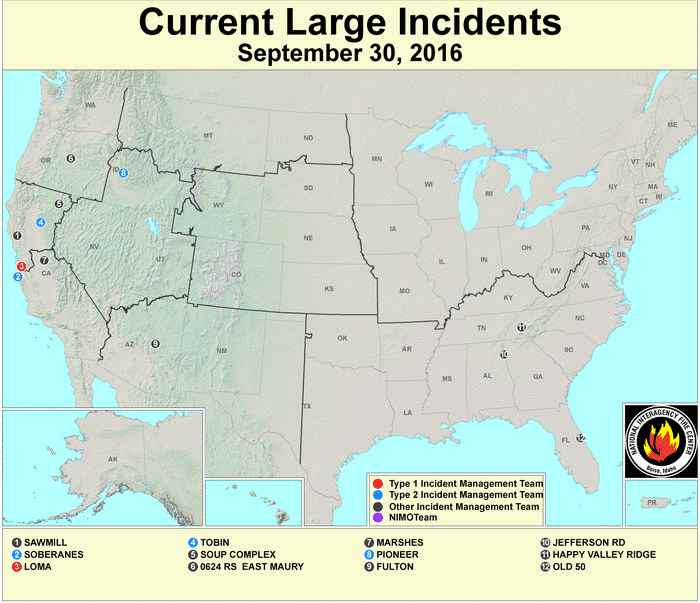
- Dry conditions were evident in several drought indicators, with areas having low soil moisture, groundwater, and streamflow levels, and impacts on vegetation. Reservoirs were low in Arizona, California, Idaho, New Mexico, Oregon, Utah, and Washington. The CMI indicated widespread short-term drought conditions in the Northwest when the month began, but precipitation reduced the CMI drought coverage as the month progressed. Large wildfires continued across parts of the West (fire map for September 1, 19, 26, and 30). According to USDA statistics, topsoil moisture was short or very short (dry or very dry) in 50 percent or more of California (80%), Nevada (65%), Oregon (62%), and New Mexico (59%); subsoil moisture was short or very short in 50 percent or more of California (80%), Nevada (70%), Oregon (65%), and Wyoming (51%); and pasture and rangeland was in poor to very poor condition in 40 percent or more of Oregon (55%) and California (45%).
- Abnormally dry and drought conditions mostly contracted in the Northern Plains and expanded in the Southern Plains. —
- Moderate to severe drought was evident in two pockets, in Oklahoma and where the VegDRI indicated stressed vegetation in western South Dakota and adjacent Wyoming and Montana.
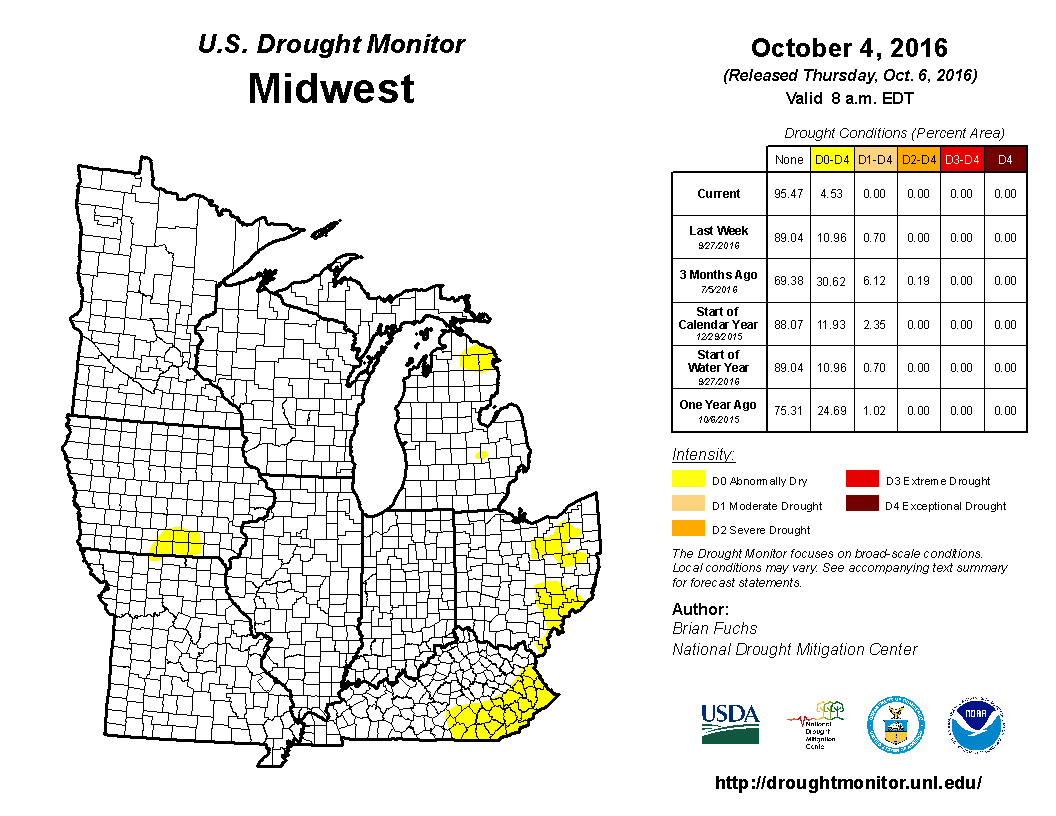
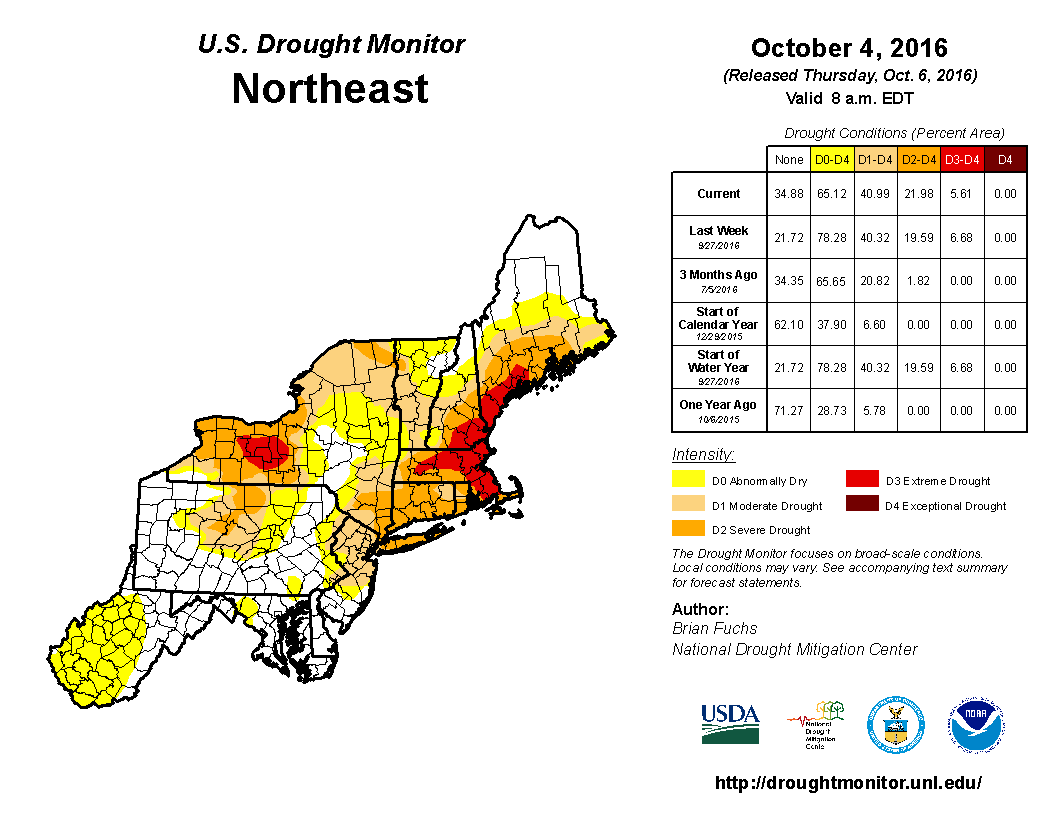
- Abnormally dry and drought conditions continued to contract in the Midwest and intensify in the Northeast, where extreme drought developed. —
- The unusually warmer-than-normal temperatures increased evaporative stress which exacerbated the drought conditions in the Northeast. Soils were dry, vegetation stressed, and groundwater and streamflow levels low. According to USDA statistics, topsoil moisture was short or very short (dry or very dry) in 50 percent or more of Rhode Island (100%), Massachusetts (78%), Connecticut (76%), New Hampshire (65%), and Vermont (53%); subsoil moisture was short or very short in 50 percent or more of Rhode Island (100%), Massachusetts (91%), Connecticut (80%), New Hampshire (63%), and Vermont (52%); and pasture and rangeland was in poor to very poor condition in 50 percent or more of Massachusetts (81%), New Hampshire (65%), Rhode Island (60%), Maine (59%), and Connecticut (56%).
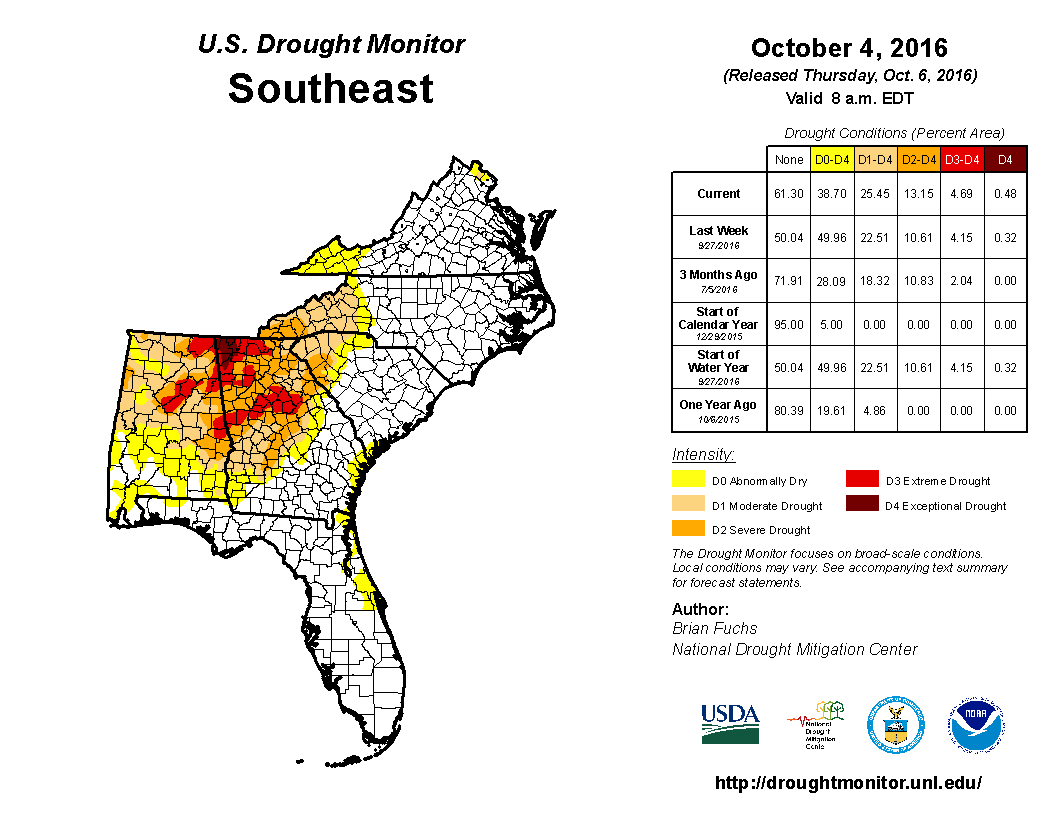
- Drought expanded and intensified in the Southeast to Lower Mississippi Valley, with exceptional drought developing in northern Georgia to southern Tennessee. —
- Drought impacts were seen in low streamflows and dry soils, with some areas reporting low groundwater levels. The CMI showed persistent agricultural drought, with areas of stressed vegetation. Water conservation measures were implemented in many communities. According to USDA statistics, topsoil moisture was short or very short (dry or very dry) in 50 percent or more of Mississippi (71%), Georgia (65%), Alabama (63%), Arkansas (61%), and Tennessee (57%); subsoil moisture was short or very short in 50 percent or more of Mississippi (64%), Alabama (60%), Georgia (58%), Tennessee (54%), and Arkansas (51%); and pasture and rangeland was in poor to very poor condition in 40 percent or more of Georgia (45%).
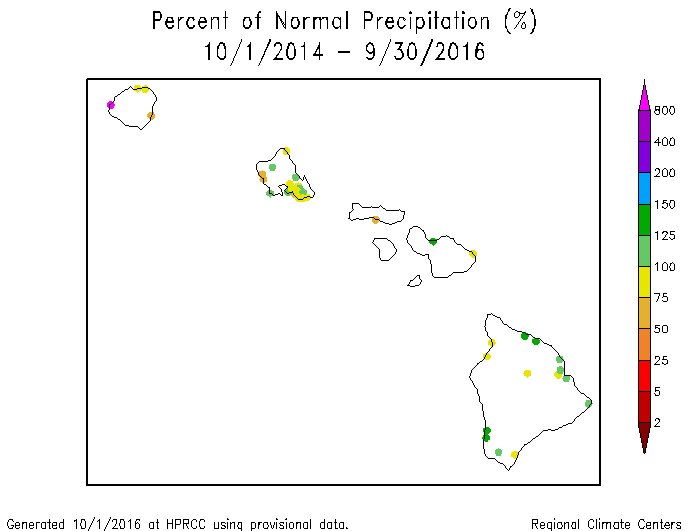
Hawaii: Even with heavy rains from Hurricane Madeline falling on the Big Island, September 2016 was mostly drier than normal on the Big Island as well as on Kauai, but wetter than normal on the rest of the main islands. The last 2, 3, and 6 months have generally been wetter than normal, except on Kauai. A mixed to drier-than-normal pattern is evident at the longer time scales (last 9, 12, 24, and 36 months). Moderate to severe drought contracted to cover about one percent of the state according to the October 4th USDM map.

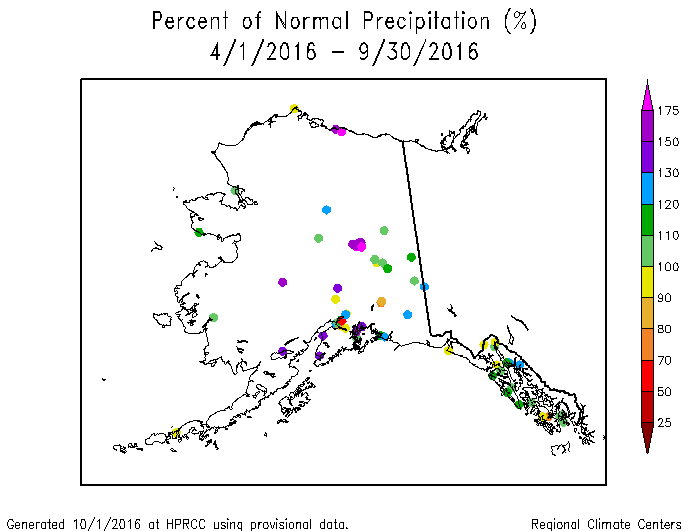
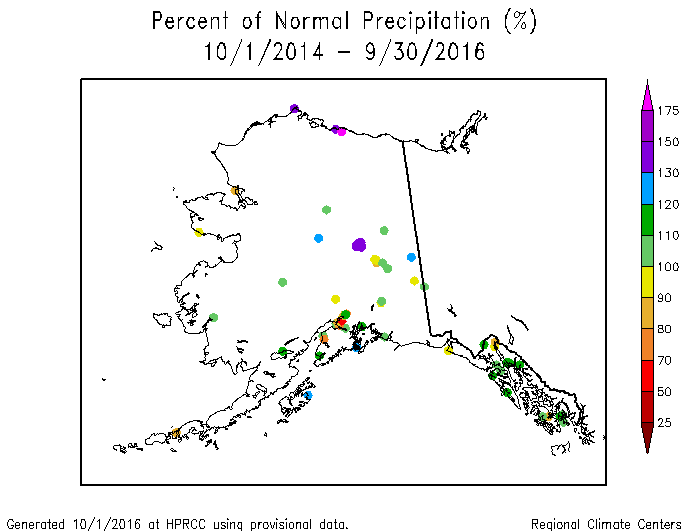
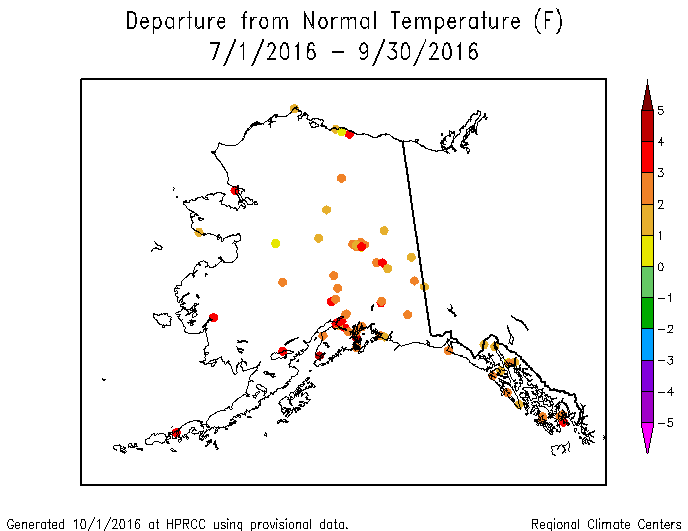
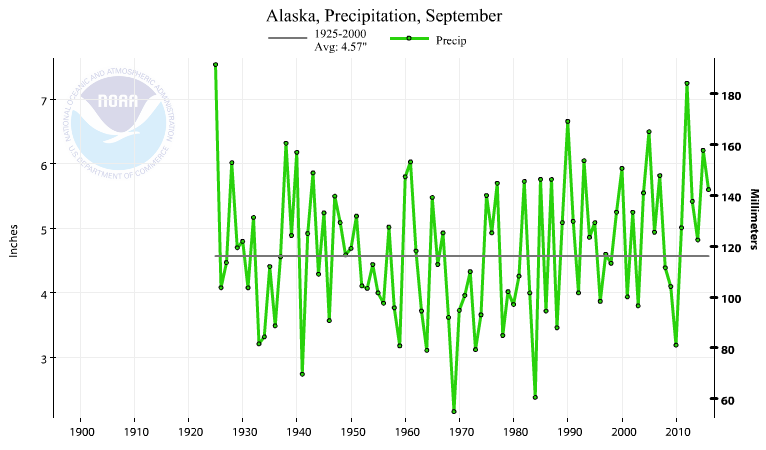
Alaska gridded percent of normal precipitation for the current month.
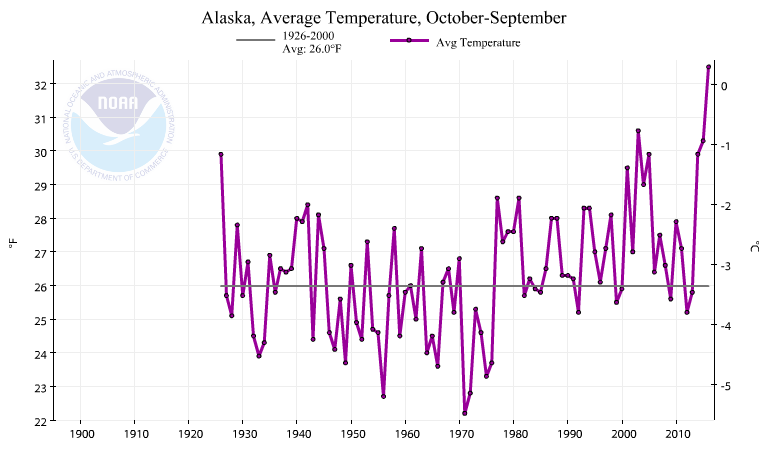
Alaska: September 2016 was mostly wetter than normal across Alaska. Based on the climate division (last 3, 9, and 12 months) and gridded (last 3, 6, and 9 months) maps, much of the last year has been mostly wetter than normal. The low elevation station maps (last 2, 3, 6, 9, and 12 months) show a somewhat mixed precipitation pattern in some areas, especially at the shorter time scales in the southeast and panhandle. A wetter-than-normal pattern dominates at the 24- and 36-month time scales. Temperatures were warmer than normal in the south and near to cooler than normal in the north, as seen on the divisional, gridded, and station maps. Warmer-than-normal temperatures dominate at the longer time scales (station maps for the last 2, 3, 9, 12 months) (climate division maps for last 3, 9, 12 months) (gridded maps for last 3, 6, 9 months). In fact, the divisional maps show that it was record-warm virtually across the state for the last 9 and 12 months. Statewide, Alaska had the 26th warmest (67th coldest) and 19th wettest (74th driest) September in the 1925-2016 record. Temperatures were record warm, statewide, ending in September 2016, for the last 6 through 12 months, and longer — the last four years have been the warmest 48-month period on record. The state was free of abnormal dryness and drought on the October 4th USDM map.
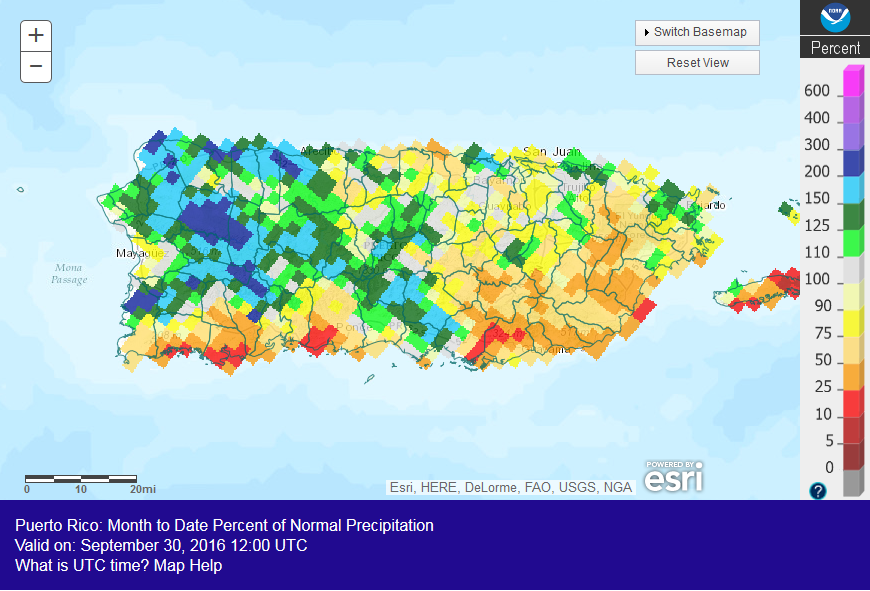
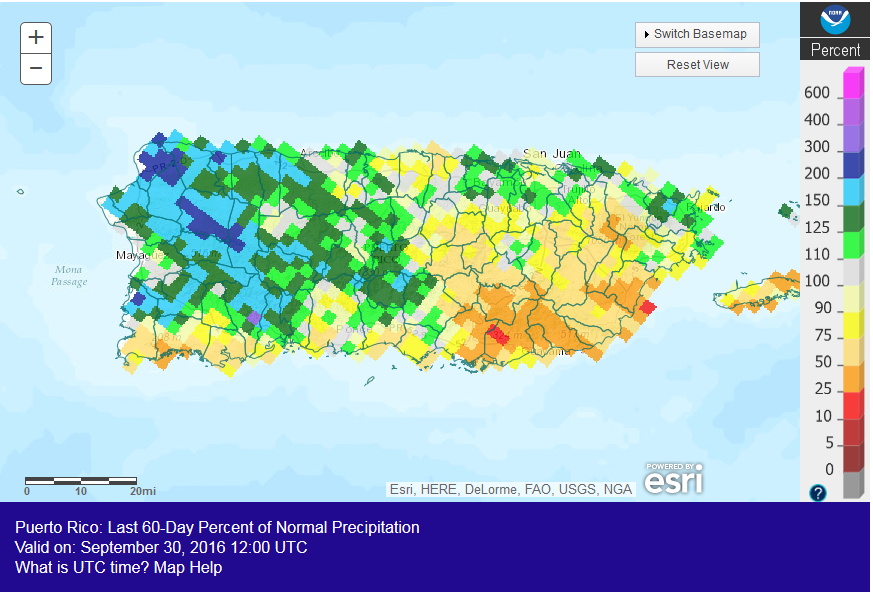
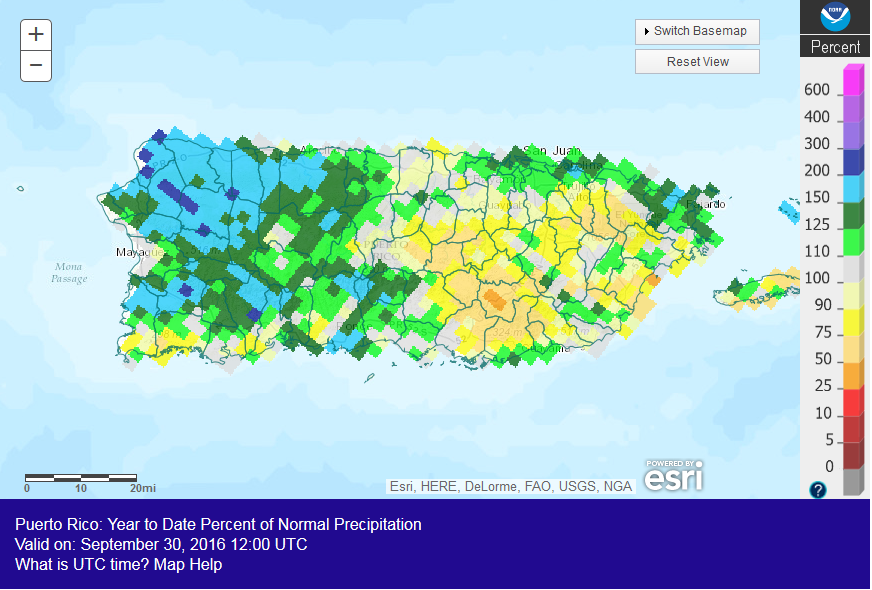
Puerto Rico: Puerto Rico was drier-than-normal in the southeast drought area and along the southern coast, and wetter than normal in the northwest, during September. This pattern is fairly consistent for the last 2, 3, 6, 9, and 12 months. Soils were still dry across parts of the southern coastal area and in the southeast drought area. As shown by the October 4th USDM map, abnormal dryness and drought held steady at about 12 percent of Puerto Rico, with moderate drought shrinking slightly to about 5 percent of the island.
CONUS State Precipitation Ranks:
 |
|
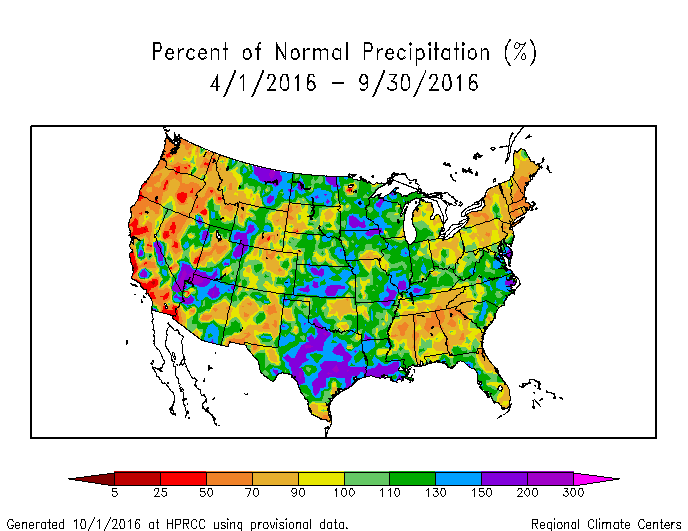
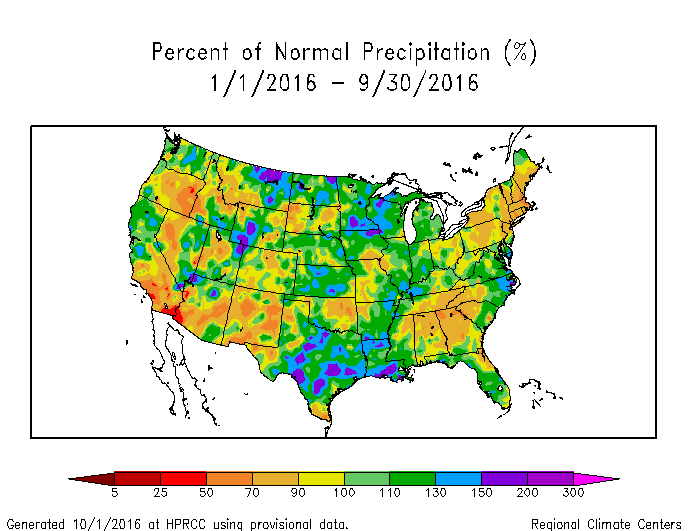
September 2016 was drier than normal across much of the Far West, Deep South, and Northeast, and parts of the Central Rockies to adjacent High Plains. The dryness showed up on the statewide level, with 15 states in the CONUS ranking in their driest third of the 1895-2016 record. Maine ranked in the top ten driest category, at fifth driest. The dryness in the Northeast and Southeast was exacerbated by increased evaporative stress caused by unusually warm temperatures, with 28 states along and east of the Mississippi River having September temperatures in the warmest third of the historical record.
 |
|

California statewide precipitation, July-September, 1895-2016.
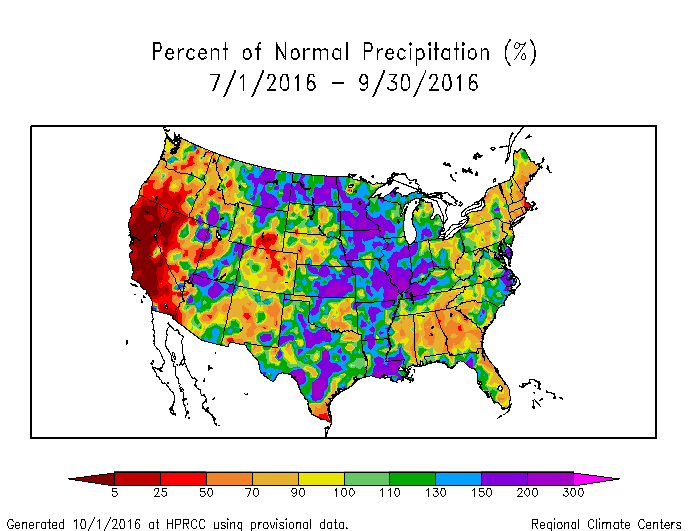
The dryness was persistent in the West, Northeast, and Southeast at the 3-month period. Eleven states in the CONUS ranked in their driest third of the historical record. Three ranked in the top ten driest category, including California (third driest July-September), Georgia (sixth driest), and Massachusetts (eighth driest). July-September temperatures were warmer than normal across much of the CONUS, with 13 states in the East having record warm temperatures.
 |

|

Massachusetts statewide precipitation, April-September, 1895-2016.
Dryness in the West, Southeast, and Northeast was evident even at the six-month time scale. Fifteen states ranked in the driest third of the historical record for April-September, with two in the Northeast having the tenth driest, or drier, such 3-month period. These were, again, Massachusetts (at fourth driest) and Connecticut (at fifth driest). The last three April-September time periods have been drier than average for these two states.
For the year to date (January-September), parts of the West, Northeast, and Southeast were still drier than normal, but areas of precipitation within the dry areas moderated the state ranks in most areas. Thirteen states ranked in the driest third of the historical record, with the severest dryness (driest ranks) persisting in southern New England — Connecticut had the fifth driest January-September and Massachusetts the seventh driest. Four of the last five year-to-dates have been much drier than average for Connecticut.
 |

|
 |
|
There were areas of dryness for the last 12 months in the West and Northeast, but areas of wetter-than-normal precipitation dominated, masking the statewide ranks in most areas except the Northeast. Seven states had an October 2015-September 2016 precipitation rank in the driest third of the historical record, with Connecticut ranking fourth driest. The last five such 12-month periods have been much drier than average in Connecticut, reflecting the prolonged nature of the dryness in this region.

|
|
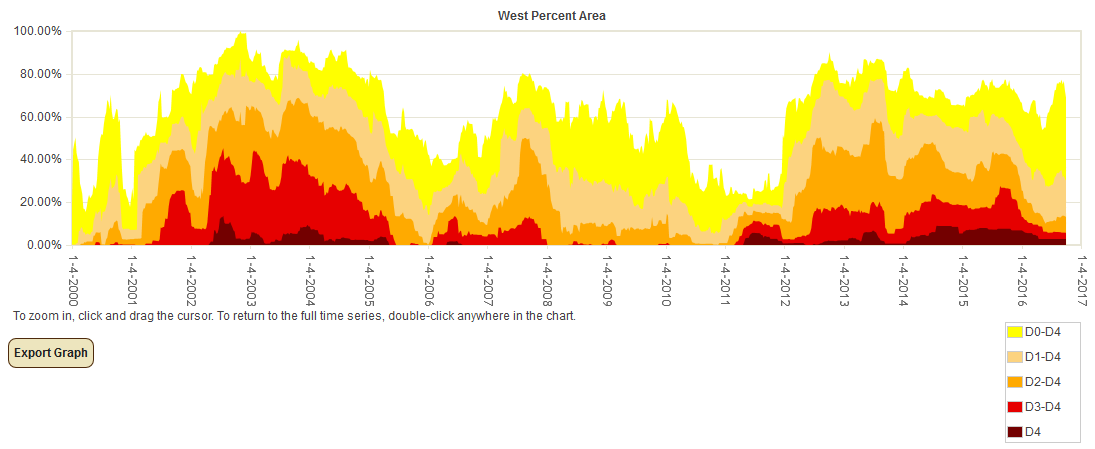
Percent area of the Western U.S. in moderate to extreme drought, January 1900 to present, based on the Palmer Drought Index.
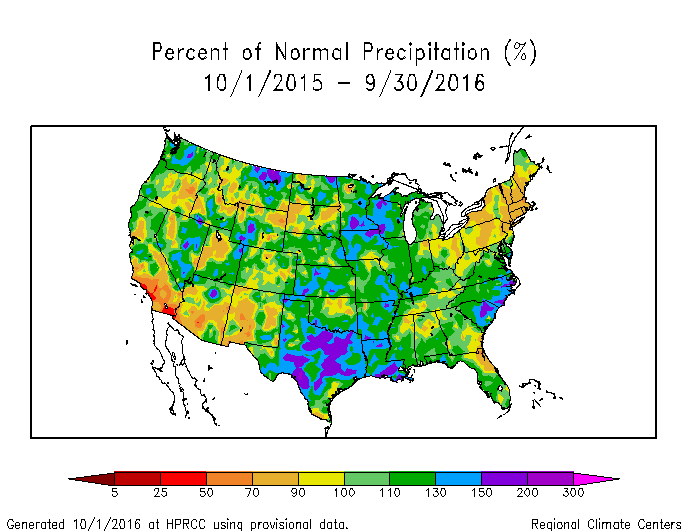
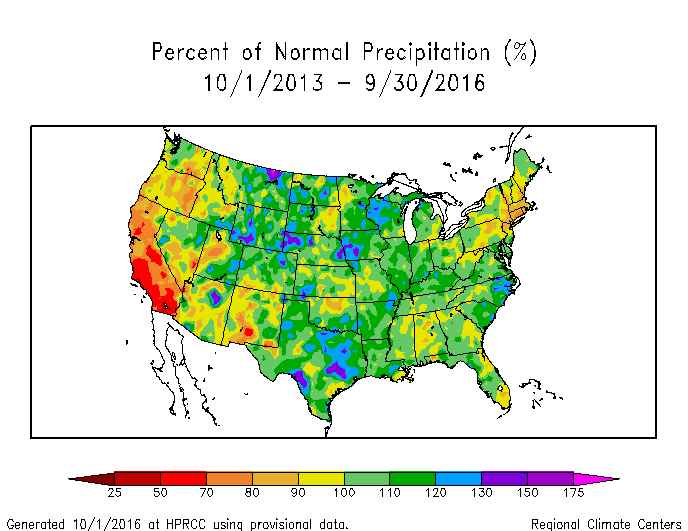
As noted earlier, September 2016 was drier than normal across the Far West and Central Rockies into the adjacent High Plains, and wetter than normal in parts of the Southwest and from the Great Basin to parts of the Northern Rockies. The water year (October 1, 2015-September 30, 2016) was drier than normal in some parts of the West and wetter than normal in others. Overall, averaged for the water year and averaged across the West, October 2015-September 2016 ranked as the 38th wettest water year in the 1895-2016 record. But temperatures were also quite warm, with this water year ranking as the fourth warmest, which increased evapotranspiration and exacerbated long-term drought conditions. In addition, even though precipitation during this water year has been above normal in many areas, one wet season cannot make up for several years of moisture deficits. This is especially true in California, where ten of the last 16 (since 2000) October-September periods have been much drier than average. So drought continued in both the USDM and Palmer analyses. In spite of the dryness of the last four months, the above-normal precipitation which fell from Utah to Montana in September improved drought conditions in these areas, arresting the overall expansion of drought in both analyses. According to the USDM, 34.8 percent of the West was experiencing moderate to exceptional drought at the end of September, about 4.7 percent less than the previous month. The Palmer Drought Index percent area statistic for the West increased slightly to 43.5 percent.

|

|
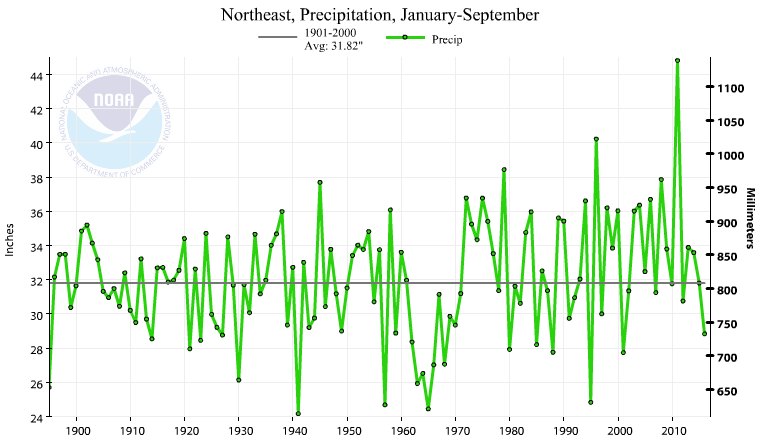
As noted above, several states in the Northeast CONUS have had very dry conditions recently. When the Northeast region as a whole is examined, September 2016 ranked as the 31st driest September in the 1895-2016 record, July-September 2016 ranked 39th driest, April-September ranked 18th driest, January-September ranked 20th driest, and October 2015-September 2016 ranked 31st driest. According to the USDM, 41.0 percent of the Northeast was experiencing moderate to exceptional drought at the end of September, a large increase from the 27.3 percent at the end of the previous month and the largest extent since 2002 in the 17-year USDM record.
 Primary Corn and Soybean Belt precipitation, September, 1895-2016.
|
 Primary Corn and Soybean Belt precipitation, March-September, 1895-2016.
|
September was wetter than normal in some parts, and drier than normal in other parts, of the Primary Corn and Soybean agricultural belt, while temperatures were warmer than normal. Regionwide, September 2016 ranked as the 30th wettest and 11th warmest September in the 1895-2016 record. March serves as the beginning of the growing season. March-September 2016 was warmer and generally wetter than normal. Regionwide, this seven-month period ranked as the fifth wettest and sixth warmest March-September in the 1895-2016 record.
NOAA Regional Climate Centers:
A more detailed drought discussion, provided by the NOAA Regional Climate Centers and others, can be found below.
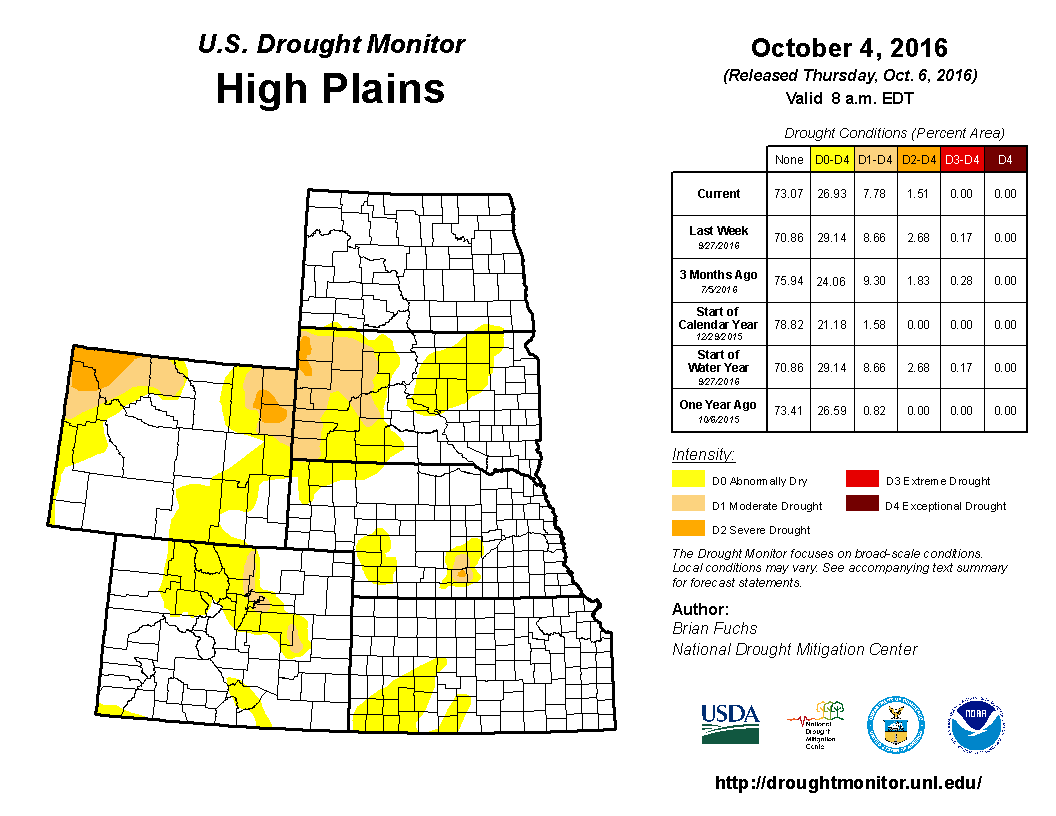
As described by the High Plains Regional Climate Center, the High Plains region continued to experience a mix of wet and dry conditions during September, while temperatures were above normal throughout the majority of the region. It was much drier than normal from Colorado northeastward through central Nebraska and South Dakota. Areas of Colorado, central Nebraska, and central South Dakota received 25 percent of normal precipitation, at best. However, the fall season tends to be a drier time of year in the High Plains, and dry conditions are welcomed by farmers who are amidst harvest. Colorado continued to experience below-normal precipitation, which resulted in the drying of topsoil and subsoil across the state. Drought conditions worsened in northwestern Wyoming, which experienced low streamflows and increased wildfire activity. According to the National Park Service, Yellowstone National Park had its most active fire year since 1988 with 62,000 acres burned. Streamflow in September in the High Plains followed a similar pattern to August, as below-normal streamflows could be found in the Upper Missouri River Basin, while the Lower Basin continued to experience above-normal streamflows. The lowest streamflows were in northwestern Wyoming where drought has been present since the end of August.
Overall, drought conditions in the High Plains improved slightly during September. The area experiencing drought or abnormal dryness (D0-D4) decreased from just over 32 percent to about 29 percent over the course of the month. The Black Hills region, which has endured the most intense drought conditions in the High Plains over the past few months, received beneficial rainfall during early September that alleviated the dryness. Rain also fell across central South Dakota during that time, resulting in the removal of moderate drought (D1). Farther south, drought conditions in south-central Nebraska improved, and the D1 in northwestern Kansas was removed. In the western High Plains, prolonged dryness caused drought to intensify in northwestern Wyoming. D1 was degraded to severe drought (D2) in early September. The USDM author for the September 6th map noted that baseflow in the headwaters of the Snake River was well below normal. In Colorado, continued dryness in the northeastern part of the state resulted in a slight expansion of D1 by mid-late September. Drought in South Dakota and Wyoming caused some impacts to agriculture and the environment. In South Dakota, pasture conditions suffered during the summer, and poor corn pollination was reported in the southeastern portion of the state.
The growing season has nearly ended throughout the region, and harvest is now in full swing. For the most part, row crops and pasture conditions fared well this year due to ample moisture and the lack of widespread drought conditions. In fact, according to the USDA, record-high corn and soybean production is expected in the U.S. this year, thanks to favorable weather and excellent field conditions. Corn and soybean harvest got off to a decent start across much of the region due to warm temperatures and late-September dryness, and spring wheat harvest wrapped up early. However, persistent wetness slowed the sugar beet harvest in North Dakota, while dry conditions in South Dakota delayed the planting of winter wheat.
As explained by the Southern Regional Climate Center, temperatures were consistently above normal across the entire region this month, while, with the exception of western Texas and central Oklahoma, September was generally a drier than normal month. The remaining four states averaged below normal precipitation. Conditions were considerably dry in northern Mississippi, southern Arkansas and western Tennessee. A majority of the stations in that area averaged less than 50 percent of normal precipitation. In west central Texas and central Oklahoma, the opposite was observed, with many stations averaging over one and a half times the monthly average. The dry conditions across the Southern region led to an expansion of drought coverage. Anomalously warm weather, combined with drier than normal conditions in Mississippi, resulted in the much of the state being categorized under moderate drought. In southeastern Tennessee, drought also worsened. Counties there that were experiencing severe drought are now experiencing extreme drought. The USDA-NRCS office in Pulaski, Tennessee reported that drought conditions in middle Tennessee are beginning to have an impact as they have observed some cool season grass fields (Orchard grass and Tall Fescue) that are dead.
As summarized by the Midwest Regional Climate Center, September temperatures were above normal across the Midwest and precipitation fell in large amounts on multiple occasions. Despite the large totals in widespread locations, all nine states had areas with below normal rainfall, including nearly all of Kentucky. Midwest drought eased in September with most of the affected area in Ohio. The percentage of the state of Ohio in drought dropped from about 20 percent at the onset of September to less than 8 percent by the end of the month. Abnormally dry regions, primarily in the eastern half of the Midwest, dropped through the early and middle parts of September but increased sharply in the last week of the month to more than 10 percent of the region.
As noted by the Southeast Regional Climate Center, temperatures were well above average across the Southeast region while precipitation was highly variable, with numerous precipitation extremes recorded. The driest locations were found across northern and central Alabama, northern and west-central Georgia, Upstate South Carolina, and western North Carolina. Monthly precipitation totals ranged between 50 to less than 5 percent of normal in these areas. Cedartown, GA (1936-2016), a town located about 50 miles northwest of Atlanta, observed its first month on record with no measurable precipitation. Belle Mina, AL (1949-2016), a town located about 15 miles southwest of Huntsville, observed its driest September on record with only 0.15 inch (3.8 mm) of precipitation. In contrast, the wettest locations were found in west-central Virginia and a broad area extending northeastward from the Big Bend of Florida to eastern Virginia. Precipitation was generally above normal in northwestern Puerto Rico and below normal across the remainder of Puerto Rico and the U.S. Virgin Islands. Coloso, PR (1905-2016) observed its driest September on record with only 2.65 inches (67.3 mm) of precipitation.
Drought conditions intensified and expanded in coverage across much of the Southeast region during September, especially in Alabama, Georgia, and North Carolina. The coverage of moderate-to-extreme (D1-D3) drought in Alabama increased by 20 percent during the month, while extreme-to-exceptional (D3-D4) drought expanded by 10 percent in coverage across northern Georgia. Exceptional drought conditions developed in a small area of northwestern Georgia at the end of the month, which is the first time since February 2013 that this drought designation has occurred anywhere in the state. Moderate drought spread across much of western North Carolina and Upstate South Carolina during the latter half of September. A small area of southeastern Puerto Rico remained in moderate drought during the month. Dryland crops, particularly soybeans, were highly stressed by excessive heat and dryness across interior portions of the region. Farmers in Georgia and Alabama struggled to dig up peanuts from hard soils that received little rainfall during the month. Pastures and hay fields, plagued by drought and armyworm infestation, remained in very poor condition across the region, with some livestock producers in Georgia and North Carolina having to sell off their cattle due to a shortage of hay. Though approximately 25 percent of pecan trees (loaded with nuts prior to harvest) in southern Georgia were affected by Hurricane Hermine's strong winds, yields are expected to be good this year, as the lack of summer rainfall prevented a widespread threat of pecan scab disease.
As explained by the Northeast Regional Climate Center, on the heels of a record-warm August, the Northeast had its third warmest September on record and wrapped up the month on the dry side of normal. The region picked up 2.77 inches (70.36 mm) of precipitation, 71 percent of normal. Ten states were drier than normal, with three ranking this September among their top eighteen driest: Maine, 5th driest; Vermont, 12th driest; and Connecticut, 18th driest. Maryland and Delaware were wetter than normal, with Delaware having its fourth wettest September on record. Precipitation for all states ranged from 39 percent of normal in Maine to 206 percent of normal in Delaware.
The August 30 USDM showed 27 percent of the Northeast was experiencing moderate, severe, or extreme drought, with another 31 percent being abnormally dry. With above-normal temperatures and below-normal precipitation, conditions deteriorated during September. The September 27th USDM released on September 29 indicated 40 percent of the Northeast was in a moderate, severe, or extreme drought, with another 38 percent being abnormally dry. In early September, Pennsylvania upgraded four counties to a drought watch. Southeastern Massachusetts was upgraded to a drought warning, while Cape Cod was upgraded to a drought watch. In early to mid-September, more than 175 Massachusetts water suppliers, more than 115 New Hampshire water systems, and several communities in other drought-affected areas had water bans and/or restrictions in place. Streamflow, reservoir, and groundwater levels continued to be below normal. For the September 14-21 period, preliminary data from USGS indicated more than 45 waterways in New England and more than 15 waterways in the rest of the region (with at least 30 years of data) had record or near-record low 7-day average streamflow. Preliminary data for the same period also indicated record-low daily water levels for more than fifteen USGS well sites in the Northeast. Private wells continued to run dry, and some communities, including Worcester, began buying water from the Massachusetts Water Resources Authority. Some farmers had to haul in water for irrigation and livestock due to low or dried up water supplies, while cranberry growers in Massachusetts were concerned that they wouldn't have enough water to protect their crops from frost or harvest their crop. Dry conditions continued to impact pastures and yields of soybeans, corn, and hay. Farmers in more drought-stricken counties became eligible for federal aid.
As summarized by the Western Regional Climate Center, September showed characteristics typical of an autumn transition, with several low-pressure systems sweeping across the area bringing cooler temperatures and the first snow of the season for many locations. Temperatures were generally near or slightly cooler than normal west of the Rocky Mountains, and above normal precipitation was observed in a broad swath of the West stretching from San Diego, California, northeast to eastern Montana.
Drier than normal conditions were observed in California, southern Oregon, eastern Washington, northern Idaho, and the western Great Basin, not atypical for this time of year. Wenatchee, Washington, recorded 0.05 in (1 mm), 15% of normal. Drier than normal conditions were also observed in Colorado and scattered areas of the Southwest, where Colorado Springs logged 0.16 in (4 mm), 13% of normal and tied for 5th driest September since records began in 1948. Areas of abnormally dry conditions or increasing drought severity were indicated this month in the southeastern Great Basin, central Utah, southern Idaho, along the Idaho-Montana-Wyoming border, and in portions of northern Colorado. Improvements in drought conditions this month were made across large areas of Arizona and New Mexico, eastern Utah, and southeastern Montana.
Many areas of Hawaii observed above normal precipitation this month, mostly related to weakening Hurricane Lester passing to the north of the Islands in the first week of the month as well as an upper level disturbance mid-month. To the north, every major station in Alaska reported above normal temperatures for September. Precipitation was near normal across most of the state, though in the interior of the state, Bettles observed its wettest September in a 66-year record with 5.34 in (136 mm), 280% of normal.
Pacific Islands: The NOAA National Weather Service (NWS) offices, the Pacific ENSO Applications Climate Center (PEAC), and partners provided reports on conditions across the Pacific Islands.
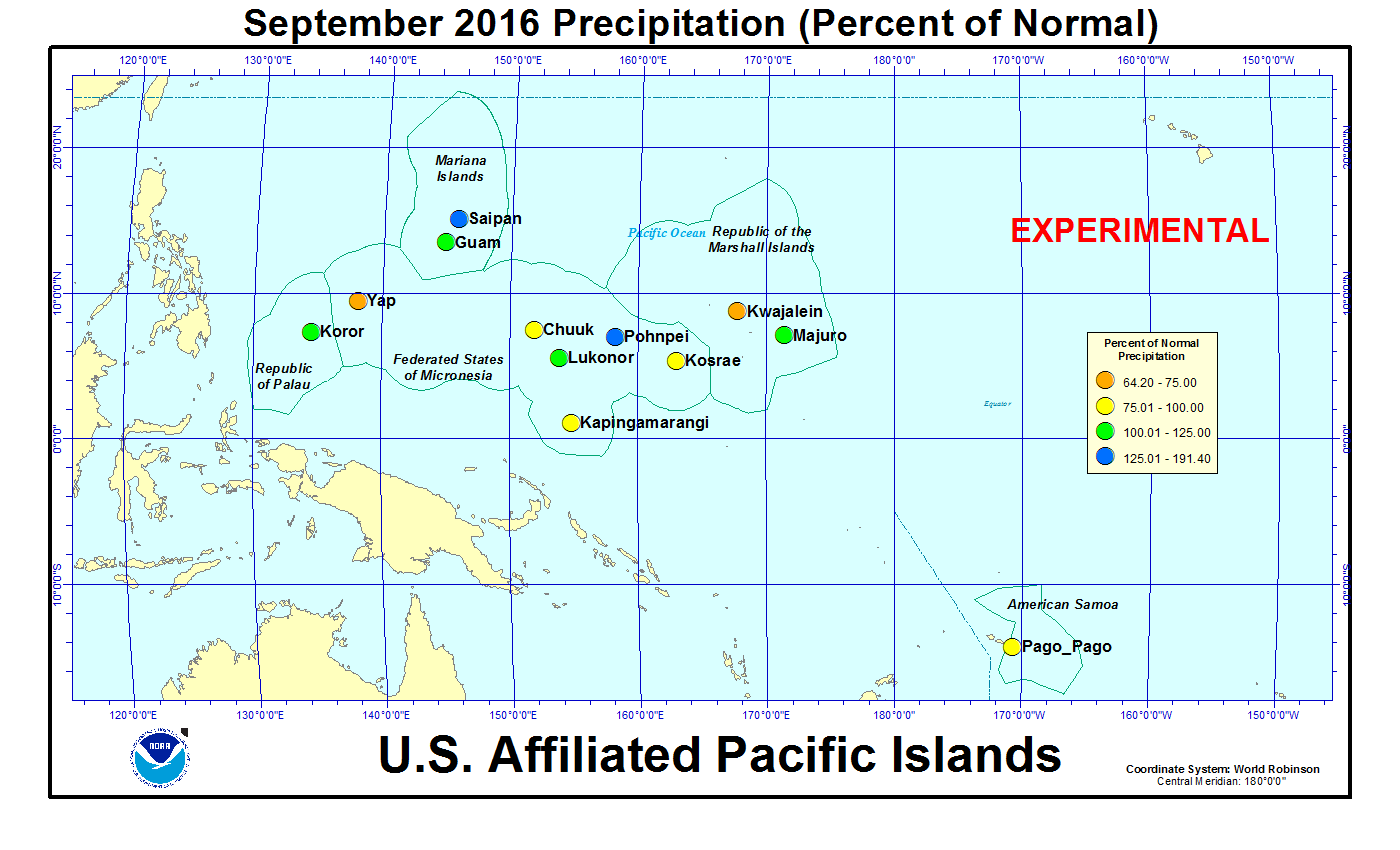
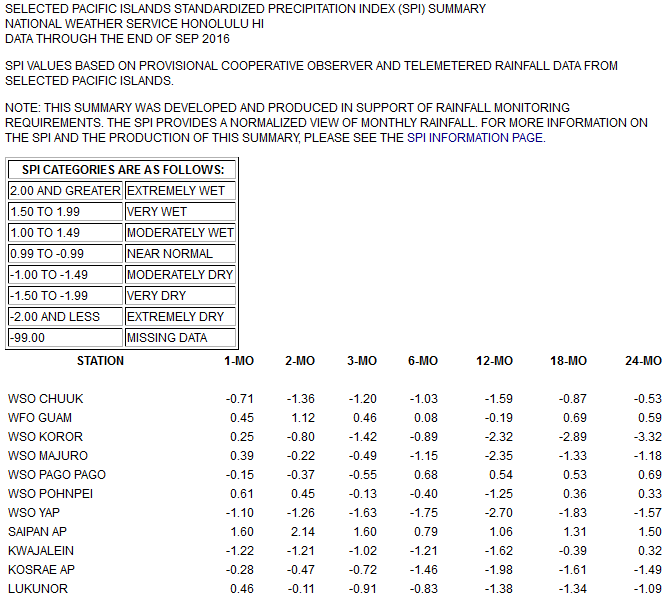
In the U.S. Affiliated Pacific Islands (USAPI) (maps — Federated States of Micronesia, Northern Mariana Islands, Marshall Islands, Republic of Palau, American Samoa, basinwide), September 2016 was wetter than normal at Guam, Koror, Lukonor, Majuro, Pohnpei, and Saipan, and drier than normal at Chuuk, Kapingamarangi, Kosrae, Kwajalein, Pago Pago, and Yap.
Rainfall amounts were below the minimum thresholds (4 or 8 inches) required to meet most monthly water needs at stations in the Federated States of Micronesia (FSM) (Fananu and Pingelap), the Marshall Islands (Ailinglapalap, Jaluit, Kwajalein, and Wotje), and American Samoa (Pago Pago). September rainfall was above the monthly minimum thresholds at the rest of the regular reporting stations in Micronesia. The monthly precipitation at Pago Pago has been below their 8-inch minimum for the last 4 months, giving June-September a rank of tenth driest out of 51 years, which equates to the 20th percentile. The 4- and 8-inch thresholds are important because, if monthly precipitation falls below the threshold, then drought becomes a concern.
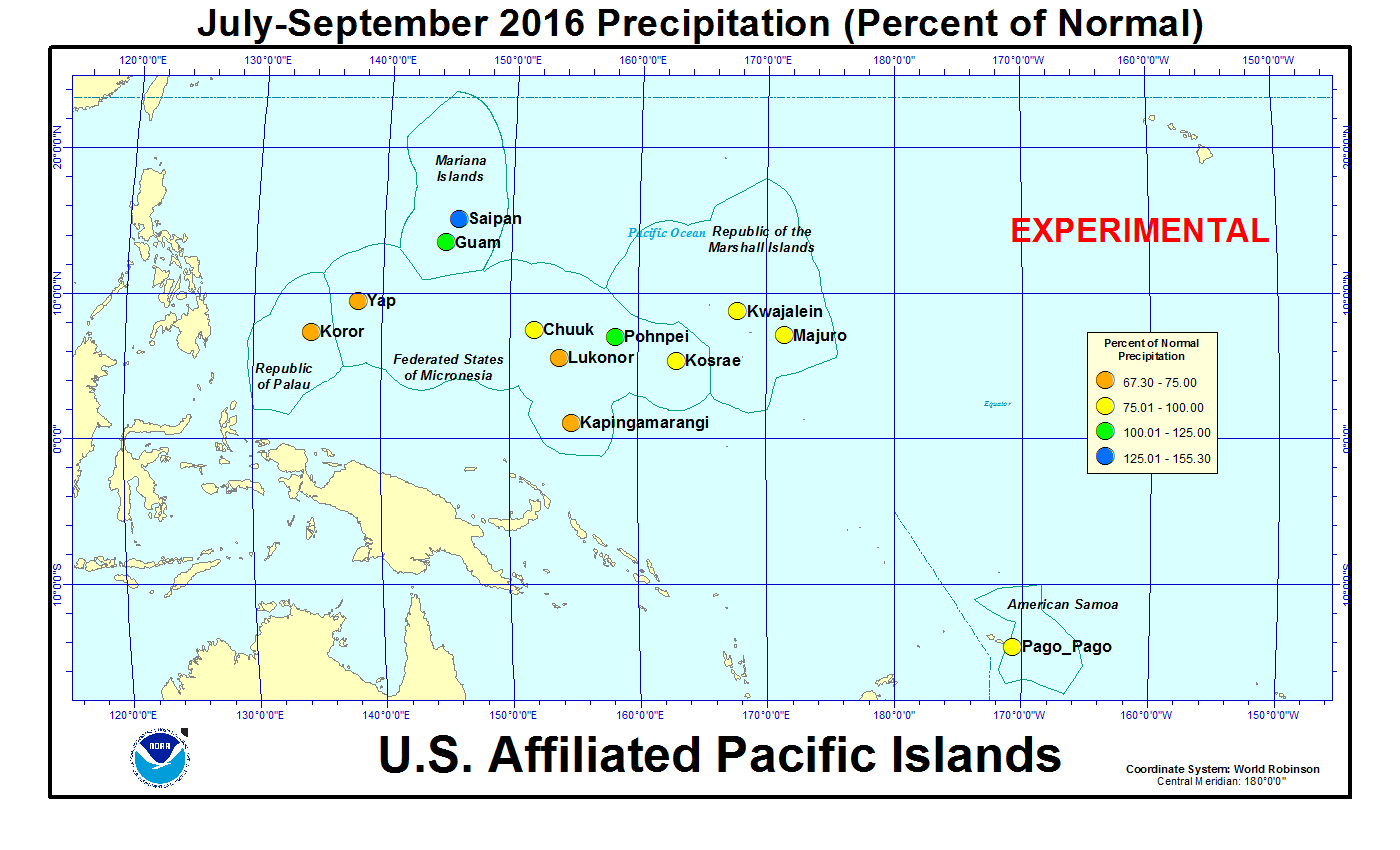
As measured by percent of normal precipitation, Chuuk, Kapingamarangi, Kosrae, Kwajalein, and Yap have been drier than normal in the short term (September and the last 3 months [July-September 2016]) as well as the long term (year to date [January-September 2016] and last 12 months [October 2015-September 2016]). Pohnpei was wetter than normal in the short term but drier than normal in the long term. Pago Pago was near to wetter than normal in the long term but drier than normal in the short term. Koror, Lukonor, and Majuro were wetter than normal for September but drier than normal at the other three time scales. Guam was drier than normal at the 12-month time scale but near to wetter than normal at the other three time scales. Saipan was wetter than normal for all four time periods.
| Station Name | Oct 2015 | Nov 2015 | Dec 2015 | Jan 2016 | Feb 2016 | Mar 2016 | Apr 2016 | May 2016 | Jun 2016 | Jul 2016 | Aug 2016 | Sep 2016 | Oct- Sep |
|---|---|---|---|---|---|---|---|---|---|---|---|---|---|
| Chuuk | 53% | 70% | 82% | 63% | 29% | 85% | 86% | 107% | 91% | 94% | 74% | 86% | 75% |
| Guam NAS | 125% | 81% | 74% | 65% | 120% | 79% | 52% | 53% | 125% | 67% | 141% | 124% | 87% |
| Kapingamarangi | 63% | 89% | 134% | 103% | 65% | 88% | 94% | 34% | 24% | 66% | 91% | 77% | 66% |
| Koror | 53% | 69% | 41% | 26% | 30% | 36% | 135% | 115% | 93% | 45% | 61% | 115% | 63% |
| Kosrae | 63% | 33% | 95% | 60% | 113% | 32% | 23% | 72% | 130% | 88% | 88% | 89% | 61% |
| Kwajalein | 105% | 88% | 59% | 64% | 17% | 45% | 21% | 57% | 142% | 101% | 83% | 64% | 76% |
| Lukonor | 40% | 123% | 56% | 123% | 61% | 51% | 113% | 102% | 73% | 43% | 73% | 120% | 70% |
| Majuro | 83% | 40% | 61% | 14% | 46% | 20% | 22% | 110% | 66% | 90% | 75% | 123% | 65% |
| Pago Pago | 88% | 210% | 183% | 34% | 54% | 101% | 329% | 102% | 73% | 81% | 83% | 83% | 107% |
| Pohnpei | 78% | 67% | 71% | 102% | 49% | 44% | 60% | 80% | 143% | 79% | 112% | 144% | 83% |
| Saipan | 198% | 64% | 154% | 54% | 105% | 106% | 68% | 87% | 57% | 42% | 186% | 191% | 128% |
| Yap | 43% | 37% | 58% | 35% | 34% | 15% | 62% | 113% | 54% | 67% | 88% | 66% | 57% |
| Station Name | Oct 2015 | Nov 2015 | Dec 2015 | Jan 2016 | Feb 2016 | Mar 2016 | Apr 2016 | May 2016 | Jun 2016 | Jul 2016 | Aug 2016 | Sep 2016 | Oct- Sep |
|---|---|---|---|---|---|---|---|---|---|---|---|---|---|
| Chuuk | 6.09" | 7.46" | 9.25" | 6.40" | 2.09" | 7.08" | 10.73" | 12.11" | 10.61" | 11.27" | 9.50" | 10.04" | 102.63" |
| Guam NAS | 14.26" | 5.96" | 3.77" | 2.62" | 3.63" | 1.63" | 1.31" | 1.80" | 7.73" | 6.77" | 20.85" | 15.65" | 85.98" |
| Kapingamarangi | 5.13" | 8.28" | 13.20" | 9.40" | 6.04" | 10.02" | 12.78" | 4.07" | 3.30" | 9.33" | 7.38" | 7.61" | 96.54" |
| Koror | 6.24" | 7.86" | 4.59" | 2.64" | 2.53" | 2.68" | 9.90" | 13.55" | 16.25" | 8.28" | 8.20" | 13.51" | 96.23" |
| Kosrae | 6.90" | 4.55" | 15.37" | 9.95" | 14.56" | 5.15" | 3.99" | 12.70" | 18.99" | 13.07" | 12.48" | 12.71" | 130.42" |
| Kwajalein | 11.71" | 9.98" | 3.90" | 2.02" | 0.46" | 1.05" | 1.13" | 3.80" | 9.81" | 9.96" | 8.12" | 6.90" | 68.84" |
| Lukonor | 4.53" | 11.18" | 6.35" | 10.37" | 5.44" | 4.75" | 12.83" | 11.92" | 8.49" | 6.84" | 10.31" | 12.23" | 105.24" |
| Majuro | 10.52" | 5.33" | 6.93" | 1.11" | 3.17" | 1.33" | 2.05" | 11.12" | 7.27" | 10.09" | 8.78" | 13.73" | 81.43" |
| Pago Pago | 8.15" | 21.33" | 23.53" | 4.49" | 6.49" | 10.76" | 30.87" | 9.89" | 3.88" | 4.48" | 4.49" | 5.45" | 133.81" |
| Pohnpei | 11.86" | 9.95" | 11.41" | 13.49" | 4.64" | 5.76" | 11.01" | 16.06" | 21.18" | 12.12" | 15.91" | 18.13" | 151.52" |
| Saipan | 21.00" | 3.61" | 5.94" | 1.36" | 2.72" | 2.00" | 1.78" | 2.07" | 2.05" | 3.76" | 24.40" | 19.31" | 90" |
| Yap | 5.29" | 3.31" | 4.93" | 2.23" | 1.77" | 0.70" | 3.47" | 8.90" | 6.46" | 10.03" | 13.10" | 8.89" | 69.08" |
| Station Name | Oct 2015 | Nov 2015 | Dec 2015 | Jan 2016 | Feb 2016 | Mar 2016 | Apr 2016 | May 2016 | Jun 2016 | Jul 2016 | Aug 2016 | Sep 2016 | Oct- Sep |
|---|---|---|---|---|---|---|---|---|---|---|---|---|---|
| Chuuk | 11.51" | 10.61" | 11.25" | 10.10" | 7.25" | 8.32" | 12.47" | 11.30" | 11.66" | 11.98" | 12.86" | 11.71" | 136.77" |
| Guam NAS | 11.44" | 7.38" | 5.11" | 4.01" | 3.03" | 2.07" | 2.53" | 3.40" | 6.18" | 10.14" | 14.74" | 12.66" | 99.09" |
| Kapingamarangi | 8.19" | 9.27" | 9.84" | 9.15" | 9.27" | 11.43" | 13.64" | 12.08" | 13.78" | 14.15" | 8.13" | 9.93" | 145.85" |
| Koror | 11.84" | 11.39" | 11.16" | 10.18" | 8.56" | 7.44" | 7.32" | 11.83" | 17.48" | 18.53" | 13.50" | 11.77" | 152.90" |
| Kosrae | 10.94" | 13.83" | 16.11" | 16.67" | 12.93" | 16.06" | 17.51" | 17.75" | 14.64" | 14.91" | 14.22" | 14.22" | 213.87" |
| Kwajalein | 11.18" | 11.28" | 6.66" | 3.16" | 2.64" | 2.35" | 5.26" | 6.72" | 6.93" | 9.87" | 9.74" | 10.74" | 90.41" |
| Lukonor | 11.32" | 9.08" | 11.27" | 8.41" | 8.93" | 9.26" | 11.31" | 11.69" | 11.65" | 15.93" | 14.04" | 10.15" | 151.36" |
| Majuro | 12.73" | 13.44" | 11.39" | 7.74" | 6.88" | 6.58" | 9.42" | 10.11" | 11.01" | 11.17" | 11.69" | 11.17" | 125.25" |
| Pago Pago | 9.26" | 10.14" | 12.84" | 13.34" | 12.00" | 10.68" | 9.39" | 9.66" | 5.33" | 5.55" | 5.38" | 6.53" | 125.57" |
| Pohnpei | 15.27" | 14.83" | 16.08" | 13.18" | 9.55" | 13.17" | 18.41" | 19.96" | 14.81" | 15.43" | 14.26" | 12.55" | 182.36" |
| Saipan | 10.62" | 5.61" | 3.85" | 2.53" | 2.59" | 1.89" | 2.63" | 2.38" | 3.62" | 8.91" | 13.13" | 10.09" | 70.25" |
| Yap | 12.18" | 8.83" | 8.51" | 6.39" | 5.19" | 4.56" | 5.63" | 7.85" | 12.04" | 15.08" | 14.82" | 13.50" | 120.31" |
The end of the El Niño and development of ENSO-neutral conditions in the tropical Pacific has resulted in the return of much-needed rainfall to most of the USAPI region. The rains have ended the drought, although long-term drought impacts linger on some islands due to the extreme dryness of this recent El Niño episode as seen in the table below.
An analysis of historical data for the USAPI stations in the Global Historical Climatology Network-Daily (GHCN-D) dataset, augmented with fill-in data from the 1981-2010 Normals, indicated that, even though rains have returned during the last one to four months, several stations still had record or near-record dryness during October 2015-September 2016. The following table lists the precipitation ranks for September 2016, June-September 2016 (last 4 months), and October 2015-September 2016 (the last 12 months). Some stations have a long period of record and their dataset is fairly complete, while other stations have a shorter period of record and the dataset has some missing data. September 2016 was the second driest September for Wotje (based on a record from 1981-2016). June-September 2016 was the second driest such 4-month period on record for Kapingamarangi (1962-2016) and Nukuoro (1981-2016), and third driest for Yap (1951-2016) and Lukonor (1981-2016). The last twelve months (October 2015-September 2016) was the driest such October-September period on record at Ailinglapalap (1981-2016) and Yap, and second driest at Koror (1951-2016), Woleai (1968-2016), Majuro (1954-2016), and Kapingamarangi.
Rank of 1 = driest.
| Station | Sep 2016 Rank |
Sep No. of Years |
Jun- Sep 2016 Rank |
Jun- Sep No. of Years |
Oct 2015- Sep 2016 Rank |
Oct- Sep No. of Years |
Period of Record |
| Koror | 36 | 66 | 7 | 65 | 2 | 65 | 1951-2016 |
| Woleai | 18 | 35 | 7 | 29 | 2 | 23 | 1968-2016 |
| Yap | 6 | 66 | 3 | 65 | 1 | 65 | 1951-2016 |
| Majuro | 38 | 63 | 12 | 63 | 2 | 62 | 1954-2016 |
| Ulithi | 13 | 35 | 4 | 34 | 3 | 32 | 1981-2016 |
| Ailinglapalap | 5 | 33 | 10 | 32 | 1 | 30 | 1981-2016 |
| Kosrae | 14 | 45 | 14 | 40 | 4 | 28 | 1954-2016 |
| Lukonor | 21 | 33 | 3 | 20 | 3 | 19 | 1981-2016 |
| Saipan | 35 | 36 | 35 | 36 | 22 | 27 | 1981-2016 |
| Pohnpei | 52 | 66 | 41 | 65 | 5 | 65 | 1951-2016 |
| Kwajalein | 6 | 65 | 16 | 65 | 5 | 64 | 1952-2016 |
| Kapingamarangi | 11 | 25 | 2 | 18 | 2 | 15 | 1962-2016 |
| Chuuk | 15 | 66 | 4 | 65 | 5 | 65 | 1951-2016 |
| Guam | 37 | 60 | 35 | 60 | 15 | 59 | 1957-2016 |
| Nukuoro | 7 | 34 | 2 | 32 | 11 | 31 | 1981-2016 |
| Pago Pago | 23 | 51 | 10 | 51 | 36 | 50 | 1966-2016 |
| Wotje | 2 | 33 | 26 | 33 | N/A | 30 | 1981-2016 |
| Utirik | 6 | 13 | 5 | 7 | N/A | 1 | 1985-2016 |


[top]
State/Regional/National Moisture Status
A detailed review of drought and moisture conditions is available for all contiguous U.S. states, the nine standard regions, and the nation (contiguous U.S.):
| northeast u. s. | east north central u. s. | central u. s. |
| southeast u. s. | west north central u. s. | south u. s. |
| southwest u. s. | northwest u. s. | west u. s. |
| Contiguous United States |
[top]
Contacts & Questions