National Overview:

- Climate Highlights — September
 September Average Temperature Departures |
 September Percent of Average Precipitation |
Temperature
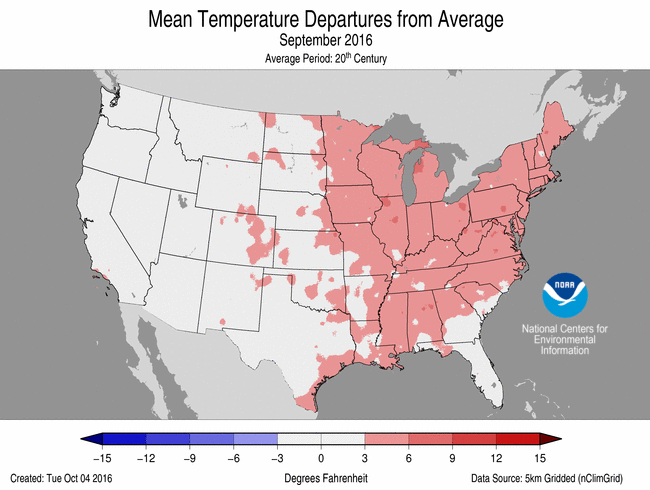
- The contiguous U.S. average September temperature was 67.2°F, 2.4°F above the 20th century average, making it the ninth warmest September in the 122-year period of record.
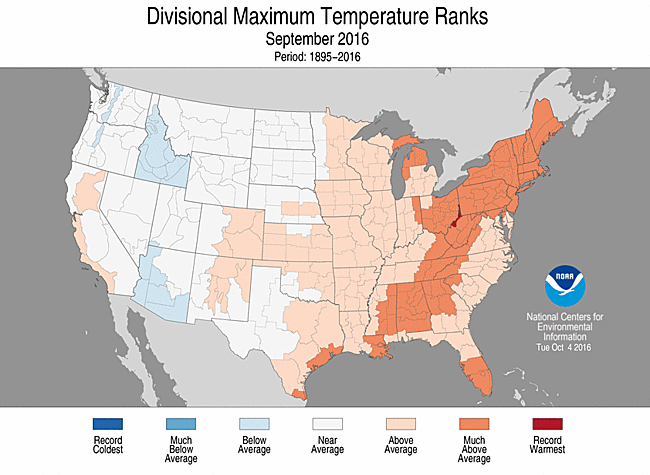
- Above-average temperatures were observed for most locations east of the Rockies, with record warmth across parts of the Southeast, Midwest, and Mid-Atlantic. Twenty-eight states across the Midwest, Southeast and Northeast were much warmer than average. Alaska was also warmer than average. Ohio was record warm, with a monthly temperature 4.9°F above average.
- Near- to below-average temperatures were observed from the Rockies to the West Coast.
- The contiguous U.S. average maximum (daytime) temperature during September was 79.5°F, 1.7°F above the 20th century average, the 23rd warmest on record. Above-average maximum temperatures were observed for most locations east of the Rockies with much-above-average maximum temperatures in the Southeast and Northeast. Near-average maximum temperatures were observed for much of the West and Great Plains with below-average maximum temperatures in the Southwest and Northern Rockies.
- The contiguous U.S. average minimum (nighttime) temperature during September was 54.9°F, 3.0°F above the 20th century average, the fourth warmest on record. Above-average minimum temperatures were observed for most locations from the Rockies to East Coast. Record warm minimum temperatures were observed in parts of the Midwest and Mid-Atlantic. The West Coast and parts of the Southwest had near-average minimum temperatures.
- During September there were 3,715 record warm daily high (1,100) and low (2,615) temperature records, which is more than five times the 669 record cold daily high (422) and low (247) temperature records.
- Based on NOAA's Residential Energy Demand Temperature Index (REDTI), the contiguous U.S. temperature-related energy demand during September was 103 percent above average and the seventh highest value on record, driven in large part to warm temperatures across the densely populated Northeast as well as the Midwest and Southeast.

September 2016 Statewide Temperature Ranks
Precipitation
September 2016 Precipitation Ranks
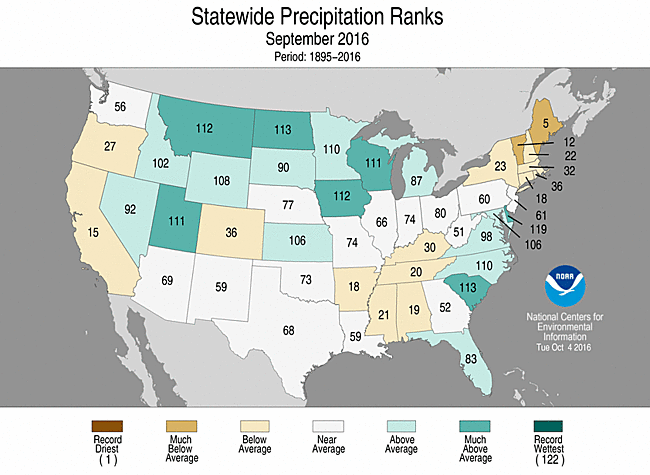
- The September precipitation total for the contiguous U.S. was 2.70 inches, 0.21 inch above the 20th century average, and ranked near the median value in the 122-year period of record.
- Above-average precipitation was observed across the interior West, Northern Plains and Rockies, Upper Midwest and parts of the Southeast and Mid-Atlantic. Delaware, Iowa, Montana, North Dakota, South Carolina, Utah and Wisconsin were much wetter than average. The remnants from both Hurricane Hermine and Tropical Storm Julia brought heavy rain to parts of the Southeast and Mid-Atlantic coastal regions.
- Hurricane Hermine formed in the Gulf of Mexico and made landfall along the Florida Panhandle on September 2 as a Category 1 hurricane with sustained winds of 80 mph. Hermine was the first hurricane to make landfall in Florida since Wilma in 2005. Hermine quickly weakened after making landfall, but its remnant low pressure system moved across the Southeast, bringing flooding rains to Florida, Georgia, and the Carolinas. At least five fatalities were attributed to Hermine. The U.S. CRN site in Blackville, South Carolina observed its wettest day in its 14-year history when the remnants of Hermine pass on September 2nd with 7.86 inches, with 7.35 inches of the rain falling in 12 hours. These totals correspond to once in one hundred year events at the 12- and 24-hour time intervals.
- In late September, extremely heavy rainfall impacted central and northeastern Iowa causing record and near-record river levels across the state. Five-day precipitation totals exceeded 10 inches for some locations. The Cedar River in Cedar Rapids, Iowa crested at its second highest level, shy of the 2008 record, with water inundating large parts of the city.
- Heavy precipitation fell across Hawaii during September due to remnants of tropical systems and upper-level low pressure systems. Honolulu observed its second wettest September in a 77-year period of record with 2.92 inches of rain, 417 percent of normal. On Maui, the heavy rains caused flooding and mudslides on the windward side of the island with some locations observing more than 5 inches of rain on the 12th and 13th. Kahului recorded 1.24 inches of rain, 326 percent of normal, and the sixth wettest September since records began there in 1905.
- Below-average precipitation was observed across parts of the West Coast, Central Rockies, Southeast and Northeast. Maine and Vermont each had monthly precipitation totals that were much below average. The warm and dry conditions in the Northeast contributed to expanding and intensifying drought conditions. Some parts of New England are experiencing one of their worst droughts in over 50 years.
- According to the October 4 U.S. Drought Monitor report, 19.4 percent of the contiguous U.S. was in drought, down about slightly compared to the end of August. Drought conditions worsened and expanded across parts of the Southeast, Northeast and Great Basin. Drought reduction was observed across parts of the Southwest, Midwest and Great Plains.
- Climate Highlights — year-to-date (Jan-Sep)
 Jan-Sep Average Temperature Departures |
 Jan-Sep Percent of Average Precipitation |
Temperature
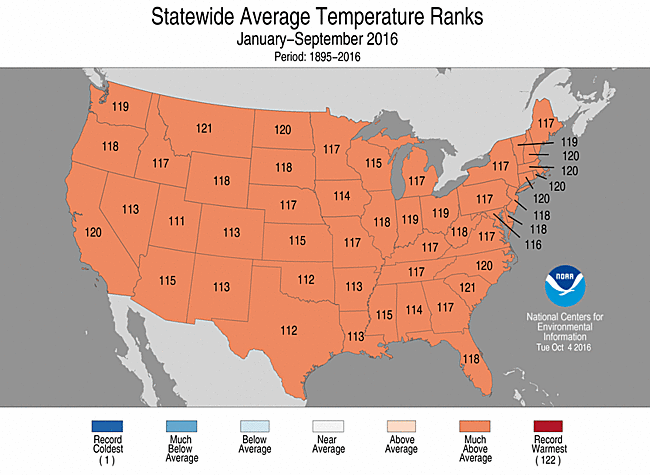
Jan-Sep Statewide Temperature Ranks
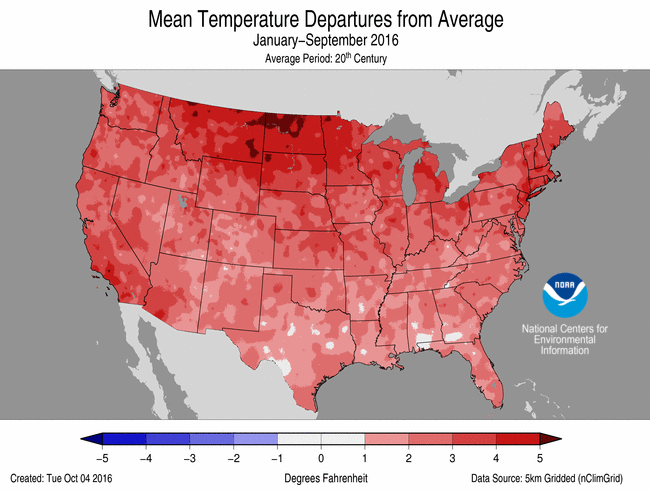
- The year-to-date (January-September) contiguous U.S. average temperature was 57.8°F, 2.8°F above average, making it the second warmest on record, behind only 2012.All 48 states across the contiguous U.S. observed much-above-average temperatures for the first nine months of the year. No state in the contiguous U.S. had a record warm year to date.
- The Alaska year-to-date temperature was 37.0°F, 6.9°F above average, surpassing the previous record warm January-September of 1926 by 2.8°F. Record and near-record warmth engulfed Alaska for much of 2016.
- The contiguous U.S. average maximum (daytime) temperature during January-September was 69.8°F, 2.5°F above the 20th century average, the fifth warmest on record. Every state across the Lower 48 had an above-average maximum temperature for the year to date with much-above average maximum temperatures across the West, Central and Northern Plains, Upper Midwest, Northeast, and Southeast.
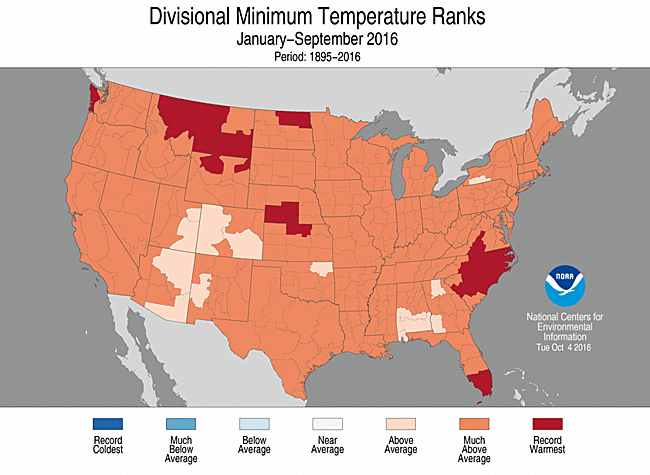
- The contiguous U.S. average minimum (nighttime) temperature during January-September was 45.8°F, 3.0°F above the 20th century average, the second warmest on record. Only in 2012 was the January-September minimum temperature was warmer at 46.1°F. Every state across the Lower 48 had a much-above-average minimum temperature with record warm minimum temperatures observed across parts of the Northern Rockies and Plains, Central Plains, and Southeast.
- Based on REDTI, the contiguous U.S. temperature-related energy demand during January-September was 44 percent below average and the 16th lowest value on record.
Precipitation
- The year-to-date (January-September) contiguous U.S. precipitation total was 24.77 inches, 1.57 inch above average, and the 19th wettest.
- Above-average precipitation was observed across parts of the Great Plains, Lower Mississippi Valley and Midwest. Kansas, Louisiana, Michigan, Minnesota, Texas and Wisconsin were much wetter than average. Below-average precipitation fell across parts of the Southwest, Southeast, and Northeast where Connecticut and Massachusetts were much drier than average. No state was record wet or record dry for the year-to-date.

Jan-Sep Statewide Precipitation Ranks
Extremes
- The U.S. Climate Extremes Index (USCEI) for the year to date was 65 percent above average and the fifth highest value on record. On the national scale, extremes in warm maximum and minimum temperatures, the spatial extent of wetness and one-day precipitation totals were above average. The USCEI is an index that tracks extremes (falling in the upper or lower 10 percent of the record) in land-falling tropical cyclones, temperature, precipitation and drought across the contiguous U.S.
- Regionally, extremes were much above average in the Northeast, Southeast, Ohio Valley, South, and the Northern Rockies and Plains. In the Northeast, Ohio Valley, and Northern Rockies and Plains, extremes in warm maximum and minimum temperatures were much above average. In the Southeast extremes in warm minimum temperatures were elevated, while in the South extremes in warm minimum temperatures, spatial extent of wetness, and one-day precipitation totals were much above average. In the Ohio Valley, the year to date saw the second highest CEI on record due to extremes in warm minimum temperatures, the spatial extent of wetness, one-day precipitation totals, and the number of days with precipitation.
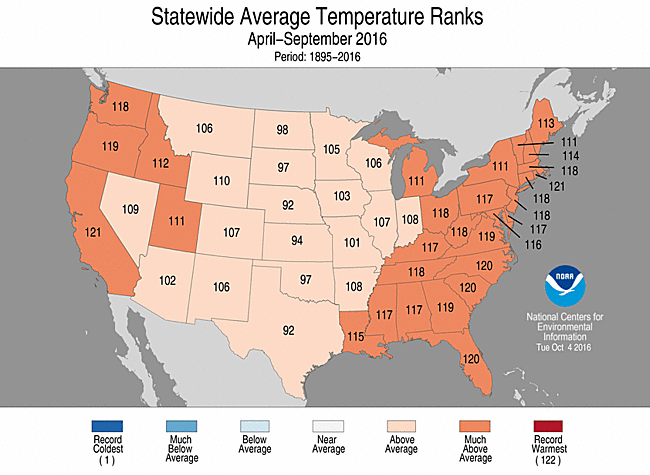
- Climate Highlights — warm season (Apr-Sep)
 Apr-Sep Average Temperature Departures |
 Apr-Sep Percent of Average Precipitation |
Temperature
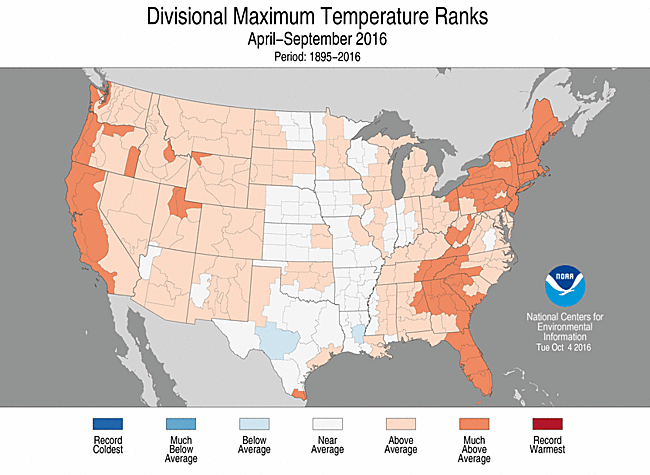
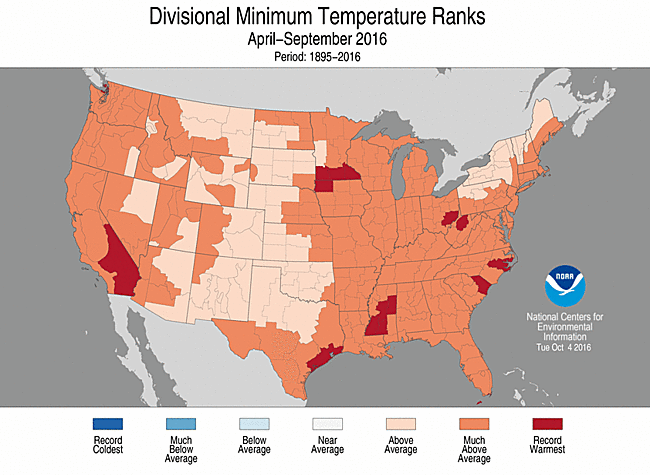
- The warm season (April-September) contiguous U.S. average temperature was 66.9°F, 1.8°F above average, making it the fifth warmest on record. Every state had an above-average warm season temperature with much-above-average temperatures across the Far West, and much of the country east of the Mississippi.
- The Alaska warm season temperature was 46.7°F, 4.5°F above average, surpassing the previous record warm April-September of 2004 by 0.5°F.
- The contiguous U.S. average maximum (daytime) temperature during April-September was 79.4°F, 1.5°F above the 20th century average, the 12th warmest on record. Above-average maximum temperatures were observed for most regions, except the Southern and Central Plains and parts of the Midwest which saw near-average warm-season maximum temperatures. Much-above-average maximum temperatures were observed along the West Coast and most of the East Coast.
- The contiguous U.S. average minimum (nighttime) temperature during April-September was 54.4°F, 2.2°F above the 20th century average, the second warmest on record. Only in 2015 was the April-September minimum temperature marginally warmer. Every state across the Lower 48 had an above-average minimum temperature with record warm minimum temperatures across parts of California, the Midwest, Southern Plains, Southeast, and Midwest.
- Based on REDTI, the contiguous U.S. temperature-related energy demand during April-September was 87 percent above average and the second highest value on record.
Apr-Sep Statewide Temperature Ranks
Precipitation
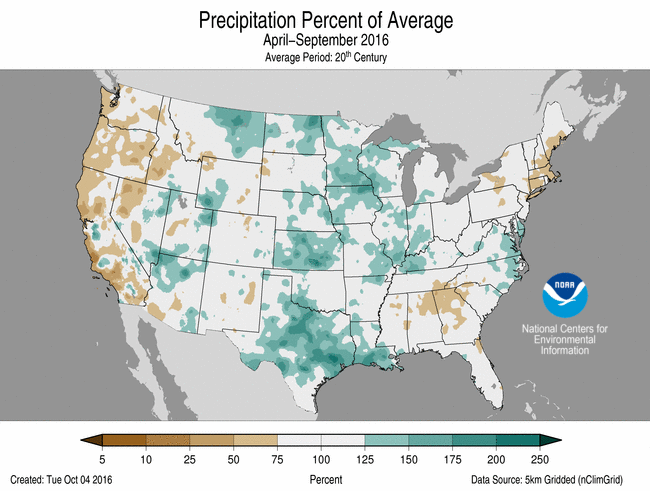
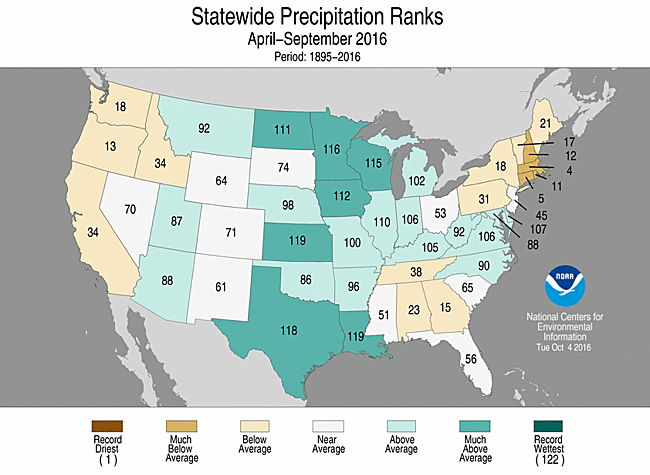
- The warm season (April-September) contiguous U.S. precipitation total was 17.80 inches, 1.56 inch above average, and the 15th wettest.
- Above-average precipitation was observed across much of the Great Plains and parts of the Southwest, Northern Rockies, Midwest, and Mid-Atlantic. Seven states from Texas to North Dakota observed much-above-average warm season precipitation.
- Below-average precipitation was observed along the West Coast, parts of the Southeast, and Northeast. Connecticut, Massachusetts, New Hampshire, and Rhode Island were much drier than average.
Apr-Sep Statewide Precipitation Ranks
Extremes
- The USCEI for the warm season was 20 percent above average and the 23rd highest value on record. On the national scale, extremes in warm maximum and minimum temperatures were above average.
- Regionally, extremes in the Upper Midwest and Southeast were much above average, driven in large part to extremely warm maximum and minimum temperatures.
**A comparison of the national temperature departure from average as calculated by NCDC's operational dataset (nClimDiv), the U.S. Historical Climatology Network (USHCN), and the U.S. Climate Reference Network (USCRN) is available on our National Temperature Index page.**
Regional Highlights:
These regional summaries were provided by the six Regional Climate Centers and reflect conditions in their respective regions. These six regions differ spatially from the nine climatic regions of the National Centers for Environmental Information.
- Northeast Region: (Information provided by the Northeast Regional Climate Center)
- On the heels of a record-warm August, the Northeast had its third warmest September on record. The average temperature of 64.8 degrees F (18.2 degrees C) was 4.2 degrees F (2.3 degrees C) above normal. Delaware, Massachusetts, and Rhode Island had their third warmest September on record, while Connecticut, Maine, Maryland, New Jersey, New York, and West Virginia had their fourth warmest. This September ranked as fifth warmest on record for Pennsylvania, seventh warmest for New Hampshire, and eighth warmest for Vermont. State departures ranged from 3.3 degrees F (1.8 degrees C) above normal in New Hampshire to 5.4 degrees F (3.0 degrees C) above normal in West Virginia. Dulles Airport, Virginia and Worcester, Massachusetts had their warmest Septembers on record.
- The Northeast wrapped up September on the dry side of normal. The region picked up 2.77 inches (70.36 mm) of precipitation, 71 percent of normal. Ten states were drier than normal, with three ranking this September among their top eighteen driest: Maine, 5th driest; Vermont, 12th driest; and Connecticut, 18th driest. Maryland and Delaware were wetter than normal, with Delaware having its fourth wettest September on record. Precipitation for all states ranged from 39 percent of normal in Maine to 206 percent of normal in Delaware.
- The September 1 U.S. Drought Monitor showed 27 percent of the Northeast was experiencing moderate, severe, or extreme drought, with another 31 percent being abnormally dry. With above-normal temperatures and below-normal precipitation, conditions deteriorated during the month. The U.S. Drought Monitor released on September 29 indicated 40 percent of the Northeast was in a moderate, severe, or extreme drought, with another 38 percent being abnormally dry. In early September, Pennsylvania upgraded four counties to a drought watch. Southeastern Massachusetts was upgraded to a drought warning, while Cape Cod was upgraded to a drought watch. In early to mid-September, more than 175 Massachusetts water suppliers, more than 115 New Hampshire water systems, and several communities in other drought-affected areas had water bans and/or restrictions in place. Streamflow, reservoir, and groundwater levels continued to be below normal. For the September 14-21 period, preliminary data from USGS indicated more than 45 waterways in New England and more than 15 waterways in the rest of the region (with at least 30 years of data) had record or near-record low 7-day average streamflow. Preliminary data for the same period also indicated record-low daily water levels for more than fifteen USGS well sites in the Northeast. Private wells continued to run dry, and some communities, including Worcester, began buying water from the Massachusetts Water Resources Authority. Some farmers had to haul in water for irrigation and livestock due to low or dried up water supplies, while cranberry growers in Massachusetts were concerned that they wouldn't have enough water to protect their crops from frost or harvest their crop. Dry conditions continued to impact pastures and yields of soybeans, corn, and hay. Farmers in more drought-stricken counties became eligible for federal aid.
- The remnants of Tropical Cyclone Hermine brought gusty winds, rough surf, and rip currents to coastal areas during Labor Day weekend. Impacts included closed beaches, some beach erosion, and downed trees and power lines. September featured several rounds of severe thunderstorms. There was one tornado, an EF-1 in Pennsylvania. Straight-line winds of up to 100 mph (45 m/s) damaged hundreds of trees and caused structural damage in parts of Pennsylvania, New York, and Massachusetts. Golf ball-sized hail fell in West Virginia. From September 28 to 30, a heavy rain event impacted southern parts of the region. The greatest rain total from the storm was 13.89 inches (352.81 mm) in Sussex County, Delaware. Flooding led to numerous closed roads, school closures, some evacuations, and reports of flooded structures.
- For more information, please go to the Northeast Regional Climate Center Home Page.
- Midwest Region: (Information provided by the Midwest Regional Climate Center)
- September temperatures were above normal across the Midwest. Temperature departures ranged from 1 to 5 degrees F (1 to 3 C) above normal from central Minnesota to southeast Ohio. Minimum temperature departures were slightly warmer than the maximum temperatures departures in most of the region. For the region as a whole, September ranked as the 7th warmest since 1895. Ohio statewide temperature set a new record and six other Midwest states ranked among the warmest 10% of their histories. Statewide departures above normal ranged from 3.1 degrees F (1.7 C) in Minnesota to 5.0 degrees F (2.8 C) in Ohio. September joined March 2016 with regionwide temperatures among the warmest 10 percent. At least one statewide temperature ranked among the warmest 10 percent in February (1 state), March (all 9), June (2), August (4), and September (7). The year-to-date temperature for the region ranks as the 5th warmest with all nine states also ranking among their top 10 warmest.
- September precipitation fell in large amounts on multiple occasions. Widespread totals topped 5.00 inches (127 mm) in parts of seven Midwest states, missing only Indiana and Kentucky. Totals topped 10.00 inches (254 mm) where Minnesota, Iowa, and Wisconsin come together. Totals were more than three time normal in this area with departures exceeding 8 inches (203 mm). Despite the large totals in widespread locations, all nine states had areas with below normal rainfall, including nearly all of Kentucky. Charles City, Iowa in Floyd County topped its September record and its annual record, the latter with three months remaining in the year (133 year period of record).
- Major flooding affected Iowa and Wisconsin due to heavy rains from the 20th-24th. Soils were already wet due to earlier rains in August and early September. With rainfall totals ranging from 5 to 9 inches (127 to 229 mm), rivers quickly rose to major flood stage in both northeast Iowa and southwest Wisconsin. Flood waters flowed into the Mississippi River and levels rose to minor flood levels as far south as Burlington, Iowa as the month came to a close.
- Midwest drought eased in September with most of the affected area in Ohio. The percentage of the state of Ohio in drought dropped from about 20 percent at the onset of September to less than 8 percent by the end of the month. Abnormally dry regions, primarily in the eastern half of the Midwest, dropped through the early and middle parts of September but increased sharply in the last week of the month to more than 10 percent of the region.
- Crop conditions were rated good or excellent for much of the Midwest corn and soybean crops. Crop maturity was near or slightly ahead of the 5-year averages according to NASS Crop Progress reports on October 2nd. Rains prevented field work in some locations but statewide harvest was running near or slightly behind the 5-year averages in the Midwest. Median first frost dates for September include much of Minnesota and Wisconsin along with parts of Iowa and Michigan, however September 2016 saw frost limited to just a fraction of this area.
- For further details on the weather and climate events in the Midwest, see the weekly and monthly reports at the Midwest Climate Watch page.
- Southeast Region: (Information provided by the Southeast Regional Climate Center)
- Temperatures were well above average across the Southeast region, with numerous extremes observed during September. Mean temperature departures were 3 to 6 degrees F (1.7 to 3.3 degrees C) above average across the interior portion of the region, while much of Florida and coastal portions of the region were 1 to 4 degrees F (0.6 to 2.2 degrees C) above average. At least 74 long-term (i.e., period of record exceeding 50 years) stations across the region, with at least 7 stations in every state, observed September mean temperatures that were ranked within the top 3 warmest values on record. Tampa, FL (1890-2016) observed its warmest September mean temperature on record (83.8 degrees F; 28.8 degrees C), and Charleston, SC (1938-2016) tied its warmest September mean temperature on record (79.8 degrees F; 26.6 degrees C). The persistence of daytime heat and nighttime warmth was exceptional for several locations during the month. Montgomery, AL (1872-2016) observed its highest count of 27 days during September with a maximum temperature at or above 90 degrees F (32.2 degrees C), while Greenville-Spartanburg, SC (1884-2016) recorded its second highest count of 25 days during September with a maximum temperature at or above 85 degrees F (29.4 degrees C). Tampa, FL recorded its highest count of 27 days during September with a minimum temperature at or above 75 degrees F (23.9 degrees C), while Charleston, SC observed its second highest count of 24 days during September with a minimum temperature at or above 70 degrees F (21.1 degrees C). Temperatures were above average in Puerto Rico and the U.S. Virgin Islands during the month, as Juncos, PR (1931-2016) observed its fourth warmest September mean temperature on record (82.3 degrees F; 27.9 degrees C). Across the Southeast, the warmest weather of the month occurred from the 7th through the 10th, as the Bermuda High expanded westward across the region. During this four-day period, daily maximum temperatures exceeded 90 degrees F across much of the region, with numerous interior locations reaching the middle-to-upper 90s F (34.4 to 37.2 degrees C). In contrast, the coolest weather of the month occurred from the 28th through the 30th, as an upper level low pressure system ushered in seasonably cool air from the northwest. Nighttime minimum temperatures fell below 60 degrees F (15.6 degrees C) across interior portions of the region, with several locations in northern Alabama and Georgia reaching the upper 40s F (8.3 to 9.4 degrees C).
- Precipitation was highly variable across the Southeast region during September, with numerous extremes recorded. The driest locations were found across northern and central Alabama, northern and west-central Georgia, Upstate South Carolina, and western North Carolina. Monthly precipitation totals ranged between 50 to less than 5 percent of normal in these areas. Cedartown, GA (1936-2016), a town located about 50 miles northwest of Atlanta, observed its first month on record with no measurable precipitation. Belle Mina, AL (1949-2016), a town located about 15 miles southwest of Huntsville, observed its driest September on record with only 0.15 inches (3.8 mm) of precipitation. In contrast, the wettest locations were found in west-central Virginia and a broad area extending northeastward from the Big Bend of Florida to eastern Virginia. Monthly precipitation totals were between 150 and 400 percent of normal in these areas. Richmond, VA (1887-2016) and Norfolk, VA (1874-2016) observed their second wettest September on record with 11.19 and 13.54 inches (284 and 344 mm) of precipitation, respectively. On the 2nd, Hurricane Hermine made landfall as a category 1 storm near St. Marks, FL, with maximum sustained winds of 80 mph. Cross City, FL (1948-2016) observed its wettest September day and fifth wettest day for any month on record with 7.40 inches (188 mm) of precipitation. Wilmington, NC (1871-2016) observed its fourth wettest September day and sixth wettest day for any month on record with 7.78 inches (198 mm) of precipitation. At least one station in every state except Alabama recorded a storm total rainfall exceeding 6 inches (152 mm), with the highest amount of 18.89 inches (480 mm) recorded by the Baskin 1 SSE station in Pinellas County, FL. As Tropical Storm Julia moved northward along the Atlantic coast of Florida on the 13th and 14th, Sapelo Island, GA (1957-2016) observed its wettest September day and fourth wettest day for any month on record with 5.62 inches (143 mm) of precipitation. As a low pressure system stalled out over the region on the 29th, Wallops Island, VA (1950-2016) observed its wettest day for any month on record with 7.36 inches (187 mm) of precipitation. Precipitation was generally above normal in northwestern Puerto Rico and below normal across the remainder of Puerto Rico and the U.S. Virgin Islands. Coloso, PR (1905-2016) observed its driest September on record with only 2.65 inches (67.3 mm) of precipitation.
- There were 178 severe weather reports across the Southeast during the month, which is well above normal (based on the median frequency of 104 reports for September during 2000-2015). At least one severe weather report was recorded within the region on 15 days during the month, but nearly 50 percent of the reports (86 of 178) occurred on just two of these days (28th and 29th). The greatest number of reports by state was recorded in Virginia (58; 33 percent of total) and North Carolina (56; 31 percent of total). On the 28th, severe thunderstorms across central North Carolina and Virginia produced several reports of large hail, including 3-inch (tea cup-sized) hail in Halifax County, VA and 2.5-inch (tennis ball-sized) hail in Caswell County, NC. On the 29th, strong thunderstorm winds caused a tree to fall onto a pickup truck at a residence in Shenandoah County, VA, killing a man outside the vehicle. Ten tornadoes (6 EF-0s, 4 EF-1s) were confirmed across the region during the month, which is slightly below the short-term (2000-2015) median frequency of 13 tornadoes observed during September. Nine of these tornadoes were spawned by Hurricane Hermine during the first three days of the month, and the other tornado was produced by Tropical Storm Julia on the 13th. Early on the 3rd, an EF-0 tornado touched down in Hatteras Village, NC. Three injuries occurred when the tornado damaged several travel trailers and camping cabins at an RV resort. Three people were injured by lightning strikes in Florida during the month.
- Drought conditions intensified and expanded in coverage across much of the Southeast region during September, especially in Alabama, Georgia, and North Carolina. The coverage of moderate-to-extreme (D1-D3) drought in Alabama increased by 20 percent during the month, while extreme-to-exceptional (D3-D4) drought expanded by 10 percent in coverage across northern Georgia. Exceptional drought conditions developed in a small area of northwestern Georgia at the end of the month, which is the first time since February 2013 that this drought designation has occurred anywhere in the state. Moderate drought spread across much of western North Carolina and Upstate South Carolina during the latter half of September. A small area of southeastern Puerto Rico remained in moderate drought during the month. Dryland crops, particularly soybeans, were highly stressed by excessive heat and dryness across interior portions of the region. Farmers in Georgia and Alabama struggled to dig up peanuts from hard soils that received little rainfall during the month. Pastures and hay fields, plagued by drought and armyworm infestation, remained in very poor condition across the region, with some livestock producers in Georgia and North Carolina having to sell off their cattle due to a shortage of hay. Though approximately 25 percent of pecan trees (loaded with nuts prior to harvest) in southern Georgia were affected by Hurricane Hermine's strong winds, yields are expected to be good this year, as the lack of summer rainfall prevented a widespread threat of pecan scab disease.
- For more information, please go to the Southeast Regional Climate Center Home Page.
- High Plains Region: (Information provided by the High Plains Regional Climate Center )
- The fall season got off to a warm start across the High Plains, with temperatures ranging from near normal in Wyoming to 3.0-5.0 degrees F (1.7-2.8 degrees C) above normal in the eastern High Plains and Colorado. It was especially warm in Colorado, as Pueblo tied for its 5th warmest September, while Colorado Springs experienced its 7th warmest on record. Precipitation varied throughout the area, with wet conditions across the western and eastern High Plains and dryness in the central part of the region. Kansas and North Dakota have especially been wet over the past few months, as some locations have continued to set top 10 records. For instance, Wichita, Kansas had its 2nd wettest July, 4th wettest August, and 2nd wettest September on record this year. As of the end of September, Wichita had received 47.64 inches (1210 mm) of precipitation since January 1, which is enough precipitation to become the 3rd wettest year on record with three months left in the year. On the dry side, Colorado continued to experience below-normal precipitation, which resulted in the drying of topsoil and subsoil across the state. Drought conditions worsened in northwestern Wyoming, which experienced low streamflows and increased wildfire activity. According to the National Park Service, Yellowstone National Park had its most active fire year since 1988 with 62,000 acres burned.
- The growing season has nearly ended throughout the region, and harvest is now in full swing. For the most part, row crops and pasture conditions fared well this year due to ample moisture and the lack of widespread drought conditions. In fact, according to the U.S. Department of Agriculture, record-high corn and soybean production is expected in the U.S. this year, thanks to favorable weather and excellent field conditions. Corn and soybean harvest got off to a decent start across much of the region due to warm temperatures and late-September dryness, and spring wheat harvest wrapped up early. However, persistent wetness slowed the sugar beet harvest in North Dakota, while dry conditions in South Dakota delayed the planting of winter wheat.
- Temperature departures were back to above normal in September throughout the majority of the High Plains. The warmest locations included central and eastern Colorado, eastern Nebraska, and eastern Kansas, where temperatures were 3.0-5.0 degrees F (1.7-2.8 degrees C) warmer than normal. The warmth was most impressive in Colorado, where top 10 records for warmest September were set in Pueblo (tied for 5th warmest) and Colorado Springs (7th warmest). While locations in eastern Nebraska and eastern Kansas did not experience record-breaking warmth for the month as a whole, a few daily record highest maximum temperature and record highest minimum temperature records were set. A big warmup occurred on the 20th and brought high temperatures above 90.0 degrees F (32.2 degrees C) to these areas. Daily maximum temperature records were set in Kansas at Garden City and Salina, as well as in Nebraska at Lincoln, Omaha, and North Platte. On the 21st, low temperatures did not dip below 70.0 degrees F (21.1 degrees C) in several places, and Omaha, Lincoln, and Garden City set records for daily highest minimum temperature.
- It is that time of year when the first fall freeze often occurs, which has implications for agriculture and horticulture. Locations that experienced their first freeze of the fall season in September included Alamosa, Colorado; Williston, North Dakota; Casper, Wyoming; and Laramie, Wyoming. These freezes occurred very close to the dates of median first 32.0 degrees F (0.0 degrees C) freeze for these locations. However, Rawlins, Wyoming experienced its 4th earliest hard freeze (defined as 28.0 degrees F, or -2.2 degrees C) on record September 10th (period of record 1951-2016).
- The High Plains region continued to experience a mix of wet and dry conditions during September. One wet area extended from Wyoming northeastward through North Dakota, while a second wet area included northwestern and eastern Kansas, extending north and east to eastern Nebraska and southeastern South Dakota. In between these areas, it was much drier from Colorado northeastward through central Nebraska and South Dakota. Numerous top 10 records for wettest September were set, including Wichita, Kansas (2nd wettest); Williston, North Dakota (3rd wettest); Sioux Falls, South Dakota (3rd wettest); and Sheridan, Wyoming (5th wettest). In some of these areas, precipitation was greater than 250 percent of normal. As for dryness, areas of Colorado, central Nebraska, and central South Dakota received 25 percent of normal precipitation, at best. However, the fall season tends to be a drier time of year in the High Plains, and dry conditions are welcomed by farmers who are amidst harvest.
- One major precipitation event that occurred in the region in September was flooding in south-central Kansas due to a system that impacted the area from the 7th through the 10th. A moist atmosphere combined with several upper-level disturbances to produce storms that continued to redevelop and train over the same areas. According to the National Weather Service Weather Forecast Office in Wichita, rainfall rates of 3.00-5.00 inches (76-127 mm) per hour were reported, which resulted in flooding that led to numerous roads being closed, stranded vehicles, and water rescues. Several rivers and streams swelled out of their banks, and a record-high crest occurred on the Ninnescah River near Belle Plaine. The city of Clearwater, which is southwest of Wichita, received the greatest amount of precipitation. By the time the flooding event ended, over a foot of rain had fallen in this area. The highest amounts were recorded on the 9th, as several CoCoRaHS observers reported 24-hour rainfall totals of 6.00-10.00 inches (152-254 mm).
- During the fall, the replenishment of soil moisture is very important as we prepare to enter winter dormancy. As a result of ample rainfall received by parts of the region during September, topsoil and subsoil moisture improved over the course of the month. This included North Dakota, South Dakota, and Wyoming, where drought has been present. However, soil moisture in Colorado declined in September due to prolonged dryness.
- Streamflow in September in the High Plains followed a similar pattern to August, as below-normal streamflows could be found in the Upper Missouri River Basin, while the Lower Basin continued to experience above-normal streamflows. The lowest streamflows were in northwestern Wyoming where drought has been present since the end of August. Streamflow conditions in the Black Hills region of South Dakota improved during September, as did drought conditions thanks to much-needed rainfall. On the contrary, excessive wetness that has been present since July has caused streamflows to run high across eastern North Dakota and eastern Kansas. According to the National Weather Service, there is a greater than 50 percent chance for flooding from October-December in parts of the Lower Missouri Basin, which includes some streams in eastern Kansas.
- Overall, drought conditions in the High Plains improved slightly during September. The area experiencing drought or abnormal dryness (D0-D4) decreased from just over 32 percent to about 29 percent over the course of the month. The Black Hills region, which has endured the most intense drought conditions in the High Plains over the past few months, received beneficial rainfall during early September that alleviated the dryness. Rain also fell across central South Dakota during that time, resulting in the removal of moderate drought (D1). Farther south, drought conditions in south-central Nebraska improved, and the D1 in northwestern Kansas was removed.
- In the western High Plains, prolonged dryness caused drought to intensify in northwestern Wyoming. D1 was degraded to severe drought (D2) in early September. The U.S. Drought Monitor author for the September 6th map noted that baseflow in the headwaters of the Snake River was well below normal. In Colorado, continued dryness in the northeastern part of the state resulted in a slight expansion of D1 by mid-late September.
- Drought in South Dakota and Wyoming caused some impacts to agriculture and the environment. In South Dakota, pasture conditions suffered during the summer, and poor corn pollination was reported in the southeastern portion of the state. In northwestern Wyoming, drought was partly to blame for an extremely active fire year at Yellowstone National Park.
- For more information, please go to the High Plains Regional Climate Center Home Page.
- Southern Region: (Information provided by the Southern Regional Climate Center)
- September temperatures in the Southern Region were consistently above normal across the entire Southern Region. In western Texas, stations averaged between 0-2 degrees F (0-1.11 degrees C) above normal. Elsewhere, stations generally averaged between 2-4 degrees F (1.11–2.22 degrees C) above normal, except in northern Mississippi and parts of Tennessee where temperatures averaged 4-6 degrees F (2.22–3.33 degrees C) above expected values. The statewide monthly average temperatures were as follows: Arkansas reporting 75.90 degrees F (24.39 degrees C), Louisiana reporting 80.40 degrees F (26.89 degrees C), Mississippi reporting 79.20 degrees F (26.22 degrees C), Oklahoma reporting 75.60 degrees F (24.22 degrees C), Tennessee reporting 74.20 degrees F (23.44 degrees C), and Texas reporting 77.80 degrees F (25.44 degrees C). The state-wide temperature rankings for May are as follows: sixteenth warmest for Arkansas, ninth warmest for Louisiana, fifth warmest for Mississippi, twenty-second warmest for Oklahoma, eleventh warmest for Tennessee, and twentieth warmest for Texas. All state rankings are based on the period spanning 1895-2016.
- With the exception of western Texas and central Oklahoma, September was generally a drier than normal month. The remaining four states averaged below normal precipitation. Conditions were considerably dry in northern Mississippi, southern Arkansas and western Tennessee. A majority of the stations in that area averaged less than 50 percent of normal precipitation. In west central Texas and central Oklahoma, the opposite was observed, with many stations averaging over one and a half times the monthly average. The state-wide precipitation totals for the month are as follows: Arkansas reporting 1.75inches (44.45 mm), Louisiana reporting 3.47 inches (88.14 mm), Mississippi reporting 1.81 inches (45.97 mm), Oklahoma reporting 3.39 inches (86.11 mm), Tennessee reporting 1.84 inches (46.74mm), and Texas reporting 2.99 inches (75.95 mm). The state precipitation rankings for the month are as follows: for Arkansas it was the eighteenth driest, for Louisiana it was the fifty-ninth driest, for Mississippi it was the twenty-first driest, for Oklahoma it was the fiftieth wettest, for Tennessee it was the twentieth driest, and for Texas it was the fifty-fifth wettest. All state rankings are based on the period spanning 1895-2016.
- Dry conditions across the Southern Region has led to an expansion of drought coverage. Anomalously warm weather, combined with drier than normal conditions in Mississippi has resulted in the much of the state being categorized under moderate drought. In south eastern Tennessee, drought has also worsened. Counties there that were experiencing severe drought are now experiencing extreme drought.
- Because conditions were so dry, there wasn't a lot in the way of severe weather in the Southern Region for the month of September. There were a few reports of hail and high winds in southern Oklahoma and northern Texas on September 17, but no injuries or fatalities were reported. The USDA-NRCS office in Pulaski, Tennessee did report that drought conditions in middle Tennessee are beginning to have an impact as they have observed some cool season grass fields (Orchard grass and Tall Fescue) that are dead.
- In Texas, rainfall will likely affect the cotton crop across the state. Southeast Texas was hammered by late season rainfall that stalled farmers from getting into the fields to harvest. About 375,000 acres (1517.57 square km) have been damaged by rains and farmers are in dire need of a good season to continue to run their business. West Texas is faring better, however, and estimates are still leaning towards 6.6 million bales, 15 percent higher than last year; the High Plains are expected to account for 4.15 million of that, which would make 2016 the first year since 2010 that saw more than 4 million. During the warmer parts of the month, farmers in Central Texas had to worry about army worms in their field. In far south and northwest Texas, farmers missed out on the heavy rains and are expected to have a decent cotton season. Grocery prices continued to fall as crops have been doing well statewide over the past few years (Information provided by the Texas Office of State Climatology).
- Two separate rainfall events caused some housing and infrastructure damage in west Texas, knocking out power to 1,600 homes in Odessa, 4,500 in Snyder, and 2,600 in Cedar Park. The Texas Reds Festival, West Texas Fair & Rodeo, Old Settlers Reunion, and many sporting activities had below average attendance or delays due to inclement weather. Planning to help stem flooding in central Texas is ongoing in Round Rock, which is moving forward with a plan to construct two new dams at $20 million apiece. The State Climatologist does not expect La Ni�a to emerge following an El Ni�o this past year and Texas should continue to see above normal temperatures and rainfall through the winter (Information provided by the Texas Office of State Climatology).
- For more information, please go to the Southern Regional Climate Center Home Page.
- Western Region: (Information provided by the Western Region Climate Center)
- September showed characteristics typical of an autumn transition, with several low-pressure systems sweeping across the area bringing cooler temperatures and the first snow of the season for many locations. Temperatures were generally near or slightly cooler than normal west of the Rocky Mountains, and above normal precipitation was observed in a broad swath of the West stretching from San Diego, California, northeast to eastern Montana.
- During the first week of the month, a cold low-pressure system brought precipitation, over an inch in some locations, and several inches of early season snowfall to some mountainous areas of the Inland Northwest. Further south, remnant moisture from Hurricane Newton impacted southeast Arizona and southwestern New Mexico on the 6th -8th. Tucson received 1.25 in (32 mm) on the 7th and a monthly total of 1.60 in (41 mm), 124% of normal. Much of the West's above normal precipitation this month was associated with Hurricane Paine interacting with an upper level disturbance September 19th-23rd. San Diego observed 0.32 in (8 mm) for the month, all on the 19th-21st. This was 188% of normal and 13th wettest September since records began in 1939. In northern Arizona, Pipe Springs National Monument logged 2.87 in (73 mm), nearly all of which fell on the 21st-23rd. This was 295% of normal and the 2nd wettest September in a 54-year record. In the eastern Great Basin, Burley, Idaho, recorded 3.31 in (84 mm) precipitation for the month, 2.03 in (52 mm) of which fell on the 21st-23rd. This was 602% of normal and the wettest September since records began in 1948. Lewistown, Montana, observed 0.97 in (25 mm) related to Hurricane Paine remnants and a month total of 2.41 in (61 mm). This was 178% of normal and the 21st wettest September in a 121-year record.
- Drier than normal conditions were observed in California, southern Oregon, eastern Washington, northern Idaho, and the western Great Basin, not atypical for this time of year. Wenatchee, Washington, recorded 0.05 in (1 mm), 15% of normal. Drier than normal conditions were also observed in Colorado and scattered areas of the Southwest, where Colorado Springs logged 0.16 in (4 mm), 13% of normal and tied for 5th driest September since records began in 1948. Areas of abnormally dry conditions or increasing drought severity were indicated this month in the southeastern Great Basin, central Utah, southern Idaho, along the Idaho-Montana-Wyoming border, and in portions of northern Colorado. Improvements in drought conditions this month were made across large areas of Arizona and New Mexico, eastern Utah, and southeastern Montana.
- Much of the West observed slightly cooler than normal average temperatures for September with some pockets of temperatures more than 2 F (1.1 C) below normal. In southern Arizona, Ajo reported an average temperature of 83.3 F (28.5 C), 3.2 F (1.8 C) below normal. In western Nevada, Lovelock observed an average temperature of 61.6 F (16.4 C), 3.6 F (2 C) below normal and tied for the 10th coolest September on record. In the Pacific Northwest, temperatures at John Day, Oregon, averaged to 55.1 F (12.8 C), 4.7 F (2.6 C) below normal and the 7th coolest September since records began in 1903.
- Areas east of the Rocky Mountains and portions of central and northern California saw slightly to well above normal temperatures. Mt. Shasta City in northern California recorded an average temperature of 62.4 F (16.9 C), 1.9 F (1.1 C) above normal and the 19th warmest since records began in 1948. In eastern Colorado, Pueblo observed an average temperature of 69.8 F (21 C), 5.1 F (2.8 C) above normal and the 5th warmest September in a 63-year record.
- Many areas of Hawaii observed above normal precipitation this month, mostly related to weakening Hurricane Lester passing to the north of the Islands in the first week of the month as well as an upper level disturbance mid-month. Honolulu, Oahu, observed its second wettest September in a 77-year record. Honolulu received 2.92 in (74 mm) of rainfall, 417% of normal. On Maui, Kahului recorded 1.24 in (31 mm) for the month, 326% of normal and the 6th wettest September since records began in 1905. To the north, every major station in Alaska reported above normal temperatures for September. Along the Pacific Coast, Cold Bay observed its warmest September on record at 51.3 F (10.7 C), 3.2 F (1.8 C) above normal. In the Bering Sea, St. Paul Island also had its warmest September on record at 49.9 F (9.9 C), 4.6 F (2.6 C) above normal. Records for Cold Bay began in 1950 and St. Paul Island in 1892. Precipitation was near normal across most of the state, though in the interior of the state, Bettles observed its wettest September in a 66-year record with 5.34 in (136 mm), 280% of normal.
- September 25-27: Coastal California heat wave: During the last week of September, synoptic conditions favored significant heating over coastal central and southern California producing average temperatures 10-15 F (5-8 C) above normal. Peak high temperatures on the 26th reached 101 F (38.3 C) in San Diego, 104 F (40 C) in Los Angeles, 101 F (38.3 C) in Santa Barbara, and 96 F (35.6 C) in Monterey. While these high temperatures are not unprecedented, they are uncommon for the coastal area.
- September 12-13: Flooding on windward side of Maui, Hawaii: Tropical moisture interacting with an upper level low-pressure system produced heavy rainfall. Some areas of windward Maui observed 5+ in (127+ mm) of rainfall during the event resulting in damaging floods, mudslides, and rockfalls that blocked roads and inundated homes.
- For more information, please go to the Western Regional Climate Center Home Page.