Note: This Synoptic Discussion describes recent weather events and climate anomalies in relation to the phenomena that cause the weather. These phenomena include the jet stream, fronts and low pressure systems that bring precipitation, high pressure systems that bring dry weather, and the mechanisms which control these features — such as El Niño, La Niña, and other oceanic and atmospheric drivers (PNA, NAO, AO, and others). The report may contain more technical language than other components of the State of the Climate series.
Summary
| Time Period | Key Driver | Other Drivers |
|---|---|---|
| Month | NAO, AO | WP |
| August 1-7 | WP | NAO, AO |
| August 8-14 | AO, NAO | EP–NP |
| August 15-21 | EP–NP | NAO, AO, WP |
| August 22-30 | WP | Dorian |
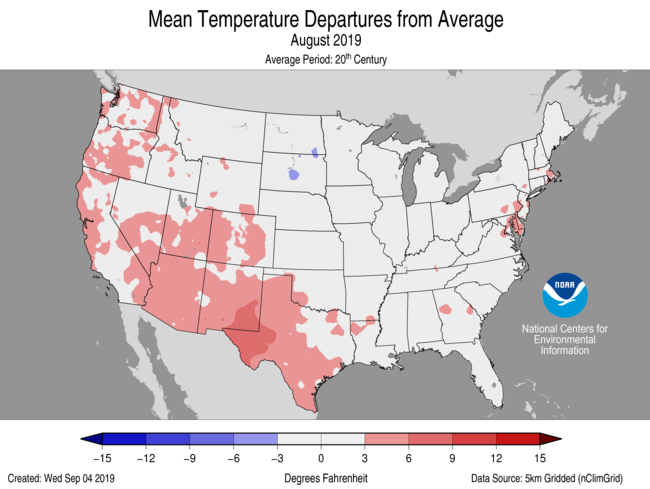
The synoptic pattern in August 2019 was dominated by the ebb and flow of a strong subtropical ridge centered near New Mexico. That ridge contributed to August being the second warmest on record in Texas, New Mexico, and Arizona. The ridge also suppressed the North American Monsoon, leading to particularly dry conditions across the Southwestern U.S. Several times throughout the month, the ridge extended farther north, west, or east, bringing the above normal temperatures to other portions of the country.
The primary teleconnections for the month were a negative Arctic Oscillation (AO) and a negative North Atlantic Oscillation (NAO). Both of these are generally associated with the above normal temperatures observed near Texas during August 2019. A negative AO is also associated with above-normal precipitation over the Central Plains, which may explain why Nebraska and Kansas each had their wettest years on record.
In the tropics, the El Niño–Southern Oscillation (ENSO) was an unusual flavor of neutral with warm ocean anomalies in the western ENSO region and cool anomalies in the east canceling one another. The most significant tropical cyclone for the U.S. during August was Hurricane Dorian. Dorian’s impacts on the contiguous U.S. will be included in next month’s report. During August, it brought strong winds and rain as a tropical storm to the U.S. Virgin Islands and Puerto Rico. In the following days, Dorian strengthened into one of the strongest hurricanes on record as it made landfall over the Bahamas.
Monthly Mean


Submonthly Evolution

August 1-7


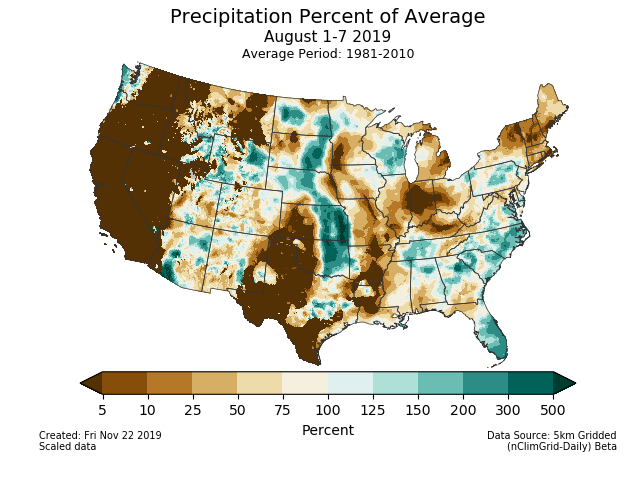
The beginning of August saw a return of the anomalous ridge over Alaska that has been a major player in North America for several months. Meanwhile, the contiguous U.S. was dominated by a ridge centered near New Mexico, which extended unusually far northwestward to the Pacific Northwest. This extension brought unusually warm conditions to the western U.S. It was also very dry, but not unusually so. A trough over the eastern U.S., on the other hand, brought cooler than average conditions to the Mississippi Valley.
August 8-14

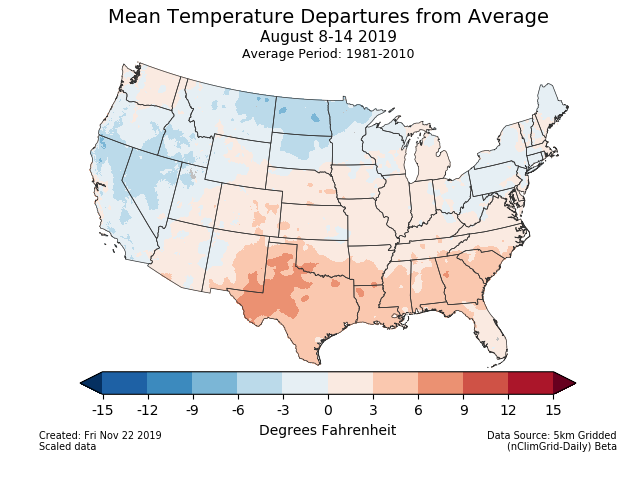
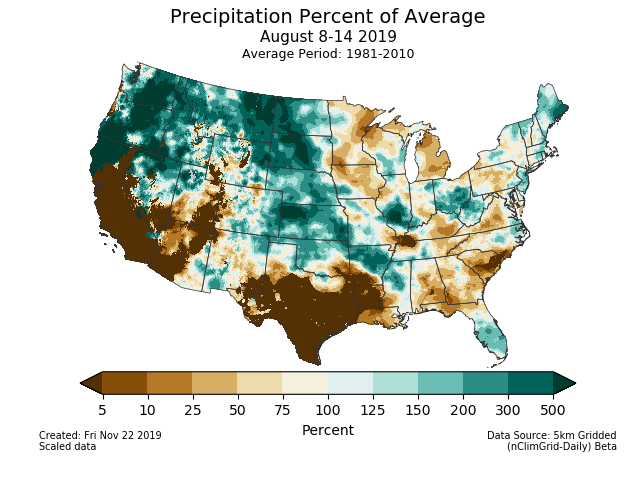
The ridge over the Southwest retreated during the second week of August as anomalous troughs developed along both coasts of the contiguous U.S. The West Coast trough was particularly impactful, bringing cooler than normal conditions there and enhanced rainfall to the Northern Rockies and the Northern Plains. Even though the Southwestern Ridge was more compact, it still contributed to warmer than normal temperatures across the South–Central U.S.
August 15-21

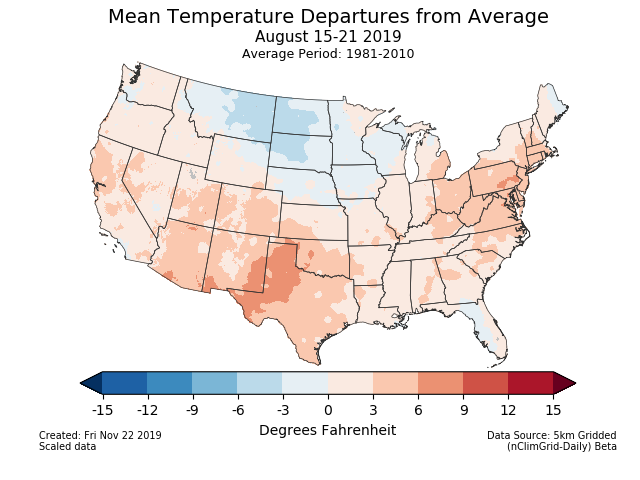
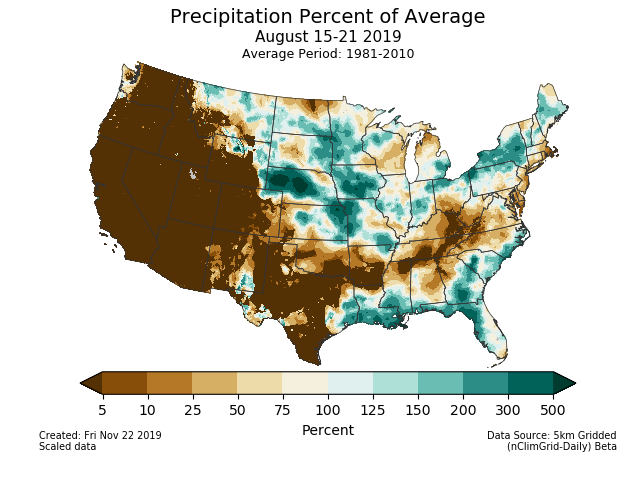
August 15–21 was dominated by a more zonal pattern across the contiguous U.S. The primary feature was a trough over Central Canada that brought below normal temperatures to the Northern Plains and wet conditions to Central and Northern Plains. The Southwestern ridge combined with an enhanced subtropical ridge over the Atlantic to bring warmer than normal temperatures from the Southwest to the Northeast. The western half of the contiguous U.S. to much of the Southeast were also drier than normal with this ridge.
August 22-30


The final week of August saw a shift westward in the atmospheric circulation over North America. The ridge that had been over Alaska moved across the Bering Sea to eastern Russia, leaving an enhanced trough over Alaska and northern Canada. The remnants of Tropical Storm Ivo in the eastern Pacific moved northward along the Baja coast, bringing warmer temperatures and a strengthening ridge on the West Coast. This also prolonged the dry conditions in the Southwest and the Central Rockies. A trough near the Great Lakes brought only slightly below normal temperatures to the Central U.S. but contributed wetter conditions from the Central Plains to the East Coast.
Atmospheric Drivers


- El Niño Southern Oscillation (ENSO)
- Description: Oceanic and atmospheric conditions in the tropical Pacific Ocean can influence weather across the globe. ENSO is characterized by two extreme modes: El Niño (warmer-than-normal sea surface temperature [SST] anomalies in the tropical Pacific) and La Niña (cooler-than-normal SST anomalies), with the absence of either of these modes termed “ENSO-neutral” conditions. These variations in SST change the locations of the Pacific’s largest thunderstorms, which can in turn change circulation patterns around the globe.
- Status: The ocean and atmosphere system reflected ENSO-neutral during August 2019. The most common metric for ENSO is the SST anomalies in the Central Pacific, the Niño 3.4 region. These stayed decreased from near +0.5°C to near 0°C over the course of the month. While Niño 3.4 is generally a good indicator of ENSO, in this case it straddled to extremes. The Niño 4 region in the western Pacific was near +0.8°C, while the Niño 3 region in the eastern Pacific was near −0.3°C.
- Teleconnections (influence on weather): The teleconnections with ENSO are generally weaker during the Summer months (see typical temperature and precipitation patterns for El Niño, for example). These impacts are further muted during ENSO-neutral, such as August 2019.
- Madden-Julian Oscillation (MJO)
- Description: The MJO is the biggest source of subseasonal (30–60 day) tropical variability. It typically develops as a large envelope of tropical thunderstorms that develops over the Indian Ocean that then moves eastward. Like ENSO, the MJO’s effects on tropical rainfall is so strong that it can alter the atmospheric circulation around the globe. The thunderstorms decay when they cross the Pacific, but the associated winds can often continue across the Western Hemisphere to initiate the next MJO in the Indian Ocean. The MJO is episodic, meaning that is not always active. Most indices for tracking the MJO identify both the MJO’s amplitude and the longitude of its strongest rainfall, usually described as one of eight phases.
- Status: The MJO was inactive throughout August. A convectively coupled Kelvin wave crossed the Pacific in early August before growing into a weak MJO signal over Africa and the Indian Ocean in the middle of the month. It returned the Pacific by the end of the month.
- Teleconnections (influence on weather): The MJO’s impacts on the US are typically smaller during August than other months. Even though it was weak, this MJO likely contributed the more favorable conditions in the Atlantic that fostered Hurricane Dorian. A weaker Kelvin wave toward the end of the month may have influenced the formation of Hurricane Juliette in the Eastern Pacific and Tropical Storm Fernand in the Atlantic.
- The Pacific/North American (PNA) pattern
- Description: The PNA teleconnection pattern is associated with strong fluctuations in the strength and location of the East Asian jet stream. PNA-related blocking of the jet stream flow in the Pacific can affect weather downstream over North America, especially the West and especially in the winter half of the year.
- Status: The daily PNA index was negative at the beginning of the month, positive in the middle of the month, and then neutral at the end of the month. On average, the PNA was strongly positive during August 2019 due primarily to the trough southwest of the Aleutians and the enhanced subtropical ridge over the Pacific.
- Teleconnections (influence on weather): A positive PNA would generally be associated with above-normal temperatures along the West Coast, but those only transpired at the beginning of the month while the PNA was negative.
- The Arctic Oscillation (AO) pattern
- Description: The AO teleconnection pattern generally measures the pressure difference between the low pressure over the North Pole and the higher pressures in the subtropical ridges. This pressure difference is larger during a positive AO, resulting in a stronger midlatitude jet. When the AO is negative, the jet is weaker and will have larger troughs and ridges.
- Status: The AO was negative during almost the entire month with just a brief period above zero around August 23–27. The negative AO was primarily due to ridges over Greenland and Siberia along with troughs in the Northeast Atlantic and Northwest Pacific.
- Teleconnections (influence on weather): A negative AO in August is typically associated with cooler than average temperatures over the Northern Plains and warmer temperatures over Texas. The cooler Northern Plains were most prominent during the middle of the month (August 8–14 and 15–21). Negative AO also favors enhanced precipitation over the Central Plains and drier conditions over Texas, both of which were common features during August 2019.
- The North Atlantic Oscillation (NAO) pattern
- Description: The NAO teleconnection pattern relates the pressure over the sub-polar low near Greenland and Iceland with the subtropical high over the Central Atlantic. It significantly affects the weather on both sides of the Atlantic.
- Status: The daily NAO was strongly negative for the first half of the month and then near-neutral for the second half. The negative NAO was due primarily to the ridge over Greenland and the trough over the northwestern Atlantic. Both of these features weakened significantly during the latter half of the month, resulting in the neutral NAO.
- Teleconnections (influence on weather): Negative NAO during August generally brings cooler than normal conditions to the northern Rockies and warmer than normal temperatures to the Southeast. August 2019 broadly followed this pattern, particularly in the middle of the month (August 8–14 and 15–21).
- The West Pacific (WP) pattern
- Description: The WP teleconnection pattern is a primary mode of low-frequency variability over the North Pacific and reflects zonal and meridional variations in the location and intensity of the East Asian jet stream in the western Pacific.
- Status: The monthly WP index was very strongly negative, due primarily to the anomalous trough over the Sea of Okhotsk and the ridge over eastern Russia. Both of those features were strongest during the first half of the month.
- Teleconnections (influence on weather): A negative WP is typically associated with warmer than normal temperatures near California and the Northeast. California was warmer than normal for most of August 2019, and the Northeast was particularly warm during August 15–21.
- The East Pacific-North Pacific (EP–NP) pattern
- Description: The EP-NP teleconnection pattern relates SST and upper-level circulation patterns (geopotential height anomalies) over the eastern and northern Pacific to temperature, precipitation, and circulation anomalies downstream over North America. Its influence during the winter is not as strong as during the other three seasons.
- Status: The monthly EP–NP index was negative due to the ridge over eastern Canada and the westward displacement of the Alaskan ridge, particularly during the first half of the month.
- Teleconnections (influence on weather): The negative phase of the EP–NP contains cooler than normal temperatures in the Pacific Northwest and warmer than average conditions across the North–Central U.S. Those conditions were most prominent August 8–14. In contrast, the following week featured both circulation and temperatures that more closely resembled a positive EP–NP.