National Overview

August Highlights


August Temperature
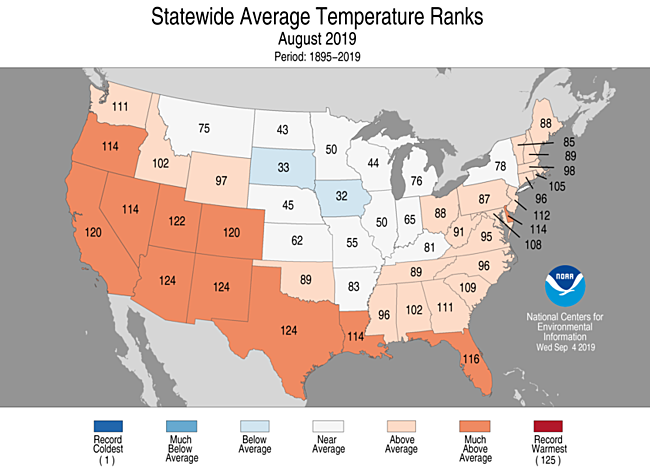
- The August contiguous U.S. temperature was 73.9°F, 1.8°F above the 20th century average and tied with 1955 as the 13th warmest August on record.
- Above- to much-above-average August temperatures were observed from the West Coast to the Deep South and from Florida to Maine. Arizona, New Mexico, and Texas each had their second warmest August on record, while Utah had its fourth warmest. The predominance of warmth across the West and Southwest can be attributed to record and near-record warm daytime high temperatures resulting from a persistent ridge centered near New Mexico.
- A trough over eastern North America funneled Canadian air masses into the U.S., keeping temperatures cooler than normal from the northern Plains to the Ohio valley in August.
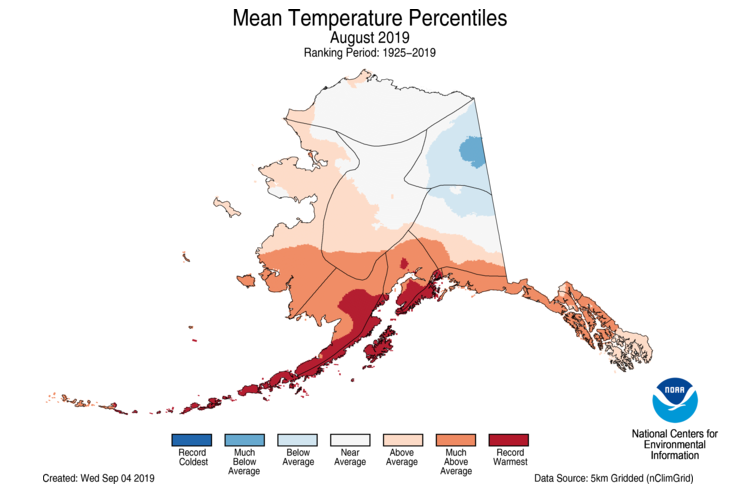
- The Alaska average August temperature was 51.6°F, 2.1°F above the long-term mean, ranking in the upper third of the 95-year period of record for the state. Kodiak and Cold Bay experienced their warmest August and month on record with average temperatures of 62°F and 57°F, respectively, which is approximately 1°F warmer than the previous records for any month at each of these locations. Anchorage and Iliamna also reported their warmest August on record. Cloud cover and rainfall contributed to near-to- and cooler-than-average conditions across parts of central, northern, and eastern Alaska.
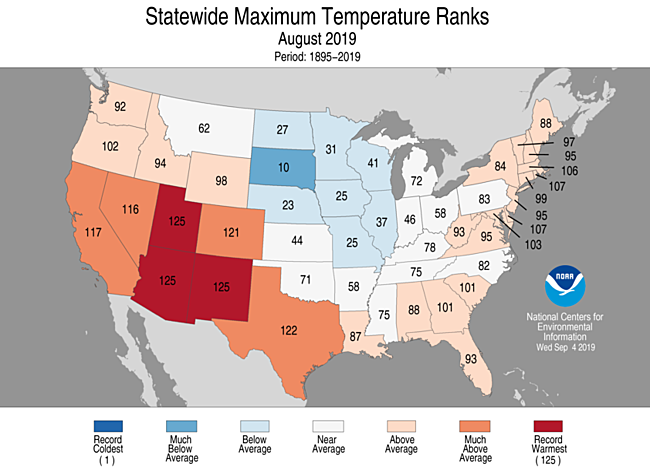
- The nationally averaged maximum temperature (daytime highs) was warmer than average during August at 86.5°F, 1.3°F above average, ranking in the top third of the 125-year record. Utah, Arizona, and New Mexico ranked record warmest for maximum temperatures in August, while parts of the Great Plains and Mississippi Valley saw cooler than average daytime high temperatures.
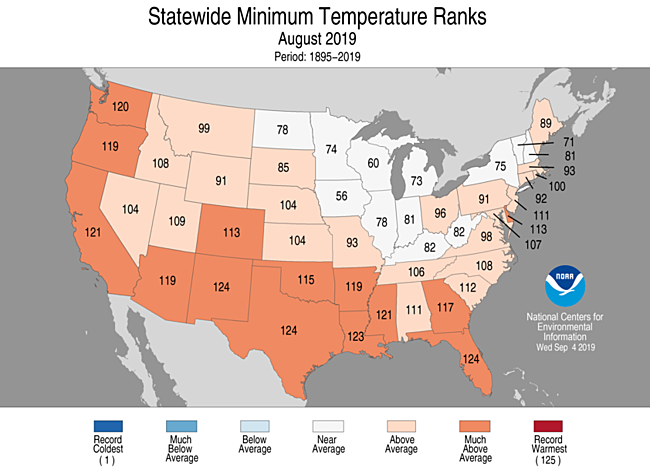
- The nationally averaged minimum temperature (overnight lows) during August was 61.3°F, 2.2°F above average, ranking sixth warmest in the 125-year record. New Mexico, Texas, and Florida ranked second warmest with 11 additional states' minimum temperatures ranking much-above-average. No state ranked below average for overnight low temperatures during August.
- As of September 10, there were 1,099 cold daily high (860) and low (239) temperature records tied or broken during August. This was roughly one-fifth of the approximately 5,218 daily warm high (2,035) and low (3,183) temperature records set during the month.
- Based on NOAA's Residential Energy Demand Temperature Index (REDTI), the contiguous U.S. temperature-related energy demand during August was 73 percent above average and ranked 18th highest in the 125-year period of record.
August Precipitation
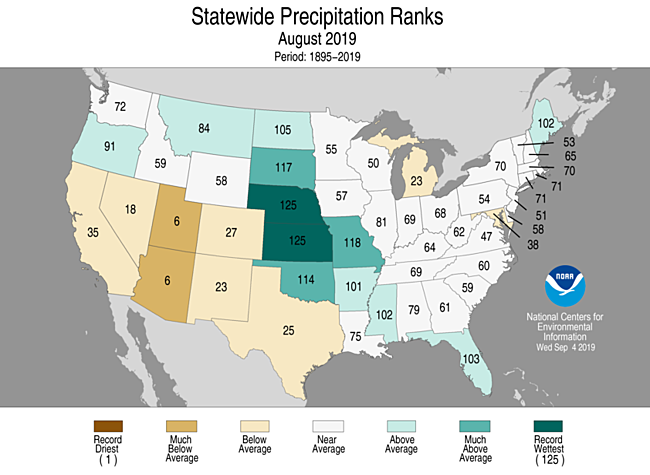
- The August precipitation total for the contiguous U.S. was 2.74 inches, 0.12 inch above average, and ranked in the middle third of the 125-year period of record.
- Above-average precipitation was observed across 12 states including Oregon and Maine and from the northern Plains to the Gulf Coast. Nebraska and Kansas were wettest on record for August.
- Below-average precipitation stretched from California to Texas and across parts of Michigan and Maryland. Arizona and Utah ranked sixth driest on record for August.
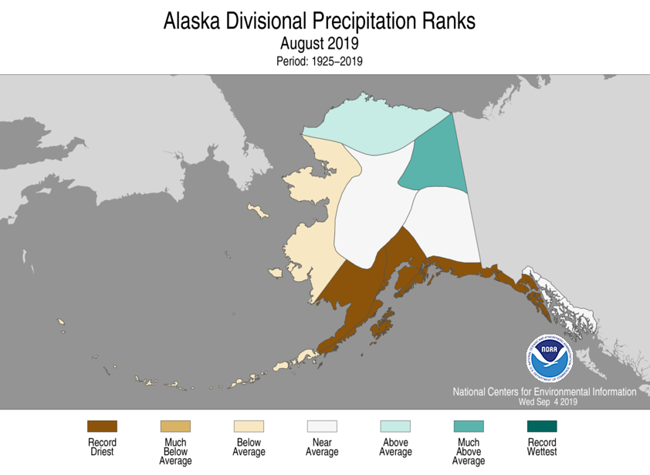
- In Alaska, it was the driest August on record at Anchorage, Kenai, Seward, King Salmon, Sitka, Talkeetna, and Yakutat. Contrasting with the dry conditions, Denali National Park Headquarters had its wettest August on record with 9.53 inches of precipitation reported.
- In late August, Hurricane Dorian developed from a tropical wave and brought heavy winds and rain to parts of Puerto Rico and the U.S. Virgin Islands.
- As Dorian continued its northwestward track into the open waters of the Atlantic Ocean, it strengthened significantly, eventually reaching Category 5 strength with peak sustained winds of 185 mph, making it one of the five strongest (based on wind speeds) hurricanes on record in the Atlantic Basin.
- On September 1, Dorian made initial landfall on Great Abaco Island in the Bahamas at Elbow Cay followed by Marsh Harbour later in the day, attaining peak wind intensity during landfall. Dorian’s 185-mph landfalling wind speed ties with the Labor Day Hurricane of 1935 as the strongest landfalling Atlantic hurricane on record.
- Dorian slowed to a crawl on September 2, still at Category 5 intensity, as the storm made landfall over Grand Bahama. Dorian’s eyewall hovered over Grand Bahama as the hurricane pummeled the island for more than 24 hours, prior to moving northwestward toward the contiguous U.S. East Coast as a relatively weaker, yet still strong, hurricane.
- According to the September 3 U.S. Drought Monitor report, 10 percent of the contiguous U.S. was in drought, up almost seven percent from the end of July. Drought conditions expanded or intensified across parts of the southern Plains, the Southwest, the middle Mississippi Valley, and across portions of the Great Lakes, while improvements were seen across parts of Hawaii and Puerto Rico. In Alaska, drought conditions improved across the Northeast Interior, but intensified in the south central portion of the state.
Summer Highlights


June-August Temperature

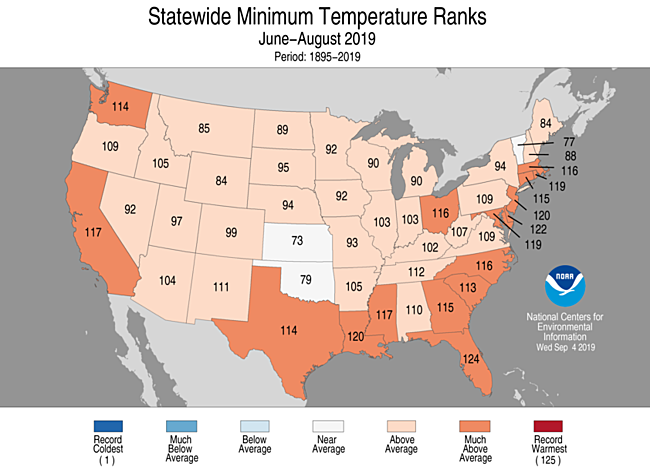
- During meteorological summer (June-August), the average temperature for the Lower 48 was 72.4°F, 1.0°F above average, ranking in the upper third of the historical record.
- Above- to much-above-average summer temperatures spanned from the West Coast to the Southwest and into the Deep South, as well as from the Gulf Coast to New England. Delaware, New Jersey, and Florida ranked fifth warmest, while New Mexico ranked sixth warmest. No state ranked below average for the summer season.
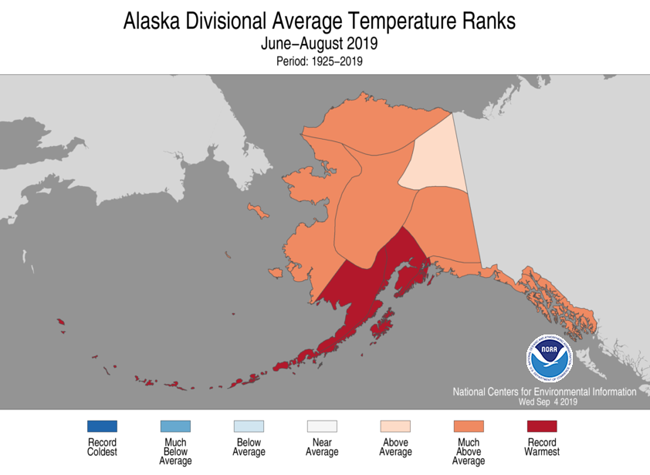
- The Alaska statewide average temperature for the summer was 54.6°F, 4.1°F above average and ranked as the second warmest such period on record. Record warm temperatures were observed across much of the southern and southwestern divisions with above- to much-above-average temperatures dominating the rest of the state.
- Anchorage had its warmest summer on record with an average temperature of 63.2°F, 1.8°F warmer than the previous warmest summer, in 2004.
- Kodiak, King Salmon, Iliamna, Cold Bay, and Talkeetna (tied with 2004) also had their warmest summer on record.
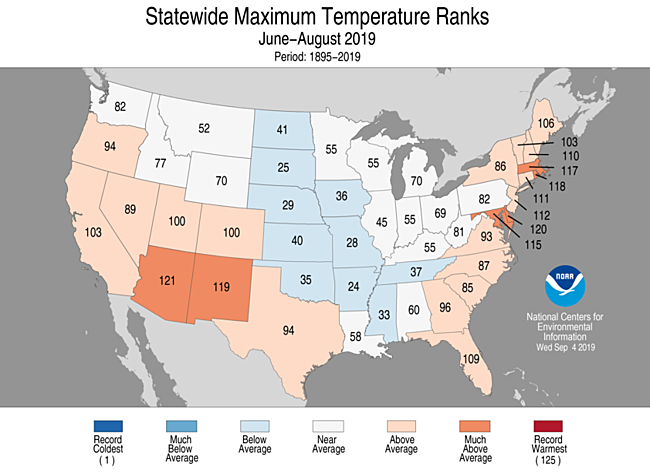
- The contiguous U.S. average maximum (daytime) temperature during June-August was 84.9°F, 0.5°F above the 20th century average, ranking in the middle third of the record. Above- to much-above-average maximum temperatures were observed along the Pacific coast, the Southwest and from Florida to New England. Below-average maximum temperatures were observed from the Northern Plains to the Gulf Coast.
- The contiguous U.S. June-August minimum (nighttime) temperature was 59.9°F, 1.5°F above average, and ranked in the warmest third of the record. Above- to much-above-average minimum temperatures were observed across all of the Lower 48 states except for Kansas, Oklahoma, and Vermont, where near average overnight low temperatures existed.
- Based on NOAA's Residential Energy Demand Temperature Index (REDTI), the contiguous U.S. temperature-related energy demand during June-August was 78 percent above average and ranked as the 14th highest value in the 125-year period of record.
June-August Precipitation
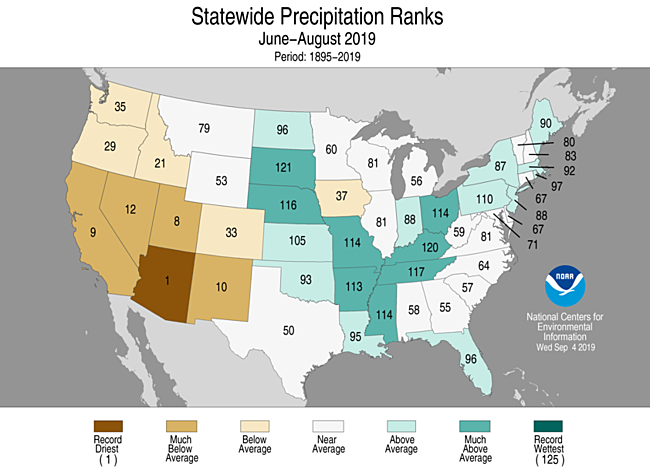
- The summer precipitation total was 8.83 inches, 0.51 inch above average, ranking in the upper third of the historical record.
- Above- to much-above-average precipitation was observed from the northern Great Plains to the Gulf Coast and from the Ohio Valley into the Northeast. South Dakota had its fifth wettest June–August, while Kentucky experienced its sixth wettest such period on record.
- Below- to much-below-average precipitation was observed across much of the West as well as in Iowa and upper Michigan. Arizona had its driest summer on record receiving about 40 percent of its seasonal average. California, New Mexico, and Utah had the tenth driest, or drier, summer.
- Anchorage, Seward, King Salmon, Talkeetna, and Cordova each had their driest summer on record, while Utqiaġvik reported its wettest June–August period on record with 5.43 inches, exceeding the previous record of 5.26 inches, set in 1989.
June-August Extremes
-
The U.S. Climate Extremes Index (USCEI) for summer matched the long-term average and ranked in the middle third of the 110-year period of record. On a national scale, elevated extremes in warm minimum temperatures and record wet PDSI were the main contributors to this average value. The USCEI is an index that tracks extremes (falling in the upper or lower 10 percent of the record) in temperature, precipitation and drought across the contiguous United States.
- On the regional scale, extremes across the West region ranked 14th highest and were due primarily to extremes in warm minimum temperatures, wet PDSI, as well as record high extremes in 1-day precipitation.
Year-to-Date Highlights

January-August Temperature
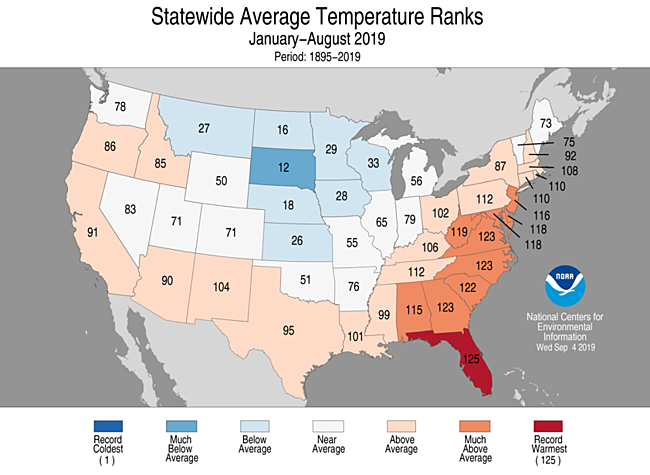
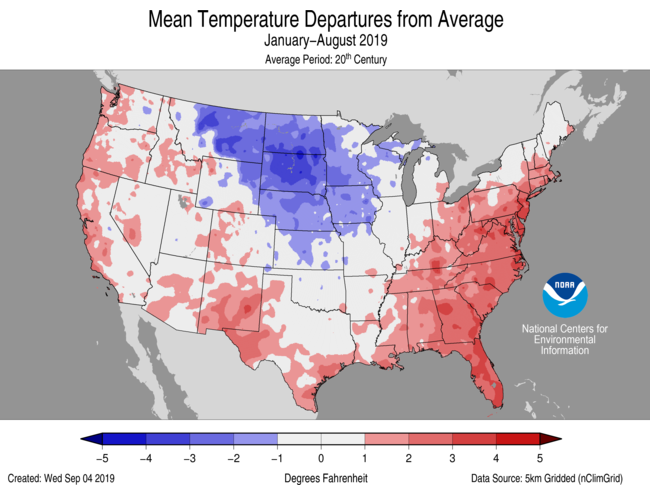
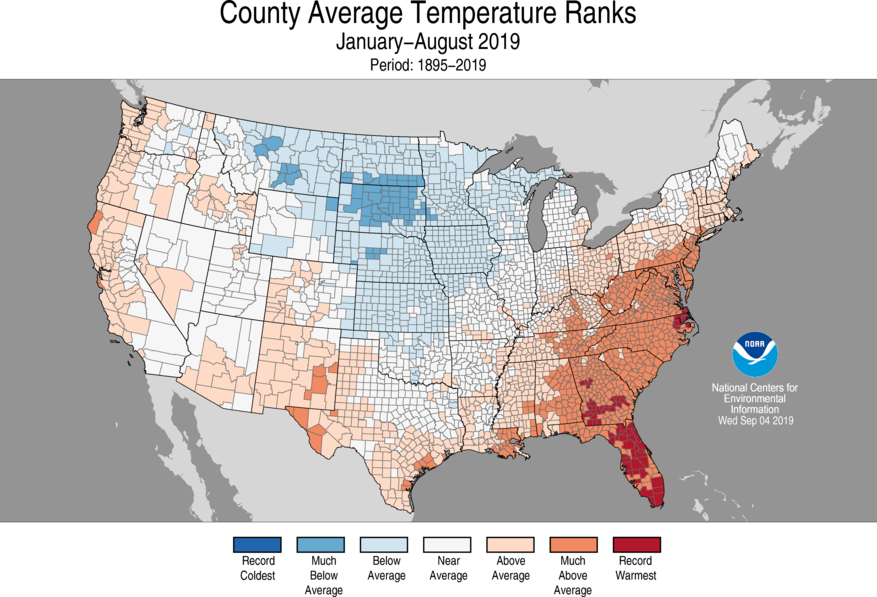
- For the year-to-date, the national temperature was 54.3°F, 0.4°F above average, ranking in the middle third of the historical record.
- Above- to much-above-average year-to-date temperatures were observed across portions of the West, southern Plains, and from the Gulf of Mexico to parts of New England. The year-to-date average temperature for Florida tied with 2017 as the warmest such period on record while Georgia, North Carolina, and Virginia ranked third warmest.
- Below- to much-below-average temperatures were observed across the northern and central Plains and western Great Lakes. South Dakota ranked 12th coolest for this year-to-date period.
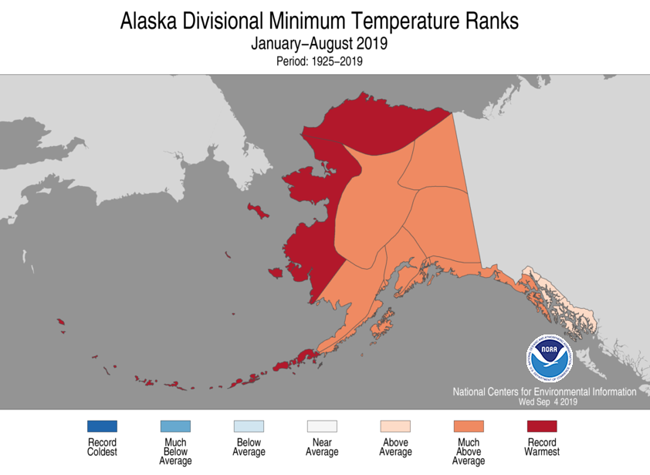
- Year-to-date temperatures were above normal across Alaska, with record warmth in the northern and western coastal divisions.
- The contiguous U.S. average maximum (daytime) temperature during January-August was 65.7°F, 0.3°F below the 20th century average, ranking in the middle third of the 125-year record. Above- to much-above-average maximum temperatures were observed across New Mexico as well as across much of the Southeast, the mid-Atlantic, and parts of the Northeast. Below- to much-below-average maximum temperatures were observed from the northern Plains to the Great Lakes and down to parts of the southern Plains and lower Mississippi Valley.
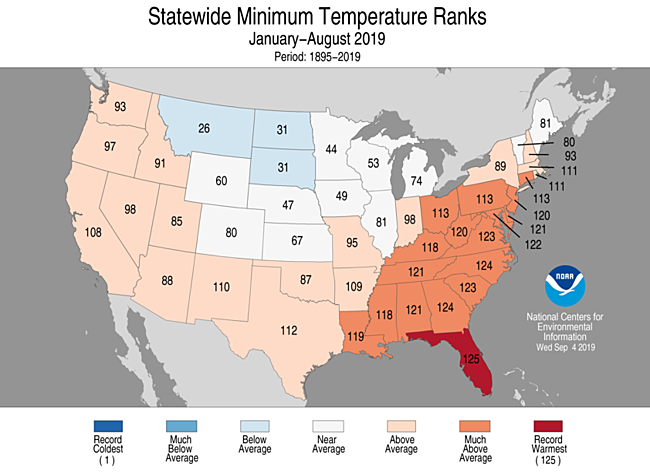
- The contiguous U.S. January-August minimum (nighttime) temperature was 42.8°F, 1.1°F above average, and ranked in the upper third of the record. Above- to much-above-average minimum temperatures were observed from the West, to the South, and across the Southeast, Ohio Valley, and most of the East Coast. Minimum temperatures averaged across Florida were record warmest for this year-to-date period with Georgia and North Carolina ranking second warmest.
- Based on REDTI, the contiguous U.S. temperature-related energy demand during January-August was two percent above average and ranked in the middle third of the 125-year period of record.
January-August Precipitation
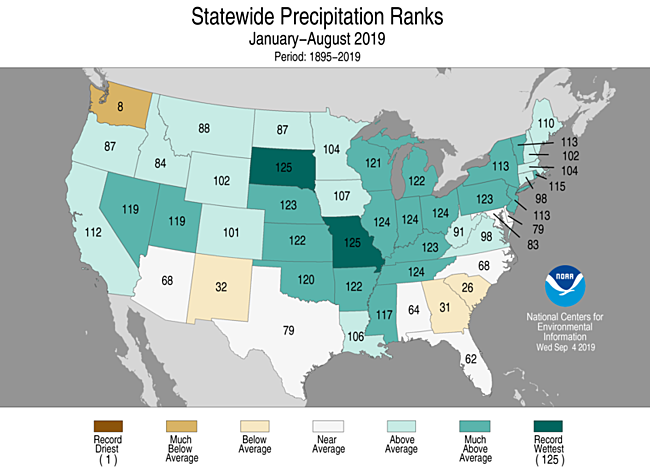
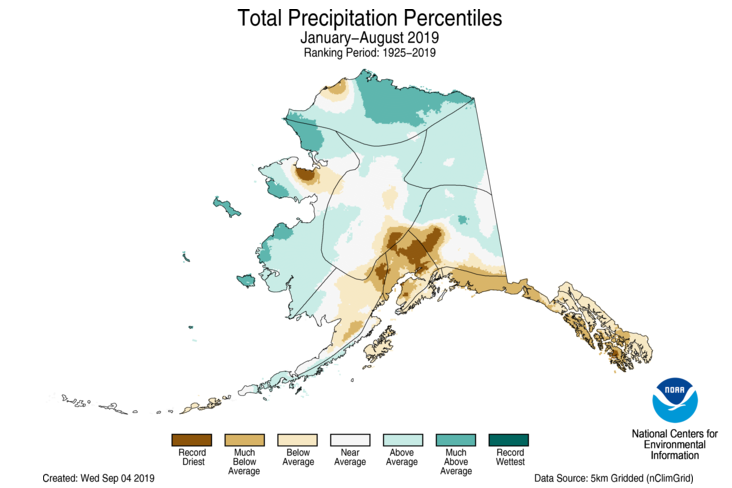
- The year-to-date precipitation total for the Lower 48 was 24.59 inches, 3.88 inches above average, ranking wettest on record. Five of the first six months of 2019 were wet, contributing to the record wet accumulation for January-August.
- The 12-month average precipitation across the contiguous U.S. for September 2018–August 2019 was 37.55 inches, 7.61 inches above average and the wettest September–August period on record. This also ranks as the fourth wettest among all 12-month periods on record.
- Above- to much-above-average January–August precipitation stretched from coast-to-coast with both South Dakota and Missouri ranking wettest on record. Illinois, Indiana, Ohio, and Tennessee each ranked second wettest for this year-to-date period.
- Washington state ranked eighth driest, while New Mexico, Georgia, and South Carolina ranked in the driest third of the historical record.
- The total number of wildfire acres consumed across Alaska in 2019 now exceeds 2.59 million acres, which is the sixth highest number of acres consumed across Alaska in the past 50 years.
- January–August precipitation was drier than normal across southern coastal Alaska to the panhandle, with record dry conditions in the south central parts of the state.
Extremes
- The USCEI for the year-to-date was 42 percent above average and ranked 14th highest in the 110-year period of record. Extremes in warm minimum temperatures, record wet PDSI, 1-day precipitation, and a record extent for the number of days with precipitation contributed to this elevated value.
- On the regional scale, the Northeast, Ohio Valley, Southeast, and South regions ranked in the top ten for CEI values over the last 110 years, due to a combination of warm maximum temperatures across the Southeast, warm minimum temperatures, record to near-record wet PDSI values, and the number of days with precipitation across each of these regions.
Regional Highlights
These regional summaries were provided by the six Regional Climate Centers and reflect conditions in their respective regions. These six regions differ spatially from the nine climatic regions of the National Centers for Environmental Information.
Northeast Region (Information provided by the Northeast Regional Climate Center)
- The Northeast’s average temperature for August was 68.6 degrees F (20.3 degrees C), 0.5 degrees F (0.3 degrees C) above normal. All states experienced a warmer-than-normal August with departures ranging from 0.1 degrees F (0.1 degrees C) above normal in New York to 1.9 degrees F (1.1 degrees C) above normal in Delaware. This August ranked among the 20 warmest on record for three states: 12th warmest in Delaware, 15th warmest in New Jersey, and 18th warmest in Maryland. Summer was also warmer than normal for the region with an average temperature of 68.5 degrees F (20.3 degrees C), 0.8 degrees F (0.4 degrees C) above normal. State departures ranged from 0.5 degrees F (0.3 degrees C) above normal in Vermont to 2.1 degrees F (1.2 degrees C) above normal in Delaware. It was the fifth warmest summer on record for Delaware and New Jersey, the eighth warmest for Maryland and Rhode Island, and the 10th warmest for Connecticut and Massachusetts.
- August precipitation for the Northeast was 3.87 inches (98.30 mm), which is normal for the month. At the state level, precipitation ranged from 81 percent of normal in Vermont to 123 percent of normal in Maine, with the majority of states within 10 percent of normal. Summer precipitation averaged out to be 13.28 inches (337.31 mm), 108 percent of normal. Once again, most states wrapped up the season within 10 percent of normal, with precipitation ranging from 92 percent of normal in Connecticut to 121 percent of normal in Pennsylvania, its 16th wettest summer on record.
- August started off with the Northeast being free of abnormally dry and drought conditions; however, abnormal dryness was introduced in northeastern New York, southern Maine, southwestern Massachusetts, northwestern Connecticut, and parts of West Virginia (totaling 3 percent of the Northeast) in the U.S. Drought Monitor released on August 8. Over the next two weeks, abnormal dryness was introduced in southern Vermont, western New Hampshire, and southern Maryland and lingered or expanded elsewhere. More abnormal dryness was introduced at the end of the month in parts of western New York, northern Vermont, northern New Hampshire, and western Maine, with the U.S. Drought Monitor released on August 29 showing 14 percent of the Northeast as abnormally dry.
- There was storm damage or flash flashing somewhere in the Northeast every day except one during the first three weeks of August. Severe storms targeted the Interstate 95 corridor from Washington, D.C., to Boston, Massachusetts, on August 7. As downpours inundated roads, vehicles got stuck in flood waters, leading to water rescues. Damaging winds downed trees, causing power outages. In addition, three EF-0 tornadoes touched down in New Jersey. The storms led to hours-long flight delays and hundreds of cancelled flights at some of the East Coast’s major airports. On August 12, an EF-1 tornado damaged more than 100 trees in eastern Maine. Straight-line winds of up to 90 mph (40 m/s) downed trees, some of which fell on homes and cars, in eastern New York on August 16. Three EF-1 tornadoes, two in eastern New York and one in southern Vermont, caused extensive tree damage and roof and siding damage to homes on August 21. Funnel clouds were reported in southern New Hampshire and northeastern Massachusetts. August 2019’s tornado count of seven was slightly higher than the Northeast’s August average of five. A cold front and moisture from the remnants of Tropical Storm Erin brought over 3 inches (76 mm) of rain to parts of New England from August 28 to 29.
- For more information, please visit the Northeast Regional Climate Center Home Page.
Midwest Region (Information provided by the Midwest Regional Climate Center)
- A mix of wet and dry areas across the Midwest averaged out to slightly above-normal precipitation in August. Monthly precipitation was 3.70 inches (94 mm) which was 0.04 inches (1 mm) above normal, making August the 13th straight month above normal across the region. Precipitation was well above normal in Missouri and southern Illinois, where totals exceeded 150 percent of normal. Missouri statewide precipitation for the month ranked as the 8th wettest on record (1895-2019). Meanwhile, significantly drier conditions were common across Michigan with a statewide total 1.00 inches (25 mm) below normal. Parts of northern lower Michigan received less than half the normal amount for the month. June through August precipitation was wetter than normal for the Midwest. Regionwide, 12.81 inches (325 mm) fell which was 0.85 inches (22 mm) above normal. Regionwide, all three months were above normal, with June well above normal and then July and August slightly above normal. The southern parts of the region received the heaviest precipitation for the June-August period. Kentucky (6th wettest), Missouri (12th), and Ohio (12th) all ranked among the wettest June-August periods on record (125 years from 1895-2019). The 12-month precipitation total of 46.66 inches (1185 mm) broke the old record (September 1992 to August 1993) by 3.05 inches (77 mm).
- Cooler temperatures were common across the western Midwest in August and near-normal for the eastern half of the region. The average temperature for the region was 70.3 degrees F (21.3 C) which was 0.6 degrees F (0.3 C) below normal. Maximum temperatures were even cooler across the western half of the Midwest. More than 100 daily low maximum temperatures were broken during the month, with most occurring in Missouri and western Iowa. June-August temperatures were near normal across the Midwest at 70.8 degrees F (21.6 C). Ohio was slightly warmer than other states in the region. Maximum temperatures in the region were slightly cooler while minimum temperatures were slightly warmer for the region, which evened out in the average. Hundreds of high minimum and low maximum temperature records were recorded regionwide. Cooler June temperatures gave way to hotter July temperatures before moderating in August.
- Drought was noted in the Midwest for the first time in 2019 in the August 13 U.S. Drought Monitor. This broke a stretch of 32 consecutive weeks without drought in the region, by far the longest in the history of the U.S. Drought Monitor (2000-2019). Drier conditions in July and August in eastern Iowa and northwestern Illinois contributed to the development of drought. Drought also formed in Kentucky and northern Michigan during the month. Rainfall late in August eliminated drought in Kentucky shortly after it emerged. Impacts on crops were felt, especially in areas where a wet spring led to soil compaction and poorer root structures.
- Thunderstorms brought severe weather to the Midwest in August, with nearly 1,000 reports of strong winds, hail and tornadoes. More than 800 of these reports were for strong winds. More than 200 reports of strong winds were recorded on August 20th alone. Injuries were reported in Ohio, Michigan and Indiana during the month from thunderstorm wind damage and debris. Large hail impacted the Minneapolis/St. Paul, MN area on August 5th, where hailstones 2 to 4 inches (5 to 10 cm) in diameter were reported. Of the tornadoes reported during the month, most were weak land spouts or rated EF-0 or EF-1.
- For further details on the weather and climate events in the Midwest, see the weekly and monthly reports at the Midwest Climate Watch page.
Southeast Region (Information provided by the Southeast Regional Climate Center)
- Temperatures were near average (i.e. within 3 degrees F (1.5 degrees C)) across the Southeast and Puerto Rico for the month of August. Monthly mean temperatures were over 3 degrees F (1.5 degrees C) above normal in only 8 of the 197 long-term (i.e., period of record equaling or exceeding 50 years) stations across the region. There were no stations that ranked 1st warmest or coldest in the Southeast region as far as mean temperatures. Maximum temperatures ranged from 6.6 degrees F (3.3 degrees C) above normal in Pelion, SC (1947-2019) to 2.8 degrees F (1.4 degrees C) below normal in Oneonta, AL (1894-2019). Minimum temperatures ranged from 5.3 degrees F (2.1 degrees C) above normal in Jacksonville, FL (1871-2019; 1st warmest) to 3.5 degrees F (1.7 degrees C) below normal in Haleyville, AL (1902-2019). During the beginning of the month, the Bermuda high pressure system shifted eastward, allowing a series of fronts to pass through the region keeping the region slightly cooler than normal. During the middle of the month, however, a persistent stationary front separated a cloudier and cooler than normal air mass along the southeast coastal areas with the interior of the region, which saw much sun and above normal temperatures. Montgomery, AL (1872-2019) reported triple digits from the 14th-18th, reaching 102 degrees F (39 degrees C) on August 17th. Gainesville, FL (1890-2019), however, didn’t even reach 90 degrees F (32 degrees C) and reported 76 degrees F (24 degrees C) on August 17th. Toward the end of the month, a surface high pressure system moved from the Great Lakes to New England, pushing a wedge of cooler air under moist airmass across the Southeast region. Daily maximum temperatures across Virginia, North Carolina, and South Carolina were 7 to 12 degrees F (3.5 to 6 degrees C) below normal. Daily maximum temperatures were only in the 70s F (20s C) for the area, including: Raleigh, NC (1887-2019) and Williamston, NC (1930-2019) at 74 degrees F (23 degrees C), Suffolk, VA (1945-2019) at 77 degrees F (25 degrees C) and Newberry, SC (1893-2019) at 78 degrees F (25.5 degrees C)
- Precipitation was highly variable across the Southeast region during August, as is common during the summer. The driest locations were found across the western parts of Virginia and North Carolina, as well as the much of South Carolina, western Georgia, and parts of the panhandle and southern Florida. Monthly precipitation totals were 70 to less than 25 percent of normal in these areas. Pelion, SC (1947-2019) only reported 1.4 inches (36 mm) of precipitation for the month, which was 3.9 inches (99 mm) below normal, making it the 3rd driest August on record. In contrast, the wettest locations were found across eastern Virginia, western South Carolina, and northern Alabama. Monthly precipitation totals were 150 to more than 300 percent of normal in these areas. A few long-term stations observed August precipitation totals that were ranked within their highest values on record, including: Greensboro, AL (1890-2019; 10.2 inches (259 mm), Augusta, GA (1871-2019; 12.9 inches (328 mm)), and Stuart, FL (1935-2019; 19.4 inches (493 mm)). The moist air mass in place, coupled with an approaching weak cool front brought locally heavy precipitation to parts of GA on August 23rd. As a result, Augusta, GA (1873-2019) set a daily precipitation record with over 3 inches (76 mm) of rain. Hurricane Dorian brought over 4 inches (102 mm) of rain to St. Thomas, USVI (1953-2019) on August 28th, while San Juan, PR (1898-2019), just to the west, reported only (0.2 inches (5 mm)). Consequently, monthly precipitation totals across the U.S. Virgin Islands were up to 2.5 inches (64 mm) above normal.
- There were 712 severe weather reports across the Southeast during August, which is nearly 2.5 times the median monthly frequency of 295 reports during 2000-2018. There were 3 tornadoes reported for the month, less than the monthly average of 8, including a waterspout that caused minor damage when it came onshore in the Keys of Florida. There were 44 reports of hail, almost double the average of 25 for the month, with the largest being golf ball-sized in Greene County, NC, James City, NC, and Roanoke, VA. Orangeburg County, SC reported a wind gust of 65 mph (29 m/s), which was included in the 665 wind reports for the month. However, the most notable wind reports came from St. Thomas, USVI during Hurricane Dorian. The hurricane impacted St. Thomas as a category 1 storm, with winds reported to be a little over 80 mph (36 m/s). Although several power outages were reported, there were no reports of significant injuries or fatalities. There was one reported fatality in Puerto Rico, where an 80-year-old man fell off a ladder while preparing for the storm.
- Drought conditions changed little throughout the month of August. At the end of the month, severe drought (D2) still covered small areas in Alabama and South Carolina that did not experience localized thunderstorms that are common during the summer. Moderate drought (D1), ringed by an area of dry conditions (D0), covered parts of southeastern North Carolina, central South Carolina, central Georgia, northern Florida, and central and southern Alabama. Dry conditions (D0) also developed in parts of Virginia. Little change was observed in Puerto Rico as well, with severe drought (D2) covering the southern area, ringed by moderate drought (D1) and dry conditions (D0). Recently planted crops, such as soybeans, benefited from rain that fell in parts of North Carolina; however, it came too late for the early-summer corn crop, especially in drought-affected parts of Onslow, Pender, and Columbus counties. Both oranges and grapefruits were producing good yields in the citrus counties of Florida, especially Polk County. The complete citrus region remained drought free for the month of August. In Dixie County, however, growers were unable to dig peanuts or cut hay due to severe flooding from thunderstorms. Disease pressures continued to be observed in Lafayette County due to the moisture, as well. Sugarcane planting was delayed by wet conditions again in Glades and Hendry counties.
- For more information, please visit the Southeast Regional Climate Center Home Page.
High Plains Region (Information provided by the High Plains Regional Climate Center)
- This month, the High Plains region was split down a line running from north-central Wyoming through south-central Kansas. Generally, east of the line, cool, wet conditions dominated, while west of the line, warm, dry conditions prevailed. While this led to precipitation extremes on both ends of the spectrum, precipitation records on the wet side were much more widespread. Numerous locations ranked in the top 10 wettest Augusts on record, with a few setting new monthly records, including Goodland, Kansas, Grand Island, Nebraska, and Huron, South Dakota. This continued wet pattern had various impacts on infrastructure, agriculture, and even the Nebraska State Fair (see page 2 for more details). By the end of the month, crops were generally in good condition. However, due to a combination of late planting and cool, wet conditions, many crops were behind. This has led to concerns that some crops may not reach maturity before the first freeze; however, there are no indications of an early freeze at this time. The average first hard freeze (28 degrees F / -2.2 degrees C) generally ranges from about late September in northern areas of the region to mid/late October in southern areas. The wet conditions have also created some concern that some areas could see a delayed harvest as well. To learn about your local freeze risk and how that relates to corn development, please see the U2U decision Support Tools.
- This month, the High Plains region was split down a line running from north-central Wyoming through south-central Kansas. Generally, east of the line, cool, wet conditions dominated, while west of the line, warm, dry conditions prevailed. While this led to precipitation extremes on both ends of the spectrum, precipitation records on the wet side were much more widespread. Numerous locations ranked in the top 10 wettest Augusts on record, with a few setting new monthly records, including Goodland, Kansas, Grand Island, Nebraska, and Huron, South Dakota. This continued wet pattern had various impacts on infrastructure, agriculture, and even the Nebraska State Fair (see page 2 for more details). By the end of the month, crops were generally in good condition. However, due to a combination of late planting and cool, wet conditions, many crops were behind. This has led to concerns that some crops may not reach maturity before the first freeze; however, there are no indications of an early freeze at this time. The average first hard freeze (28 degrees F / -2.2 degrees C) generally ranges from about late September in northern areas of the region to mid/late October in southern areas. The wet conditions have also created some concern that some areas could see a delayed harvest as well. To learn about your local freeze risk and how that relates to corn development, please see the State Climate Extremes Committee website.
- Overall, monthly temperatures were split along a line from north-central Wyoming through south-central Kansas, with areas to the east having below-normal temperatures and areas to the west having above-normal temperatures. Temperature departures were greatest in areas of North and South Dakota where departures approached 4.0 degrees F (2.2 degrees C) below normal. A few isolated areas had greater departures. Meanwhile, monthly temperatures were above-normal for much of Colorado, Wyoming, and southwest Kansas. In some areas of central and southeastern Colorado, temperature departures reached upwards of 4.0 degrees F (2.2 degrees C) above normal. This month, there were relatively few temperature records broken, both on monthly and daily time scales. A few locations did rank among the cool¬est Augusts on record in South Dakota, howev¬er, such as Sisseton (5th) and Rapid City (10th). One noteworthy daily record occurred on the 19th, when the temperature in Denver, Colorado hit 99 degrees F (37.2 degrees C). This easily beat the old record of 97 degrees F (36.1 degrees C), which was set in 1986 (period of record 1872-present).
- For much of the High Plains region, the ongoing wet pattern continued into August. A large area of Kansas, Nebraska, and South Dakota received at least 150-200 percent of normal precipitation this month, with some locations receiving over 300 percent of normal. As a result, many areas ranked among the top 10 wettest Augusts on record, including: Grand Island, NE (wettest); Goodland, KS (wettest); Huron, SD (wettest); Topeka, KS (2nd wettest); North Platte, NE (6th wettest); and Valentine, NE (8th wettest). Like last month, parts of Nebraska were affected yet again by flooding. This time, the Nebraska State Fair, held in Grand Island, Nebraska, was impacted. During the early morning hours of the 26th, an area of strong, slow moving thunderstorms developed and moved over areas of central Nebraska, producing a swath of 1.00-3.00 inches (25-76 mm) of rain. This rainfall occurred over already saturated soils, resulting in abrupt rises on small creeks and streams, while also creating large areas of ponding water. The flooding that occurred at the Nebraska State Fair caused disruptions and delays as the main area designated for parking became submerged and was no longer usable. Multiple carnival rides and other booths also became temporarily inundated.
- Although wet conditions prevailed across much of the region, drier conditions were present throughout a large part of Colorado, Wyoming, and far southwest Kansas. In some of these areas, precipitation was less than 50 percent of normal for the month. For instance, Grand Junction, Colorado had its 3rd driest August on record, with only 0.04 inches (1 mm) of precipitation (period of record 1983-present).
- The summer, as a whole, was quite wet for much of the High Plains region and this ample moisture caused many impacts. For instance, wet conditions were a contributing factor to a collapse in the Goshen/Gering-Fort Laramie irrigation canal in eastern Wyoming in mid-July. As crews made repairs, water did not flow through the canal for several weeks. It was not until the end of August that water was able to flow through the canal again. This impacted more than 100,000 acres of irrigated cropland in both Nebraska and Wyoming at a crucial time of the year. This area receives less than 20 inches (508 mm) of precipitation per year, on average, and is quite drier than areas to the east.
- Heavy precipitation continued to impact streamflows this month. According to the USGS WaterWatch, monthly streamflows were much above normal across portions of South Dakota, Nebraska, southern North Dakota, central Colorado, and eastern Kansas. Some of these areas also experienced record high streamflows for the month. The rest of the region had normal to above normal streamflows, with only a few isolated areas indicating below-normal streamflows. Although streamflows remained above normal in many places, constructions crews have continued to make progress repairing and reopening many bridges and roads that were impacted by flooding earlier in the year.
- Heavy rains staved off the development of drought conditions for the majority of the High Plains region this month. Drought conditions (D1-D4) developed or expanded in small areas of Colorado, Kansas, and North Dakota, however. According to the U.S. Drought Monitor, the area experiencing drought or abnormally dry conditions (D0-D4) increased slightly over the past month, from approximately 9 percent to 12 percent. Shower and thunderstorm activity was abundant over much of the High Plains region, with a swath of above-normal precipitation stretching from eastern Montana to the southeast through central Oklahoma and Arkansas. Many locations within this area had their wettest August on record. Despite this precipitation, some areas missed out, and abnormally dry conditions (D0) persisted over parts of southwestern Kansas. A small area of moderate drought (D1) developed in that area as well. To the west, D0 developed and expanded in parts of Colorado and Wyoming. D1 also spread into the southwest corner of Colorado, with drought now encompassing a larger area of the Four Corners region. The combination of ongoing below-normal precipitation and recent above-normal temperatures was a contributing factor to these changes in the U.S. Drought Monitor map in the western part of the High Plains region.
- For more information, please visit the High Plains Regional Climate Center Home Page.
Southern Region (Information provided by the Southern Regional Climate Center)
- Temperatures for the month of August varied spatially across the Southern Region, with above-average temperatures in the west and below-normal temperatures in the north. Parts of northeastern Oklahoma, northern Arkansas, northwestern Mississippi, and western and south-central Tennessee experienced temperatures 0 to 2 degrees F (0.00 to 1.11 degrees C) below normal. Conversely, parts of northern and western Louisiana, southern Arkansas, southern and western Oklahoma, and most of Texas experienced temperatures 2 to 4 degrees F (1.11 to 2.22 degrees C) above normal. Parts of northern and western Texas experienced temperatures 4 to 6 degrees F (2.22 to 3.33 degrees C) above normal, while parts of far western Texas experienced temperatures 6 to 8 degrees F (3.33 to 4.44 degrees C) above normal. The statewide monthly average temperatures were as follows: Arkansas – 80.50 degrees F (26.94 degrees C), Louisiana – 83.60 degrees F (28.67 degrees C), Mississippi – 81.50 degrees F (27.50 degrees C), Oklahoma – 82.50 degrees F (28.06 degrees C), Tennessee – 77.10 degrees F (25.06 degrees C), and Texas – 86.00 degrees F (30.00 degrees C). The statewide temperature rankings for August were as follows: Arkansas (forty-third warmest), Louisiana (fourteenth warmest), Mississippi (thirtieth warmest), Oklahoma (thirty-seventh warmest), Tennessee (thirty-eighth warmest), and Texas (second warmest). All state rankings are based on the period spanning 1895-2019.
- Precipitation values for the month of August varied spatially across the Southern Region. Parts of northern, western, southern, central, and eastern Texas; central and northern Louisiana, and southern Arkansas received 50 percent or less of normal precipitation. Parts of northern, western, and southern Texas as well as southern Arkansas received 25 percent or less of normal precipitation, while parts of southern and western Texas received 5 percent or less of normal precipitation. In contrast, parts of northeastern Texas, eastern and central Oklahoma, central and northern Arkansas, central, southern, and northeastern Mississippi, southern Louisiana, and western Tennessee received 150 percent or more of normal precipitation. Parts of northeastern Texas, eastern Oklahoma, central and northern Arkansas, and central Mississippi received precipitation 200 percent or more of normal, while parts of central and northeastern Oklahoma as well as northwestern Arkansas received precipitation 300 percent or more of normal. The statewide precipitation totals for the month were as follows: Arkansas – 4.46 inches (113.28 mm), Louisiana – 4.89 inches (124.21 mm), Mississippi – 5.43 inches (137.92 mm), Oklahoma – 5.02 inches (127.51 mm), Tennessee – 3.95 inches (100.33 mm), and Texas – 1.35 inches (34.29 mm). The state precipitation rankings for August were as follows: Arkansas (twenty-fifth wettest), Louisiana (fourteenth wettest), Mississippi (thirtieth wettest), Oklahoma (twelfth wettest), Tennessee (fifty-seventh wettest), and Texas (twenty-fifth driest). All state rankings are based on the period spanning 1895-2019. Drought and Severe Weather:
- At the end of August, drought conditions deteriorated across the Southern Region. Extreme drought conditions developed across parts of southern and northern Texas as well as southwestern Oklahoma. Severe drought classifications were still present in far southern Texas, while new areas formed in northern Texas and southwestern Oklahoma. Moderate drought classifications expanded across northern and southern Texas as well as southwestern Oklahoma, with new areas developing in central, western, and eastern Texas, western Oklahoma, southwestern Arkansas, and northwestern Louisiana. There were no drought conditions in Tennessee or Mississippi. There was an increase in the overall area experiencing abnormally dry conditions as abnormally dry conditions developed or expanded across parts of southern, central, western, eastern, and northern Texas; southwestern, southeastern, and western Oklahoma; southwestern Arkansas, northern Louisiana, and southeastern Tennessee.
- In August, there were a total of 294 storm reports across Oklahoma, Texas, Arkansas, Louisiana, Mississippi, and Tennessee. There were 4 tornado reports, 46 hail reports, and 244 wind reports. Oklahoma tallied the most tornado (2) and wind (73) reports, while Texas tallied the most hail reports (21). Oklahoma tallied the most reports total (91), while Louisiana tallied the fewest (1).
- On August 1, 2019, one person was killed near Gatlinburg, Tennessee when a strong wind gust from a thunderstorm caused a tree to fall on a vehicle.
- On August 3, 2019, a wind gust of 62 mph (99.78 kph) was reported near Levelland, Texas.
- On August 6, 2019, a wind gust of 66 mph (106.22 kph) was reported near Corning, Arkansas.
- On August 7, 2019, a wind gust of 83 mph (133.58 kph) was reported near Goodnight, Texas, while a wind gust of 72 mph (115.87 kph) was reported near Childress, Texas.
- On August 8, 2019, a wind gust of 72 mph (115.87 kph) was reported near Muleshoe, Texas.
- On August 9, 2019, two landspout tornadoes were reported in Arkansas and Mississippi.
- On August 12, 2019, a wind gust of 70 mph (112.65 kph) was reported near Higgins, Texas.
- On August 13, 2019, a wind gust of 63 mph (101.39 kph) was reported near Hohenwald, Tennessee.
- On August 14, 2019, a wind gust of 73 mph (117.48 kph) was reported near Fritch, Texas.
- On August 15, 2019, a wind gust of 68 mph (109.44 kph) was reported near Turkey, Texas.
- On August 16, 2019, a wind gust of 79 mph (127.14 kph) was reported near Clarendon, Texas.
- On August 17, 2019, a wind gust of 94 mph (151.28 kph) was reported near Altus, Oklahoma.
- On August 18, 2019, a wind gust of 76 mph (122.31 kph) was reported near Lesley, Texas.
- On August 19, 2019, a wind gust of 70 mph (112.65 kph) was reported near Paloduro, Texas.
- On August 23, 2019, a wind gust of 72 mph (115.87 kph) was reported near Slapout, Oklahoma.
- On August 26, 2019, tea cup-sized hail was reported near Minco, Oklahoma. Also, wind gusts in excess of 75 mph (120.70 kph) were reported near Warr Acres, Cedar Valley, Piedmont, and Del City, Oklahoma, with a maximum of 87 mph (140.01 kph) near Piedmont.
- On August 29, 2019, a wind gust of 71 mph (114.26 kph) was reported near Newkirk, Oklahoma.
- For more information, please visit the Southern Regional Climate Center Home Page.
Western Region (Information provided by the Western Region Climate Center)
- Precipitation was below-normal across most of the southern half of the Western U.S. while much of the northern half experienced near-normal to slightly above-normal precipitation accumulations for the month. Across the Four Corners states, monsoon precipitation accumulations have continued to be below-normal with parts of northern Arizona, southwestern Colorado, northwestern New Mexico, and southeastern Utah experiencing record dryness. Likewise, precipitation was below-normal across most of the Intermountain West with the exception of areas on the Owyhee Plateau of southwestern Idaho and portions of northeastern Nevada. In the Pacific Northwest, wetter-than-normal conditions prevailed in parts of the region including central and southwestern Oregon, central and northeastern Washington, and isolated areas of the Idaho Panhandle and northwestern Montana. Across most of the West, average temperatures were above-normal with the largest departures observed across the Four Corners states. In Alaska, anomalously warm temperatures and dryness persisted across parts of state with well below-normal precipitation observed in Southcentral, Southeast, and Southwest Alaska.
- In the Southwest, the end of August marked one of the driest monsoon seasons on record for parts of the region. The combination of above-normal temperatures and dryness led to the introduction of areas of moderate drought in northern Arizona, according to the August 27 U.S. Drought Monitor map. Across this area, precipitation was well below-normal with record dryness for the month of August reported at several observing stations including the National Weather Service in Bellemont, Arizona which reported 0.27 inches (6.9 mm - 8% of normal) and at the Grand Canyon National Park Airport 0.15 inches (3.8 mm - 6% of normal). Across the Southwest, average temperatures ranged from 1 to 8+ degrees above-normal with the greatest departures observed in southeastern New Mexico where Carlsbad reported its warmest August on record with an average temperature of 86.7° F (30.4°C) which was a +6.8° F (3.8°C) departure from normal. In Arizona, Phoenix Sky Harbor International Airport reported an average temperature of 96.8° F (36°C) which was a +3.2° F (1.8°C) departure from normal and the 2nd warmest on record dating back to 1933.
- In California, warm and generally dry conditions prevailed across most of the state with the exception of some isolated pockets in northern California, which observed above-normal precipitation accumulations. Specifically, the Redding Municipal Airport observed 1.01 inches (25.6 mm – 561% of normal). Statewide, average temperatures were above-normal with greater departures observed along the northern California coast including at the Arcata-Eureka Airport which reported an average temperature of 60.9° F (16.1°C) – a +4.3° F (2.4°C) departure from normal and 2nd warmest August on record dating back to 1945.
- In the Pacific Northwest, drought conditions persisted across portions of northern and western Washington, northwestern Oregon, northern Idaho, and northwestern Montana despite some isolated shower activity during the month. According to the USGS, 28-day average streamflow levels in western Washington were well below-normal with numerous creeks and rivers having flows in the <10th percentile range. Average temperatures across much of the region were above-normal including some with some very warm temperatures reported at the end of the month in central Oregon where the Redmond Airport observed average daily temperature departures ranging from 10-to-13° F above-normal as well as a single-day record high temperature of 100° F (37.8°C) on August 28.
- In Alaska, the record-breaking warm temperatures continued across much of the state in August. Anchorage experienced its warmest (+5.9°F [3.3°C] departure) and driest (0.04 in [1 mm] – 1% of normal) August on record as well as its warmest and driest summer on record. According to NOAA NCEI, as of the end of August, Alaska (statewide) experienced its warmest 6-month, 12-month, and 24-month periods on record.
- In the Hawaiian Islands, average temperatures were above-normal across the island chain for the month. Lihue Airport reported an average temperature of 83.5°F (28.6°C), which was +3.8°F (2.1°C) above-normal and the warmest August since records began in 1950. Likewise, Molokai Airport experienced its warmest August on record with an average temperature of 82.3° F (27.9°C) and a +3.8° F (2.1°C) departure from normal. On the Big Island, beneficial rainfall led to improvement in drought conditions in the Ka’u District on the leeward side with the following observing stations reporting above-normal precipitation: Naalehu 4.38 in (111 mm), Sea Mountain 4.62 in (117 mm), and Pahala 6.85 in (174 mm). Significant Events for August 2019
- August (all month) - Weak monsoon across the Southwest:According to NOAA NCEI, the Southwest Climate Region experienced its 10th driest August on record as well as its 2nd driest July-August period on record. On a state level, Arizona experienced its driest July-August on record.
- August (end of month) - Anomalous warmth, dryness, and wildfires in Alaska:According to NOAA NCEI, Alaska (statewide) experienced its 2nd warmest summer on record. On a climate-division level, the Cook Inlet, Northeast Gulf, and Northwest Gulf all experienced their driest August on record. For the summer, wildfires burned ~2.59 million acres across the state, which represents the 6th highest summer total in the past 50 years.
- For more information, please go to the Western Regional Climate Center Home Page.