National Overview

October Highlights
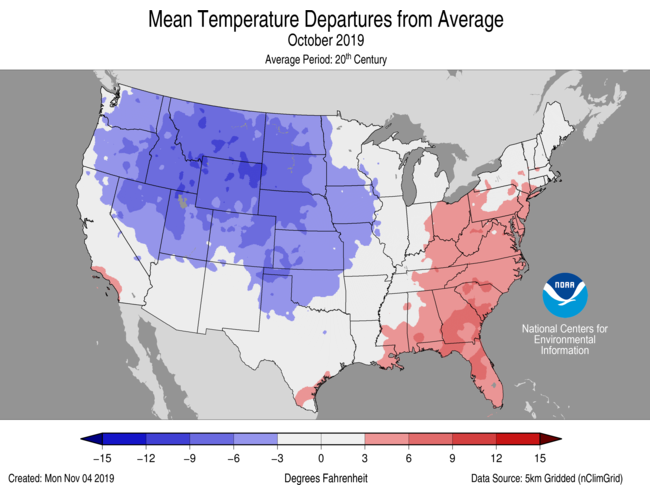

October Temperature
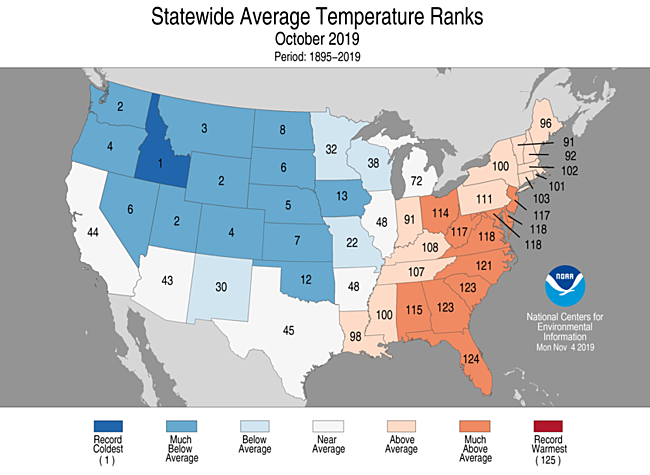
- For October, the average contiguous U.S. temperature was 52.3°F, 1.8°F below the 20th century average. This ranked in the lowest third of the 125-year period of record and was the coolest October since 2009.
- October was an active weather month across the contiguous U.S. as the transition from summer to fall was evident. The month began with a trough in the West and a ridge over the eastern U.S. This pattern brought cold conditions to the northern Rockies and Plains and record warm temperatures across the Southeast, mid-Atlantic, and Ohio Valley.
- Above- to much-above-average October temperatures dominated across the East Coast, southern Great Lakes, Ohio Valley, and southern Plains. Florida ranked second warmest during October, while Georgia and South Carolina ranked third warmest.
- Record heat blanketed the Southeast and mid-Atlantic states the first week of October, shattering many all-time October heat records.
- Virginia Key, off the coast of Miami, FL, reported an average temperature of 82.1°F for October — the warmest October on record and warmer than Virginia Key's average temperature during the month of June.
- Miami's average temperature of 83.2°F broke the 2002 record for the warmest October by 1°F and was hotter than Miami's average temperature in September.
- Below- to much-below-average October temperatures were observed across the Northwest, Intermountain West, Great Plains, and western Great Lakes. Idaho ranked coldest for the month, breaking the 1919 record by 0.8°F. The states of Washington, Utah, and Wyoming ranked second coldest during October.
- Great Falls, MT, reported a low of 9°F on October 1 — the coldest temperature on record in Great Falls so early in the fall season.
- An early-season snowstorm across the Rockies and Midwest was accompanied by bitter cold temperatures during the last week of October. All-time low temperature records for October were set across the West with some temperatures dipping well below zero. Peter Sinks, UT, often one of the nation’s coldest locations, dropped to −46°F early on October 30, according to the Utah Climate Center. This temperature may be the coldest October temperature on record across the contiguous U.S.
- According to the Wyoming State Climate Office, Daniel Fish Hatchery bottomed out at -34°F on October 30, setting a new record for the coldest October temperature on record for Wyoming. This broke the previous record of -33°F set back in 1917 at Soda Butte in Yellowstone National Park.
- Alaska ranked in the warmest third of the October record with a statewide average temperature of 30.8°F, 5.3°F above the long-term average. Parts of the North Slope experienced temperatures averaging at least 9°F warmer than the historical average, while much of the Panhandle experienced a mild October. It was the second warmest October on record for Utqiaġvik (Barrow).
- The nationally averaged maximum temperature (daytime highs) was colder than average during October at 64.5°F, 2.2°F below average, ranking in the lowest third of the 125-year record. Much of the Northwest, northern and central Plains, as well as parts of the Midwest had maximum temperatures which were much-below-average for the month. Parts of the Ohio Valley, mid-Atlantic states, and the Southeast were much-above average during October.
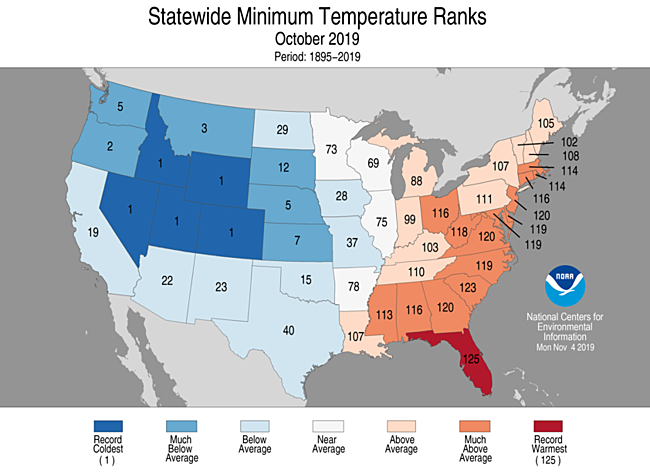
- The nationally averaged minimum temperature (overnight lows) during October was 40.2°F, 1.2°F below average and ranked in the lowest third of the 125-year record. Nevada, Idaho, Utah, Wyoming, and Colorado each ranked coldest on record with five additional states' minimum temperatures ranking among their coldest 10 Octobers on record. In contrast to the record low minimum temperatures, Florida ranked warmest for overnight low temperatures, while 14 additional states had minimum temperatures which were much-above-average for the month.
- Cold records in October outpaced warm records by a 3 to 2 margin. As of November 8, there were 4,713 warm daily high (2,620) and low (2,093) temperature records tied or broken during October. This was roughly two-thirds of the approximately 7,692 daily cold high (3,213) and low (4,479) temperature records set during the month.
- Based on NOAA's Residential Energy Demand Temperature Index (REDTI), the contiguous U.S. temperature-related energy demand during October was one percent below average and ranked as the 56th highest value on record.
October Precipitation
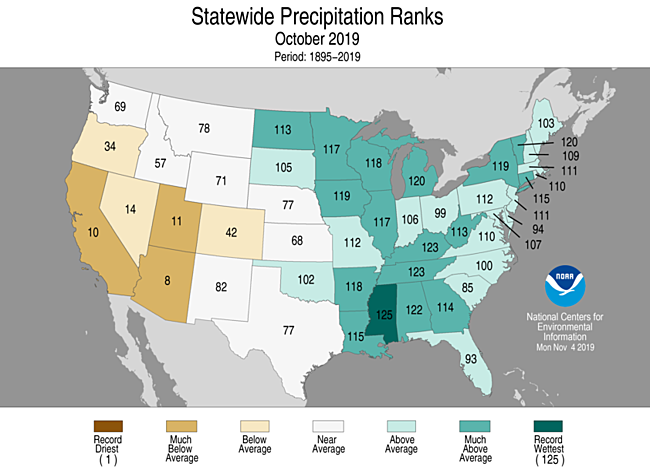
- The October precipitation total for the contiguous U.S. was 3.14 inches, 0.98 inch above average, and ranked as the eighth wettest October in the 125-year period of record.
- The trough at the beginning of the month across the West as well as the ridge-trough-ridge pattern in place across the contiguous U.S. near the end of October enhanced precipitation along the northern and central Rockies, Plains, Midwest, as well as the Mississippi Valley to the Great Lakes.
- Above- to much-above average precipitation was observed across much of the eastern half of the contiguous U.S. Mississippi ranked wettest during October, while 11 additional states ranked among their 10 wettest Octobers on record.
- Below- to much-below-average precipitation occurred across the West, with Arizona and California ranking among their 10 driest Octobers on record.
- An upper-level trough and an associated cold front brought the Northern Rockies and Plains their first significant snowstorm of the season. From October 9–13, one to two feet of snow accumulated across portions of Montana and North Dakota, with several locations noting their snowiest start to the season. Great Falls, MT, reported 27 inches of snow while Bismark, ND, measured 17.1 inches for the season-to-date.
- Another early-season snow storm impacted the central Rockies and parts of the Plains and Midwest. Denver reported 6.6 inches of snow on October 29 — the largest one-day October snowfall for Denver since 2011. Snow from this system also fell across portions of the central Plains and Great Lakes.
- October was wet across much of Alaska with portions of the Northeast Interior, Southeast Interior, and West Coast divisions reporting record wet conditions for the month.
- According to the October 29 U.S. Drought Monitor report, approximately 18 percent of the contiguous U.S. was in drought, down slightly from 19 percent at the beginning of October. Drought conditions became less severe across parts of the Southeast, Tennessee and Ohio valleys, Texas, the Alaska Panhandle, Hawaii, and Puerto Rico. Drought intensified across the Four Corners region of the Southwest.
Other Notable Weather
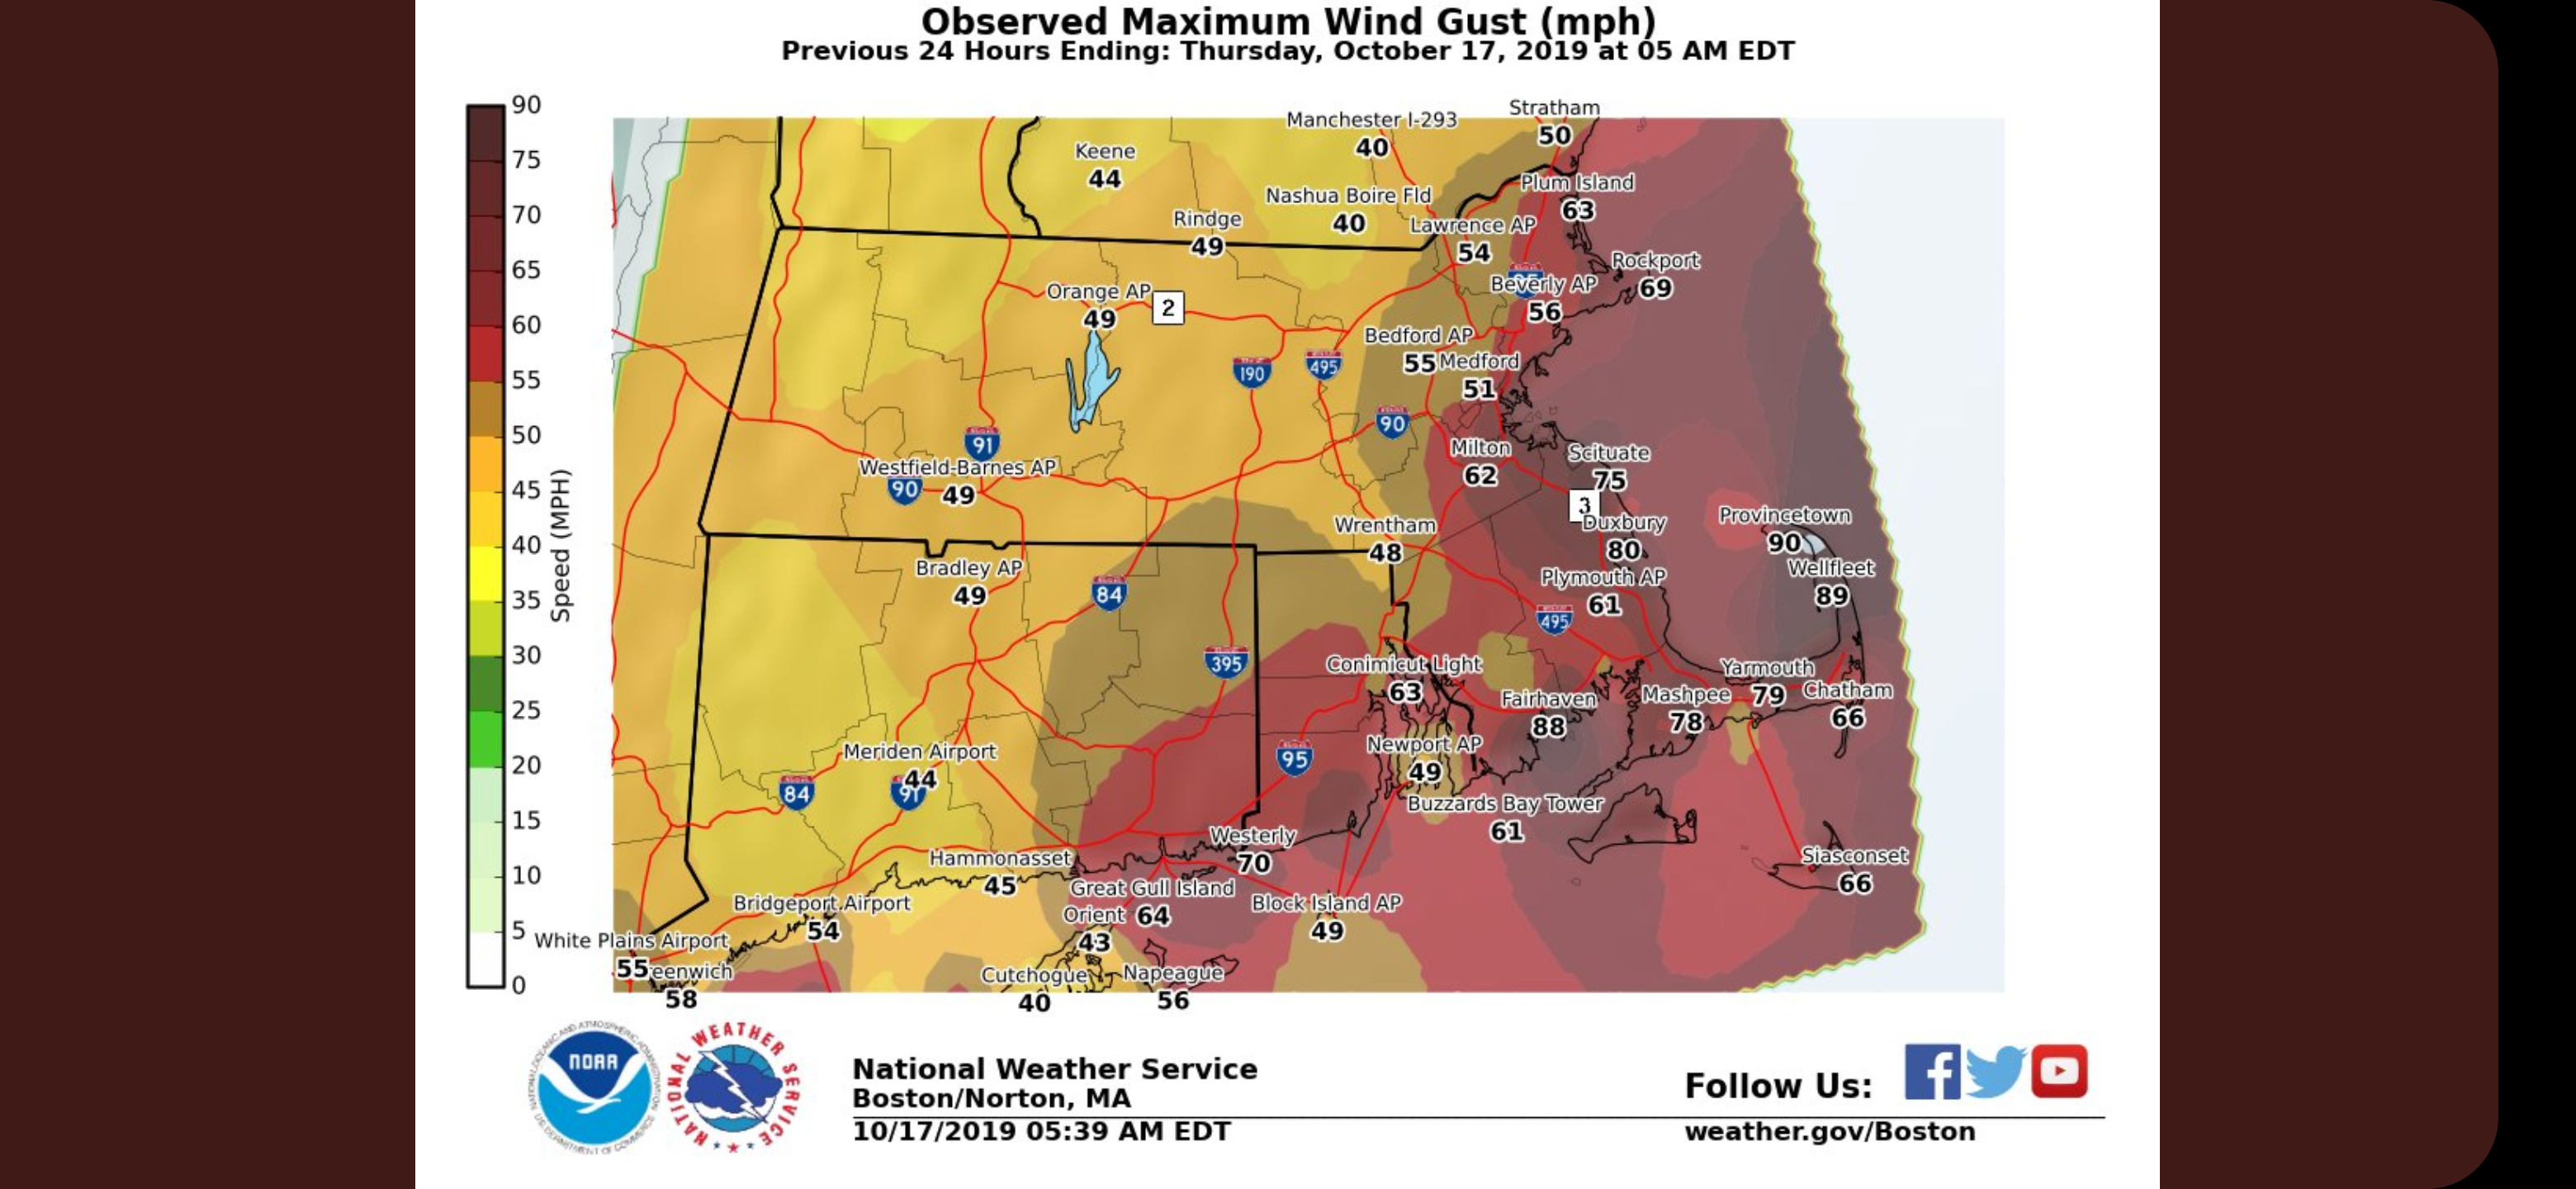
- Subtropical Storm Melissa formed from a slow-moving East Coast nor’easter on October 11 with sustained winds of 65 mph. Impacts from Melissa included coastal flooding from Virginia to New York. Less than a week later, a mid-latitude cyclone, moving across the central and eastern United States, developed into a “Bomb Cyclone” (a storm whose central pressure drops by at least 24 millibars in 24 hours or less). This storm packed wind gusts up to 90 mph in southern New England on October 17 and left over 500,000 residents without power. New October low-pressure records were reported for various locations across Massachusetts, Rhode Island, and New Hampshire. Precipitation accumulations from this storm system measured between two and four inches across portions of New England.
- Post-Tropical Cyclone Nestor made landfall on October 19 near Apalachicola, FL, with top sustained winds of 45 mph. The system brought between three and five inches of rainfall as well as tornadoes to the Florida Panhandle. Beneficial rains from the remnants of Nestor fell across parts of Georgia, South Carolina, North Carolina, and Virginia, which had been impacted by severe drought conditions.
- Tropical Storm Olga merged with a cold front in the Gulf of Mexico on October 25 and made landfall as a post-tropical storm along the central Louisiana coast early the next morning. Many residents lost power across Louisiana as winds exceeded 70 mph, while tornadoes and wind damage impacted both Mississippi and Alabama.
- Several large and dangerous wildfires impacted parts of north-central and southern California during October and remained active at the beginning of November. The Kincade Fire, located in north-central California, burned through nearly 78,000 acres and destroyed almost 350 structures by the end of October. The Tick, Saddleridge, and Getty fires in southern California consumed more than 14,000 acres as well as 60 structures. The Easy Fire, also located in southern California, consumed more than 1,700 acres by the end of October. These large and dangerous fires were fanned by powerful winds, with some gusts topping 100 mph in the Sierra Nevada range. Across southern California, unusually strong Santa Ana winds made it difficult for fire crews to keep these fires from spreading.
Year-to-Date Highlights

January-October Temperature
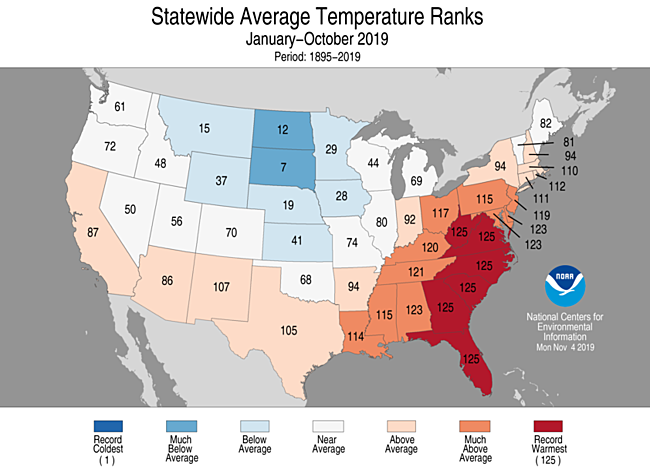
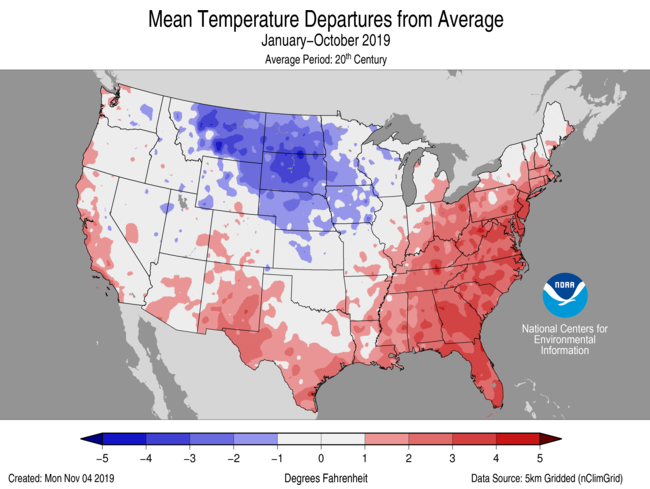
- For the year-to-date, the contiguous U.S. temperature was 55.5°F, 0.5°F above average, and ranked in the warmest third of the January–October record.
- Above- to much-above-average year-to-date temperatures were observed from California to the southern Plains and from the Southeast to New England. Record warm temperatures were scattered throughout much of the Southeast and mid-Atlantic states. Thirteen states had a top 10 warm year-to-date period with Florida, Georgia, South Carolina, North Carolina, Virginia, and West Virginia reporting their warmest January–October on record.
- Below-average temperatures occurred across the northern Plains and parts of the Midwest with South Dakota having its seventh coldest year-to-date period on record.
- Alaska had its second warmest January–October on record. Record heat blanketed much of the North Slope and northern West Coast with portions of the Aleutians, the Northeast Interior, and Central interior also reporting record warm conditions. The rest of the state had above- to much-above-average temperatures for this 10-month period.
- The contiguous U.S. average maximum (daytime) temperature during January-October was 67.1°F, 0.1°F below the 20th century average, ranking in the middle third of the 125-year record. Above- to much-above-average maximum temperatures were observed across the South, Southeast, mid-Atlantic, and into the Northeast with record warm daytime temperatures observed in both Florida and North Carolina. Below- to much-below-average maximum temperatures were observed across the Intermoutain West, northern and central Plains, and into parts of the Great Lakes with South Dakota ranking coldest for daytime temperatures during the first 10 months of 2019.
- The contiguous U.S. January-October minimum (nighttime) temperature was 43.9°F, 1.2°F above average, and ranked in the upper third of the record. Above- to much-above-average minimum temperatures were observed from the West, to the South, and across the Southeast, Ohio Valley, Great Lakes, and most of the East Coast. <Minimum temperatures averaged across Florida, Alabama, Georgia, South Carolina, North Carolina, and Virginia were record warmest for this year-to-date period with a pocket of cooler-than-average overnight low temperatures located across the northern Plains.
- Based on the REDTI, the contiguous U.S. temperature-related energy demand during January-October was 10 percent above average and ranked 47th highest in the 125-year period of record.
January-October Precipitation
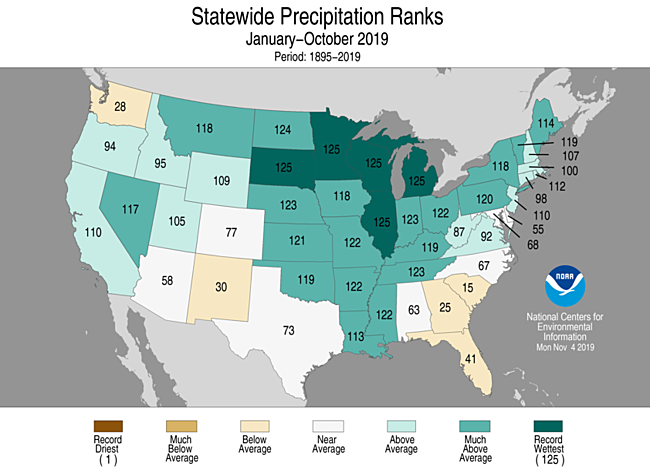
- For the year-to-date, the national precipitation total was 30.25 inches, 4.89 inches above average, the wettest January-October on record.
- Above-average January–October precipitation dominated much of the country with record wet statewide ranks occurring in South Dakota, Minnesota, Wisconsin, Illinois, and Michigan. Below-average precipitation fell across the Pacific Northwest, parts of the Southwest and Southeast.
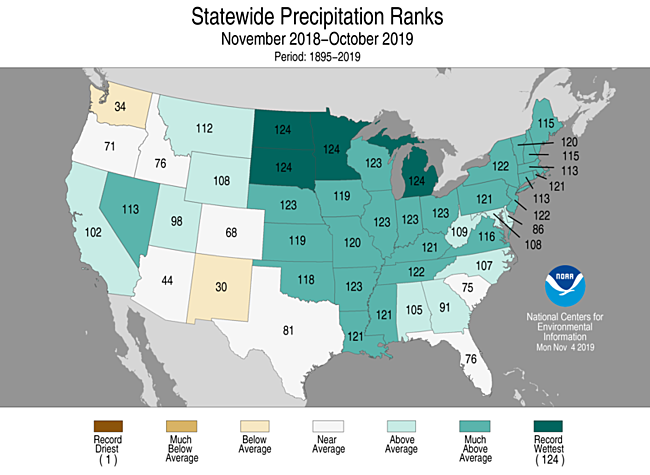
- The 12-month average precipitation across the contiguous U.S. for November 2018–October 2019 was 36.21 inches, 6.28 inches above average and the wettest November-October period on record. This also ranks as the seventh wettest among all 12-month periods on record.
Extremes
- The USCEI for the year-to-date was 69 percent above average and ranked eighth highest in the 110-year period of record. Extremes in warm minimum temperatures, wet PDSI, and days with precipitation were the primary contributors to this elevated value.
- On the regional scale, the Northeast and the Ohio Valley regions ranked fourth and second highest, respectively, for CEI values over the last 110 years. Across both regions, this was primarily due to a combination of factors including elevated extremes in maximum and minimum temperatures, wet PDSI, and the number of days with precipitation. For the Southeast, the CEI for this year-to-date period was second highest on record and resulted from record extremes in maximum and minimum temperatures as well as elevated extremes in wet PDSI values. In contrast to the warm extremes across the eastern regions, the Northern Rockies and Plains experienced its eight highest January–October CEI value due to extremes in cold maximum temperatures, as well as wet PDSI, extremes in 1-day precipitation, and the number of days with precipitation.
Regional Highlights
These regional summaries were provided by the six Regional Climate Centers and reflect conditions in their respective regions. These six regions differ spatially from the nine climatic regions of the National Centers for Environmental Information.
Northeast Region (Information provided by the Northeast Regional Climate Center)
- The Northeast had its 16th warmest October since 1895 with an average temperature of 52.2 degrees F (11.2 degrees C), 2.8 degrees F (1.6 degrees C) above normal. All twelve states were warmer than normal, with state departures ranging from 1.6 degrees F (0.9 degrees C) above normal in Maine to 4.7 degrees F (2.6 degrees C) above normal in West Virginia. Five states ranked this October among their 20 warmest on record: Delaware and Maryland, eighth warmest; New Jersey and West Virginia, ninth warmest; and Pennsylvania, 15th warmest. On October 1, five major climate sites (Erie and Harrisburg in Pennsylvania and Huntington, Beckley, and Elkins in West Virginia) had their hottest October day on record, with maximum temperatures up to 95 degrees F (35 degrees C). It was the first time on record that Beckley and Elkins recorded a maximum temperature of at least 90 degrees F (32 degrees C) during the month of October. Minimum temperatures ranked as the hottest on record for October in Erie and Beckley. The following day, on October 2, maximum temperatures approached 100 degrees F (38 degrees C) in some locations. Ten major climate sites had their hottest October day on record. For Huntington, Beckley, and Elkins, October 1 and 2, 2019, became the hottest and second hottest October days on record. Then October 3, Huntington, Beckley, and Elkins all tied their record high temperatures for the month of October which were just set two days prior on October 1. It was also the latest day in the calendar year that Beckley and Elkins recorded a high of at least 90 degrees F (32 degrees C). Both sites recorded two days with a maximum temperature of at least 90 degrees F (32 degrees C) in October for the first time on record.
- On the heels of an extremely dry September, the Northeast had its ninth wettest October on record, seeing 5.81 inches (147.57 mm) of precipitation, 151 percent of normal. All twelve states received above-normal precipitation, ranging from 123 percent of normal in Maine and New Hampshire to 171 percent of normal in West Virginia. This October ranked among the twenty wettest on record for ten states: Vermont, sixth wettest; New York, seventh wettest; Connecticut, 11th wettest; West Virginia, 13th wettest; Pennsylvania, 14th wettest; Massachusetts and New Jersey, 15th wettest; Rhode Island, 16th wettest; New Hampshire, 17th wettest; and Maryland, 19th wettest. Huntington, West Virginia’s longest streak of days with less than or equal to 0.01 inches (0.25 mm) of precipitation came to an end on October 5 at 38 days (started on August 28). Burlington, Vermont, had its wettest October on record.
- The U.S. Drought Monitor released on October 3 showed 8 percent of the Northeast was in a moderate or severe drought and 43 percent of the region was abnormally dry. There were areas of abnormal dryness in each of the twelve Northeast states, with drought conditions in parts of West Virginia, Maryland, Delaware, Pennsylvania, and New Jersey. Through mid-October, a few locations saw improvement but for a majority of the region conditions deteriorated, with the expansion of moderate drought and abnormal dryness, as well as the introduction of severe drought in parts of Maryland and Delaware. Several rounds of rain from mid- to late October allowed conditions to improve. The U.S. Drought Monitor released on October 31 showed the Northeast was free of drought for the first time since early September but that 30 percent of the region was still abnormally dry. There were several impacts from the drought, particularly during the first half of October. Streamflow was unusually low in many drought-affected areas of West Virginia, Maryland, and Delaware. Due to the drought, some West Virginia farmers fed hay to livestock earlier than usual because of poor pasture conditions and hauled in water for livestock because of dried-up water supplies. In portions of the state, farmers could be eligible for assistance to purchase water tanks and fittings to provide water to livestock. For the week ending October 6, the USDA crop report indicated topsoil moisture was rated short or very short for all of Delaware and 97 percent of Maryland, while subsoil moisture was rated short or very short for all of Delaware and 94 percent of Maryland. While the dry conditions contributed to lower soybean yields in parts of those states, particularly in fields that were not irrigated, it also allowed for a quick corn harvest, especially in Maryland. For example, 72 percent of Maryland’s corn had been harvested for grain (week ending October 6) compared to the five-year average of 39 percent. For the week ending October 13, the USDA crop report indicated that half of Delaware’s pastures were in poor condition. The dry conditions affected fall foliage in drought areas, contributing to muted colors in some areas and, in several cases, causing leaves to turn brown and drop before changing color. In early October, a state of emergency was declared for all 55 West Virginia counties due to drought. The state’s drought plan was to be implemented and residents were asked to conserve water. However, West Virginia’s statewide burn ban, which had been in effect since mid-September, was lifted. An increased risk of fires continued in parts of Maryland, where three Eastern Shore counties enacted burn bans. As of October 15, the salt line on the Delaware River was 11 miles farther upstream than usual for October due to little rain and less runoff flowing downstream. A Level 1 – Mild Drought (on a scale from Level 0 – Normal to Level 5 – Emergency Drought) was declared in the Connecticut River Valley Region of Massachusetts, leading to increased monitoring of conditions and prompting state officials to ask residents to reduce water use.
- On October 2, an EF-0 tornado touched down in Newport County, Rhode Island, making it the county’s first tornado on record (since 1950). A nor’easter strengthened into Subtropical Storm Melissa and stalled off the East Coast from October 8 to 12, causing high water levels and coastal flooding from the Chesapeake Bay to Massachusetts. Most locations experienced minor or moderate flooding but a few sites along Maryland’s Eastern Shore experienced major flooding. For instance, preliminary data showed the water level of the Chesapeake Bay at Cambridge, Maryland, reached 4.68 feet (1.43 m) on October 12, which ranks as the fourth highest water level since 1980. The storm also brought up to 3.50 inches (90 cm) of rain and damaging wind gusts of up to 60 mph (27 m/s) to eastern Massachusetts, Nantucket, and Martha’s Vineyard. A few days later, from October 16 to 17, a rapidly strengthening coastal storm brought strong winds and heavy rain to the region. The storm was so intense that it set new sea level pressure records for the month of October at Boston, Massachusetts; Providence, Rhode Island; Hartford, Connecticut; and Portland, Maine. The highest wind gusts of 70 mph (30 m/s) or greater occurred in New England, with Provincetown, Massachusetts, recording a gust of 90 mph (40 m/s) on October 17. The powerful winds downed trees, branches, and powerlines. More than 500,000 customers lost power in the Northeast, with the majority (around 200,000 each) in Massachusetts and Maine. Some Maine customers were without power for several days. Buildings and vehicles were damaged by falling limbs, and numerous roads were blocked by debris causing schools to close. The greatest storm rain totals of at least 4 inches (100 mm) occurred in eastern New York, northern New Jersey, and southern New England, with southeastern Connecticut seeing up to 6.15 inches (156.21 mm) of rain. Coastal areas once again experienced high water levels and generally minor or moderate tidal flooding. However, preliminary data indicated two locations along Maryland’s Eastern Shore (Chesapeake Bay coastline) just exceeded the major flooding threshold. From October 20 to 21, the remnants of tropical storm Nestor grazed the southeast corner of the region. The greatest storm rain totals of around 4 inches (100 mm) were in eastern Maryland. A powerful storm system moved through the region from October 31 to November 1. As much as 5 inches (130 mm) of rain fell across the region, causing several areas to experience flash flooding. Record-high water levels were reached at four stream gauges in New York and one in Vermont. A rare Flash Flood Emergency was declared for Frankfort, New York. Storm reports from Vermont, New York, Pennsylvania, and Maryland indicated numerous roads were flooded, including portions of major interstates in central Pennsylvania, and there were some water rescues and evacuations. In addition, a line of severe thunderstorms associated with the storm produced two tornadoes, an EF-2 in Delaware County, Pennsylvania, and an EF-1 in Morris County, New Jersey, as well as straight-line winds of up to 110 mph (49 m/s) in Bucks County, Pennsylvania. Across the Northeast, there were numerous reports of downed trees and branches and hundreds of thousands of customers lost power. The storm contributed to at least three deaths and at least six injuries.
- For more information, please visit the Northeast Regional Climate Center Home Page.
Midwest Region (Information provided by the Midwest Regional Climate Center)
- Stormy conditions led to moderate and heavy rain in October across much of the Midwest leaving only small areas below normal. Midwest precipitation for the month was 4.81 inches (122 mm) which was 1.80 inches (46 mm) above normal. This total ranked among the five wettest Octobers on record for the region (1895-2019). Minnesota, Wisconsin, Michigan, Iowa and Kentucky were all ranked among the ten wettest Octobers on record (1895-2019) as well. Amounts of more than 200 percent of normal were common across northern Iowa, southern Wisconsin, central Lower Michigan and southwestern Missouri. In the Upper Midwest, a large portion of this precipitation fell through the morning of October 2. Amounts of 3-4 inches (76-102 mm) were common from northeastern Iowa through southern Wisconsin and west-central Lower Michigan. More than 780 daily precipitation records were broken across the Midwest. Monthly precipitation records were also broken at more than 35 stations, including stations in Iowa, Michigan, Ohio, Wisconsin, and Kentucky.
- September temperatures were largely divided from west to east, with colder air pushing into the western half of the region. Midwest average temperatures were 50.6 degrees F (10.3 C) which was 0.4 degrees F (0.2 C) below normal. Warmth during the first week of October led to nearly 800 daily high maximum and high minimum records across the Midwest. This warmth decreased as Arctic air came into the region by the second week of the month. A large portion of the region recorded their first fall 32-degree F (0 C) freeze on the mornings of October 11-13. By the final week of October, record cold was observed across the western half of the region. More than 230 of the more than 430 daily low maximum and minimum temperature records broken across the region occurred from October 29-31.
- Several early season snowstorms brought record-breaking snow to areas in Missouri, Iowa and Wisconsin from October 28-31. Amounts of 2-4 inches (5-10 cm) were recorded through the mornings of October 28 and October 31, with locally heavier amounts. Isolated amounts of 6-8 inches (15-20 cm) in northwestern Illinois and southern Wisconsin were reported. More than 40 stations had record snowfall for October as a result. Some of these stations included Princeton, MO, Madison, WI, Fond Du Lac, WI, Wisconsin Dells, WI, Peoria, IL, Iowa City, IA and Dubuque, IA. An additional 325 daily snowfall records were also broken across the region.
- September temperatures allowed for additional growing degree days for crops, but significant delays occurred throughout October with the corn and soybean harvest. Moderate to heavy rainfall in the Upper Midwest made field work difficult, while the delayed spring planting season, and resulting delayed maturity, kept areas in the Ohio River Valley and Missouri from harvesting. As of the October 27 USDA NASS Crop Progress Report update, corn and soybean progress was behind the five-year average in every Midwest state except Kentucky. Wisconsin, Iowa, Missouri and Illinois were all more than 20 percent behind and Minnesota was 34 percent behind. Soybean progress more than 10 percent behind in Iowa, Missouri, Illinois and Michigan. Soybean harvest in Wisconsin was 27 percent behind, and Minnesota was 31 percent behind.
- Flooding and flash flooding occurred in southwestern Wisconsin and northeastern Iowa on October 1-2. Significant rainfall amounts over 6.00 inches (152 mm) fell in these areas, where the topography of the Driftless Area funnels heavy rain into valleys. As these waters drained and additional rain fell during the first week of October, minor flooding was observed along the Mississippi River from the Quad Cities through St. Louis. The Missouri River also had minor and moderate flooding during the first week of October due to heavy rainfall in late September.
- Drought significantly dissipated across Kentucky in October according to the U.S. Drought Monitor. On October 1, more than 90 percent of the state was in drought, with more than half the state in severe or extreme drought. By the end of the month, after the state had received nearly double the normal amount of October precipitation, drought coverage fell to just seven percent of the state. Drought coverage across the Midwest as of October 29 was less than four percent of the region, with most of these areas in the Ohio River Valley. Ohio was the only state in the Midwest to see an increase in drought in October, increasing from 12 to 25 percent of the state.
- For further details on the weather and climate events in the Midwest, see the weekly and monthly reports at the Midwest Climate Watch page.
Southeast Region (Information provided by the Southeast Regional Climate Center)
- Temperatures were well above average across the Southeast and Puerto Rico for the month of October. Monthly mean temperatures were over 5 degrees F (2.8 degrees C) above normal for nearly half of the 197 long-term (i.e., period of record equaling or exceeding 50 years) stations across the region. There were 26 stations that ranked or tied for 1st warmest in the Southeast region, as far as mean temperatures. This includes Sarasota, FL (1911-2019) at 6 degrees F (3.3 degrees C) above normal, Brunswick, GA (1948-2019) at 5.2 degrees F (2.9 degrees C) above normal, and Jacksonville, FL (1871-2019) at 4.5 degrees F (2.5 degrees C) above normal. Daily maximum temperatures ranged from 6.7 degrees F (3.7 degrees C) above normal in Charlotte, NC (1878-2019; T-2nd warmest) to 2.2 degrees F (1.2 degrees C) below normal in Oneonta, AL (1894-2019). Only 5 of the 197 long-term stations were below normal for daily maximum temperatures. During the first half of the month, an unseasonably warm airmass moved over the region with the Bermuda high positioned off the coast of the Carolinas, allowing for daytime maximum temperatures to reach well above normal. Several stations across the region observed their warmest October daily maximum temperature on record, including Montgomery, AL (1872-2019; 102 degrees F (39 degrees C)), Pensacola, FL (1879-2019; 97 degrees F (36 degrees C)), and Atlanta, GA (1878-2019; 98 degrees F (37 degrees C)). A few stations reported their maximum daytime temperature for the entire year, including Raleigh, NC (1887-2019; 100 degrees F (38 degrees C)), Athens, GA (1857-2019; 100 degrees F (38 degrees C)) and Asheville, NC (1869-2019; tied at 91 degrees F (33 degrees C)). Minimum temperatures ranged from 11.1 degrees F (6.2 degrees C) above normal in Marion, NC (1893-2019; T-6th warmest) to 0.7 degrees F (0.4 degrees C) above normal in Fairhope, AL (1917-2019). There were no long-term stations that were below normal for minimum temperatures. The coolest minimum temperatures occurred during the middle of the month and ranged from 21 degrees F (-6.1 degrees C) at Mount Mitchell, NC (1925-2019; October 17th) to 75 degrees F (24 degrees C) at Miami, FL (1895-2019; October 15th).
- Precipitation was highly variable across much of the Southeast region during October. The wettest locations were found in Virginia, the western Carolinas, central Georgia and western Alabama due to the impacts from tropical storms, Nestor and Olga. Monthly precipitation totals ranged from 150 to 300 percent of normal in these areas. There were 15 long-term stations that observed more than 5 inches (127 mm) of precipitation above normal for October, including Daytona Beach, FL (1923-2019; 13.8 inches (351 mm)) at 9.6 inches (244 mm) above normal, Mobile, AL (1871-2019; 11.1 inches (282 mm)) at 7.4 inches (188 mm) above normal, and Marion, NC (1893-2019; 8.8 inches (224 mm)) at 5.4 inches (137 mm) above normal. On October 25th, a plume of tropical moisture from Tropical Storm Olga moved northward from the Gulf into southern Alabama. As a result, Tuscaloosa, AL (1948-2019) observed a new maximum daily precipitation record for October at 6.5 inches (165 mm) of rain. In contrast, unusual dryness was found in the eastern Carolinas, northeastern Georgia and parts of the panhandle of Florida where the precipitation values ranged from 90 to less than 50 percent of normal. There were 30 long-term stations that observed below normal precipitation totals for October, including San Juan, PR (1898-2019; 2.8 inches (71 mm)) at 2.7 inches (68 mm) below normal, Miami, FL (1895-2019; 3.9 inches (99 mm)) at 2.4 inches (61 mm) below normal, and Plymouth, NC (1945-2019; 2.4 inches (61 mm)) at 1.3 inches (33 mm) below normal.
- There were 219 severe weather reports across the Southeast during September, which is more than 4 times the median monthly frequency of 46 reports during 2000-2018. There were 13 confirmed tornadoes reported for the month, a few more than the monthly average of 10. Most of these tornadoes were ranked EF-0 and resulted in some minor damage to buildings and downed trees. The most damaging tornado was rated an EF-2 with winds of 120 mph (54 m/s) and occurred in Polk County, FL, due to Tropical Storm Nestor. This tornado damaged around 50 homes and lifted a camper onto a residence. An EF-1 tornado in Semmes, AL is the only tornado that resulted in an injury. There were no reports of hail for the month. There were 201 severe wind reports for the month, with the vast majority (178) occurring on October 31st. The strongest of these reported winds occurred in North Carolina, with Blowing Rock reporting a wind gust of 68 mph (30 m/s) and Baldwin reporting 64 mph (28 m/s). One fatality was reported in Fulton County, GA, where strong winds below a tree onto a moving vehicle killing a 38-year old woman who worked for the City of Atlanta.
- Overall drought conditions changed very little for the month of October, with some areas improving and other areas increasing in drought. The flash drought that developed toward the end of September, intensified during the first half of October. By the end of the month, however, rains from Tropical Storms Nestor and Olga provided some relief, especially in parts of central and southern Georgia, which saw the biggest drought improvement. In contrast, pockets of extreme drought (D3) developed in central Alabama, northern Georgia, and western South Carolina. Severe drought (D2) still covered parts of Alabama, northern Florida, and areas in central South Carolina. Moderate drought (D1), ringed by an area of dry conditions (D0), expanded through western North Carolina, western South Carolina, Georgia, Virginia, northern Florida, and much of Alabama. Severe drought (D2) and moderate drought (D1) are gone from Puerto Rico with an area of dry conditions (D0) covering the southern area. Recent rainfall in Alabama provided a boost to cool season pastures; however, this slowed down the cotton and soybean harvesting. Collier and parts of Putnam, Lee, and Hendry counties in Florida showed abnormally dry conditions; however, the remaining portion of the citrus growing region remained drought-free. As a result, the citrus crops continue to do well. In Talbot County, GA, the drought continued, and the soil was too dry to plant winter grazing. Livestock producers continue to provide supplemental feeding. Peanut harvest in Terrell County, GA is finishing up, but rain really deteriorated some of the vine integrity of the peanuts yet to be picked. Producers in Evans County, GA are about to start Vidalia onion planting with very little water reserves but if the county doesn’t receive more rain, then the soil will run out of the moisture needed to get a good stand. The above normal temperatures have increased soybean maturity at earlier than normal dates in NC, and in Craven County, NC most soybeans still have too many leaves and are not dry enough to harvest.
- For more information, please visit the Southeast Regional Climate Center Home Page.
High Plains Region (Information provided by the High Plains Regional Climate Center)
- In a sharp contrast to the warm September that the region experienced, October brought much colder conditions to the High Plains. Below-normal temperatures were widespread throughout the region, with the largest departures of nearly 12.0 degrees F (6.7 degrees C) in areas of Wyoming and western South Dakota. Consequently, many locations experienced their coolest Octobers on record, such as Casper, Wyoming; Grand Junction, Colorado; and Rapid City, South Dakota. Similar to September, precipitation was not uniform across the region, with above-normal precipitation generally in the northern, southern, and eastern portions of the High Plains region. Meanwhile, below-normal precipitation was observed across the central and western parts of the region, with the exception of the higher elevations of the Front Range in central Colorado and across northeast Wyoming where heavier precipitation was recorded. Parts of the Dakotas were once again particularly wet, with widespread precipitation totals in excess of 200 percent of normal across northern South Dakota and much of North Dakota. As much colder air filtered into the region during October, many places observed their first measurable snowfall of the season. A large storm system moved across the Dakotas on the 10th through the 12th and brought historic, early season snowfall. This resulted in several locations observing their top 10 snowiest Octobers on record. This potent storm caused a variety of impacts in the Dakotas, including widespread tree damage, power outages, and stranded motorists. In the storm’s wake, there was widespread basement flooding and increased river flooding due to snowmelt and rainfall that preceded the snow.
- Not surprisingly, fall harvest activities were behind schedule this month, especially in the Dakotas. As of early November, nationally, it was the second slowest corn and soybean harvest since 1995 - only 2009 was slower. Wet soils across much of the region will continue to slow this year’s harvest and some producers may have to wait until soils freeze to get out into the fields. It is also possible that some crops will go unharvested this fall.
- In contrast to September, temperatures across the High Plains region were well below normal this month. The greatest temperature departures occurred across portions of Wyoming and western South Dakota where temperature departures of nearly 12.0 degrees F (6.7 degrees C) below normal were observed. More widespread departures of 6.0-8.0 degrees F (3.3-4.4 degrees C) below normal were found across nearly all of Wyoming, much of South Dakota, North Dakota, and western Nebraska. Consequently, some areas experienced their top 5 coolest Octobers on record, including Casper, Wyoming (coolest); Grand Junction, Colorado (coolest); Rapid City, South Dakota (coolest); Alamosa, Colorado (2nd coolest); and Pueblo, Colorado (2nd coolest). Across other parts of the region, temperature departures were not as large; however, average temperatures were still up to 6.0 degrees F (3.3 degrees C) below normal for the month of October.
- An unusually cold air mass at the end of the month caused many locations to set new records. For instance, Casper, Wyoming set two new records for the month of October - one for lowest minimum temperature and one for lowest maximum temperature. Both of these records occurred on October 29th, when the maximum temperature was 8.0 degrees F (-13.3 degrees C) and the minimum temperature was -9 degrees F (-22.8 degrees C). Each of these new records beat out previous records by several degrees. The temperature dipped to -9 degrees F (-22.8 degrees C) again on the 30th, tying the record from the previous day. Interestingly, four of the top ten lowest October temperatures on record for Casper all occurred during October 2019 (period of record 1939-2019).
- Heavy precipitation continued to impact portions of the High Plains region this month, with areas of North Dakota, South Dakota, and eastern Nebraska receiving precipitation in excess of 200 percent of normal, with a small pocket along the North and South Dakota border receiving in excess of 300 percent of normal precipitation. This resulted in several locations in the Dakotas and eastern Nebraska ranking in the top 10 wettest Octobers on record, including Omaha, NE (4th wettest); Bismarck, ND (6th wettest); Grand Forks, ND (8th wettest); Mobridge, SD (8th wettest); and Lincoln, NE (9th wettest). October also turned out to be quite a snowy month for some areas of the High Plains region. Several locations had monthly totals that ranked among the top 10 snowiest Octobers on record, such as, Bismarck, ND (2nd snowiest); Pueblo, CO (3rd snowiest); Colorado Springs, CO (5th snowiest); Fargo, ND (5th snowiest); and Aberdeen, SD (7th snowiest).
- Several storm systems impacted the region this month. On October 10-12, a particularly strong storm system brought heavy precipitation, strong winds, and much colder conditions to the northern High Plains. The combination of plentiful moisture, sub-freezing temperatures, and a slow moving low pressure system created historic snowfall over much of North Dakota and parts of South Dakota. In these areas, many locations reported 1 to 3 feet (30-91 cm) of snow. In addition to the heavy snow, strong winds created near whiteout conditions and prompted the issuance of blizzard warnings. The intense winds created drifts that were up to several feet high. According to the National Weather Service in Grand Forks, ND, drifts were as tall as some houses in the Devils Lake area. Impacts from the storm were exacerbated by its timing as widespread tree damage occurred because leaves had not fully dropped and many crops were unharvested when the storm struck. On October 21, Governor Doug Burgum declared a statewide flood emergency for North Dakota so that federal aid could assist those dealing with flooding caused by rain and snowmelt.
- The 2019 runoff season is still on track to be among the highest on record for the upper Missouri River Basin (above Sioux City, Iowa). As of November 5, 2019, the U.S. Army Corps of Engineers’ 2019 runoff forecast for the upper Missouri River Basin was 60.2 million acre-feet (MAF), which is 238% of average. The record occurred in 2011 with 61.0 MAF. Heavy precipitation caused streamflows to remain much above normal to high across much of the Missouri River Basin and the Souris-Red-Rainy Basin this month. Widespread record high streamflows for the month of October occurred across northern and eastern portions of North Dakota, eastern and southern South Dakota, and central Nebraska. For weekly updates on the status of the Missouri River Basin, please see: http://www.nwd-mr.usace.army.mil/rcc/index.html.
- Across the remainder of the region, drier conditions prevailed, with the driest conditions being located across eastern Colorado, western Nebraska, and western Kansas. In much of this area, less than half of the normal October precipitation fell during the month, with some places not even receiving a quarter of their normal October precipitation.
- Drought conditions expanded and intensified across southern and western portions of the High Plains region this month. According to the U.S. Drought Monitor, the area experiencing drought (D1-D4) in the High Plains region increased from approximately 3 percent at the end of September to just over 13 percent at the end of October. This increase included the development and expansion of drought in areas of southern and western Colorado and southwestern Kansas where precipitation deficits have mounted over the past several months.
- This month, abnormally dry conditions (D0) expanded out across portions of eastern Colorado and into western Kansas and a small portion of southwestern Nebraska. D0 was removed in parts of southern and western Wyoming; however, an area in the southwestern part of the state remained. Meanwhile, moderate drought (D1) expanded across the southwestern half of Colorado and a small portion of southwestern Kansas, while severe drought (D2) developed and expanded across some portions of this same area. Colorado had the largest expansion in the region, as 60 percent of the state was in drought at the end of the month. Just over 27 percent of the state was in D2.
- Other areas of the region continued to be drought-free. As of the October 29th release of the U.S. Drought Monitor, both Nebraska and South Dakota have been drought-free all of 2019.
- For more information, please visit the High Plains Regional Climate Center Home Page.
Southern Region (Information provided by the Southern Regional Climate Center)
- Temperatures for the month of October varied spatially across the Southern Region, with below-normal temperatures in the northern and western part of the region and above-normal temperatures in the southern and eastern part of the region. Parts of northern Texas and western Oklahoma experienced temperatures 6 to 8 degrees F (3.33 to 4.44 degrees C) below normal. Parts of northern Texas and western Oklahoma experienced temperatures 4 to 6 degrees F (2.22 to 3.33 degrees C) below normal, while parts of northern Texas, northern Arkansas, and most of Oklahoma experienced temperatures 2 to 4 degrees F (1.11 to 2.22 degrees C) below normal. Conversely, parts of southern Texas, southeastern Louisiana, northern, central, and southern Mississippi, and central and eastern Tennessee experienced temperatures 2 to 4 degrees F (1.11 to 2.22 degrees C) above normal, while parts of southeastern Louisiana, southern Mississippi, and eastern Tennessee experienced temperatures 4 to 6 degrees F (2.22 to 3.33 degrees C) above normal. The statewide monthly average temperatures were as follows: Arkansas – 61.00 degrees F (16.11 degrees C), Louisiana – 69.40 degrees F (20.78 degrees C), Mississippi – 66.90 degrees F (19.39 degrees C), Oklahoma – 57.90 degrees F (14.39 degrees C), Tennessee – 61.90 degrees F (16.61 degrees C), and Texas – 65.60 degrees F (18.67 degrees C). The statewide temperature rankings for October were as follows: Arkansas (forty-eighth coldest), Louisiana (twenty-ninth warmest), Mississippi (twenty-sixth warmest), Oklahoma (twelfth coldest), Tennessee (nineteenth warmest), and Texas (forty-seventh coldest). All state rankings are based on the period spanning 1895-2019.
- Precipitation values for the month of October varied spatially across the Southern Region, with above-normal precipitation across the central and eastern parts of the region and below-normal precipitation across much of the western part of the region. Parts of western and southwestern Oklahoma as well as northern, western, central, and southern Texas received 50 percent or less of normal precipitation. Parts of north-central, southern, and western Texas received 25 percent or less of normal precipitation, while parts of north-central and western Texas received 5 percent or less of normal precipitation. In contrast, parts of northern and eastern Texas, western and eastern Oklahoma, northern and southeastern Louisiana, northwestern, southern, and eastern Arkansas, and most of Mississippi and Tennessee received 150 percent or more of normal precipitation. Parts of northern Texas, western and eastern Oklahoma, northwestern, eastern, and southeastern Arkansas, northeastern and southeastern Louisiana, western and eastern Tennessee, and most of Mississippi received precipitation 200 percent or more of normal, while parts of northern Texas, western Oklahoma, northwestern Arkansas, southeastern Louisiana, southwestern Tennessee, and central and southern Mississippi received precipitation 300 percent or more of normal. The statewide precipitation totals for the month were as follows: Arkansas – 7.34 inches (186.44 mm), Louisiana – 7.88 inches (200.15 mm), Mississippi – 10.42 inches (264.67 mm), Oklahoma – 4.48 inches (113.79 mm), Tennessee – 7.14 inches (181.36 mm), and Texas – 2.56 inches (65.02 mm). The state precipitation rankings for October were as follows: Arkansas (eighth wettest), Louisiana (eleventh wettest), Mississippi (first wettest), Oklahoma (twenty-fourth wettest), Tennessee (third wettest), and Texas (forty-ninth wettest). This was the sixth wettest October on record for the Southern Region. All state rankings are based on the period spanning 1895-2019. Drought and Severe Weather:
- At the end of October, drought conditions both improved and deteriorated across the Southern Region. Extreme drought conditions persisted across central and southern Texas, with minor areas seeing either improvement or development. Severe drought classifications were still present in central, eastern, and southern Texas as well as southwestern Oklahoma and southeastern Tennessee, while new areas developed in extreme western Oklahoma. However, severe drought conditions improved across southwestern Oklahoma, and these conditions were removed in southwestern Arkansas and northwestern Louisiana. Moderate drought classifications decreased across northern Texas, northern Louisiana, southern Arkansas, and central and western Tennessee, while new areas developed in extreme western Oklahoma. There was a decrease in the overall area experiencing abnormally dry conditions as abnormally dry conditions were removed across southern Arkansas, northern Louisiana, western Tennessee, and northern, western, and eastern Mississippi.
- In October, there were a total of 334 storm reports across Oklahoma, Texas, Arkansas, Louisiana, Mississippi, and Tennessee. There were 28 tornado reports, 68 hail reports, and 238 wind reports. Texas tallied the most tornado (14), hail (33), and wind (63) reports. Unsurprisingly, Texas tallied the most reports total (110), while Mississippi tallied the fewest (27). Every state with the exception of Mississippi reported tornadoes, while every state with the exceptions of Louisiana and Mississippi reported at least one hail report.
- A strong cold front passed through the region during the last full week of October, bringing notable snowfall to parts of Oklahoma and Texas. A cooperative observer near Arnett, Oklahoma reported 13 inches of snow, which set the Oklahoma state record for snowfall accumulation in a 24-hour period. Texas received the third-greatest snow accumulation on record for October, as Pampa, Texas reported just over 8 inches of snow.
- A tropical system impacted the Southern Region in October as the remains of Tropical Storm Olga passed over southeastern Louisiana and southern Mississippi on October 25. Wind gusts between 30-70 mph (48.28 – 112.65 kph) were reported, with a peak wind gust of 73 mph (117.48 kph) reported in Mandeville, Louisiana.
- On October 10, 2019, tea-cup sized hail was reported near White Settlement, Texas. Also, a wind gust of 65 mph (104.61 kph) was reported near Cecil, Arkansas.
- On October 20, 2019, there were 190 storm reports across Texas, Oklahoma, Arkansas, Louisiana, and Tennessee. There were 25 tornado reports, 40 hail reports, and 125 wind reports. Texas had the most tornado (14), hail (20), and wind (46) reports. The strongest tornado reported was an EF-3 that impacted northern Dallas county near Dallas, Texas. Three people were injured by a tornado that impacted an elementary school and a convenience store near Tyronza, Arkansas. Two people were killed after trees were blown down on residences, with one person killed in Rogers, Arkansas and the other killed near Valliant, Oklahoma. An injury was also reported at the Valliant, Oklahoma incident. Baseball-sized hail was reported near Milburn, Oklahoma and Prague, Oklahoma, while a wind gust of 82 mph (131.97 kph) was reported near Hoffman, Oklahoma.
- On October 21, 2019, a tornado was reported near Geismar, Louisiana, resulting in an injury.
- On October 26, 2019, one person was killed after a tree fell on them near Adamsville, Tennessee. Wind gusts of 74 mph (119.09 kph) were reported near Ripley, Arkansas.
- On October 31, 2019, a tornado was reported near Tazewell, Tennessee. One person was killed after strong winds blew a tree down onto a vehicle near Halls, Tennessee.
- For more information, please visit the Southern Regional Climate Center Home Page.
Western Region (Information provided by the Western Region Climate Center)
- An amplified jet stream produced a variety of weather extremes in the West this month including extreme cold and snowfall in the Inland Northwest and dangerous fire weather conditions in California. Temperatures averaged to well below normal in the Great Basin and Rocky Mountain states. Little to no precipitation was observed across the Southwest, not atypical for the autumn season, while some areas of the Northwest observed well above normal precipitation.
- Dry conditions dominated across much of the Southwest this month. At the end of October, St. George, Utah, had observed 136 consecutive days with no measurable precipitation. The previous record was set in 1929-1930 at 121 days and records for St. George began in 1893. According to the US Drought Monitor, drought conditions persisted and in some cases expanded this month across the Four Corners states, most notably in central Utah. At the end of October, 22% of the West was experiencing moderate or worse drought conditions, compared with 16% at the start of the month. Abnormally dry conditions were extended across the southern Great Basin. One exception to the dry conditions in the Southwest this month occurred in southeastern New Mexico. Heavy rainfall associated with a decaying tropical system resulted in flash flooding on October 1, when 3.44 in (87 mm) of rain fell. Roswell, New Mexico, reported 4.83 in (123 mm) for the month of October, 393% of normal and the 4th wettest October since records began in 1946. Along the northern tier of the West, some locations observed above normal precipitation. In eastern Washington, Spokane reported 1.53 in (39 mm), 130% of normal. In northwestern Montana, Choteau logged 1.31 in (33 mm) 247% of normal. In some cases, this precipitation fell as snow. Great Falls, Montana, logged 17 in (43 cm) of snow for the month, 12.9 in (33 cm) above normal and the snowiest October since records began in 1937.
- Cold Arctic air masses impacted much of the West this month and several locations recorded their coldest October on record. Some of these include Spokane, Washington (average temperature of 42.3 F (5.72 C), 5.3 F (2.9 C) below normal), Salt Lake City, Utah (average temperature of 46.5 F (8.1 C), 6.5 C (3.6 C) below normal) and Pocatello, Idaho (average temperature of 38.4 F (3.6 C), 8.6 F (4.8 C) below normal). Records for Spokane, Salt Lake City, and Pocatello began in 1881, 1928, and 1939, respectively. Salt Lake City recorded its coldest October day on record at 14 F (-10 C) on October 30. In contrast, temperatures were slightly above normal along the central and southern California coast.
- Warmer and wetter than normal conditions were present across much of Alaska this month. Temperature anomalies varied from roughly 2 F (1.1 C) above normal in the Southcentral region to more than 10 F (5.5 C) above normal in the northern part of the state. Fairbanks reported an average temperature of 31.7 F (-0.2 C). 7.5 F (4.2 C) above normal, while further west, Kotzebue reported 30.9 F (-0.6 C) for the month, 6.6 F (3.7 C) above normal and tie for the 8th warmest October since records began in 1897. Precipitation at Fairbanks totaled 1.68 in (42 mm), 202% of normal. Nome reported 4.42 in (112 mm) of precipitation, 274% of normal and the 2nd highest for October in a 120-year record. The exception was in the southeastern part of the state, where temperatures were near to slightly below normal and precipitation varied between 50-100% of normal. Moderate to severe drought conditions persisted in this area through October. Further south, above normal sea surface temperatures in the vicinity of Hawaii supported well above normal and in some cases record-breaking October temperatures. Hilo, on the windward side of the Big Island, reported an average temperature of 79.6 F (26.4 C), 4 F (2.2 C) above normal and the warmest October in a 71-year record. Precipitation was variable across the state, with windward areas generally receiving above normal precipitation while leeward areas saw below normal precipitation. Roughly 15% of the state is experiencing drought conditions, most of which is located in Maui County. Some improvements in drought conditions were made this month on Oahu and Lanai. Significant Events for October 2019
- October (all month): Above normal snowfall in Inland Northwest:: Season-to-date snowfall in Great Falls, Montana, reached 36.3 in (92 cm) by the end of October. This is more than half of the normal annual snowfall of 63.5 in (181 cm). Snowstorms impacted the area in the early part of the month (8th-9th) and again during the latter part (26th-28th), creating travel impacts in some areas. A snowstorm in eastern Idaho on October 28-29 resulted school cancellations, multiple car accidents, and road closures.
- Mid-to-late October: Persistent fire weather and wildfires in California:Back-to-back Santa Ana and Diablo wind events combined with dry vegetation produced conditions favorable for multiple impactful wildfires across the state. The Saddle Ridge Fire near Sylmar in southern California was ignited on October 10 and burned 8,799 acres (3560 ha), damaged or destroyed 107 structures, and was associated with one fatality. The Tick Fire, near Canyon Country in southern California, was ignited on October 24 and burned 4615 acres (1869 ha) and damaged or destroyed 49 structures. In northern California, the Kincade Fire began on October 23 and had consumed nearly 78,000 acres (31,565 ha) by the end of the month and destroyed 372 structures. The wildfires produced poor air quality for communities nearby and downwind of the wildfire locations. As a preventative measure against wildfires sparked by power lines, utility companies implemented power shutoffs that affected millions of people in California during the fire weather events. These shutoffs were more widespread and prolonged than in previous years and have resulted in economic impacts and public discontent.
- For more information, please go to the Western Regional Climate Center Home Page.