|
Contents Of This Report: |


|
Please note that the values presented in this report are based on preliminary data. They will change when the final data are processed, but will not be replaced on these pages.
National Drought Overview
|
|
[top]
Detailed Drought Discussion
Overview

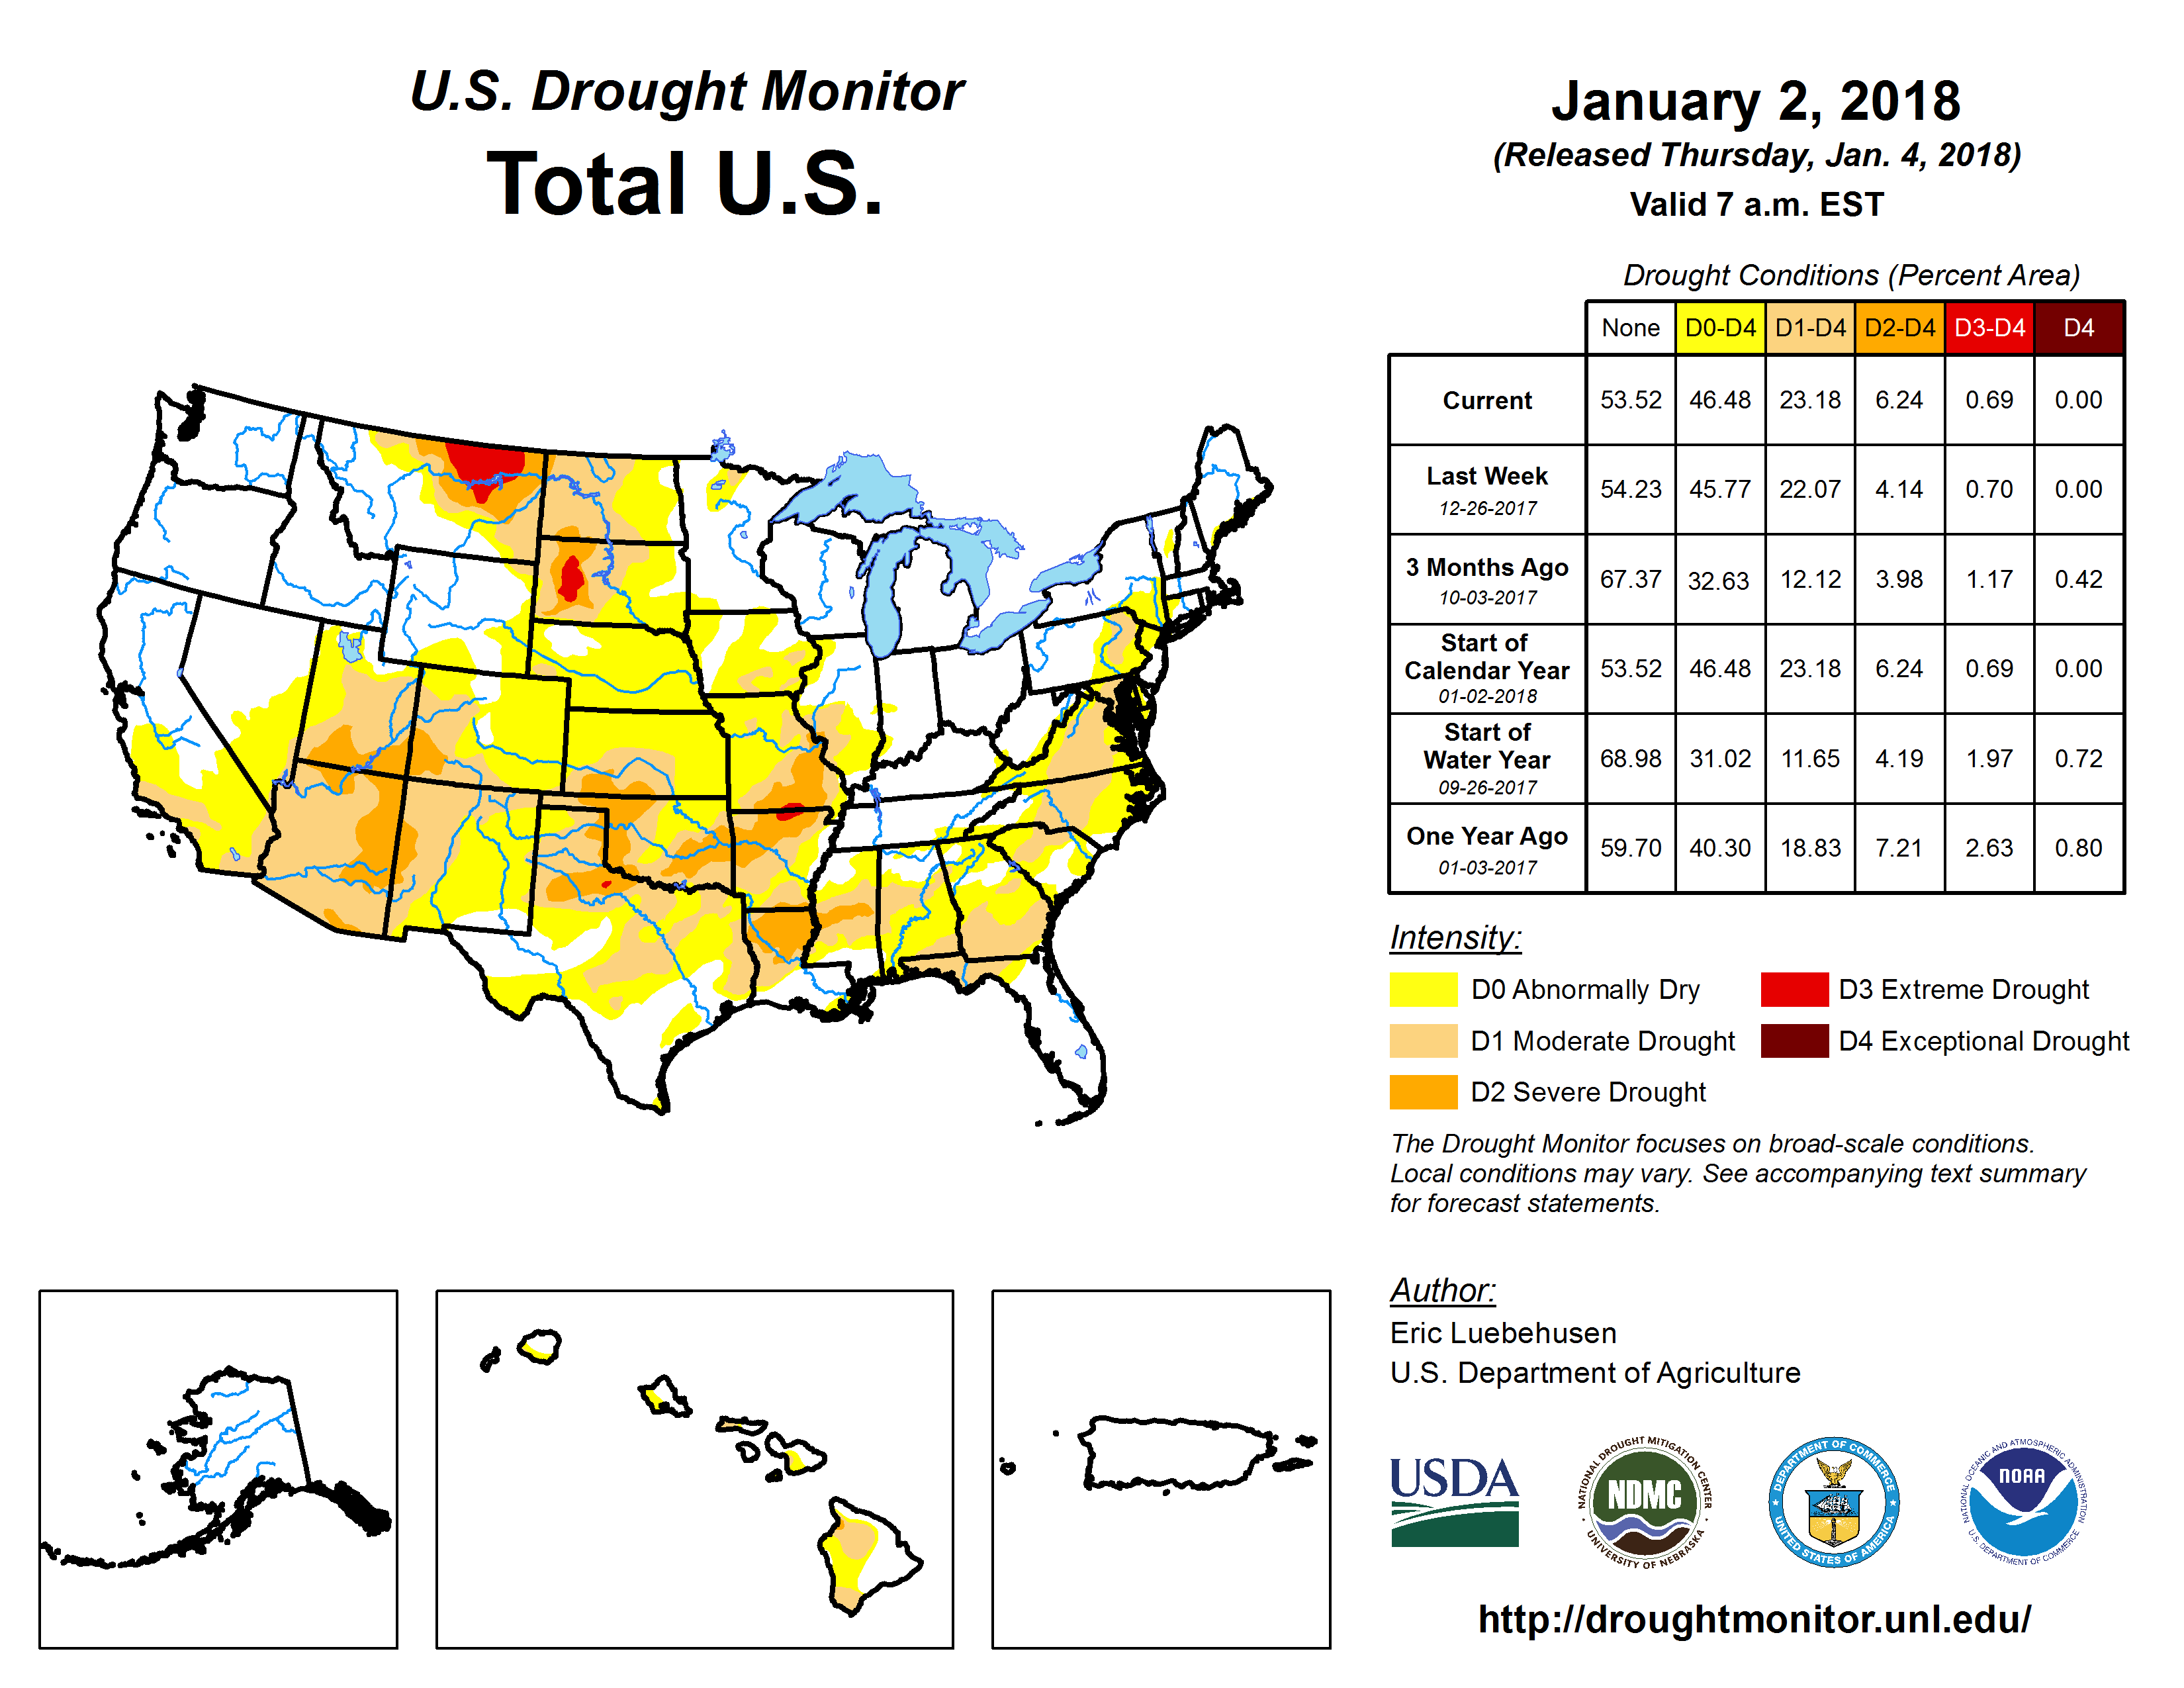
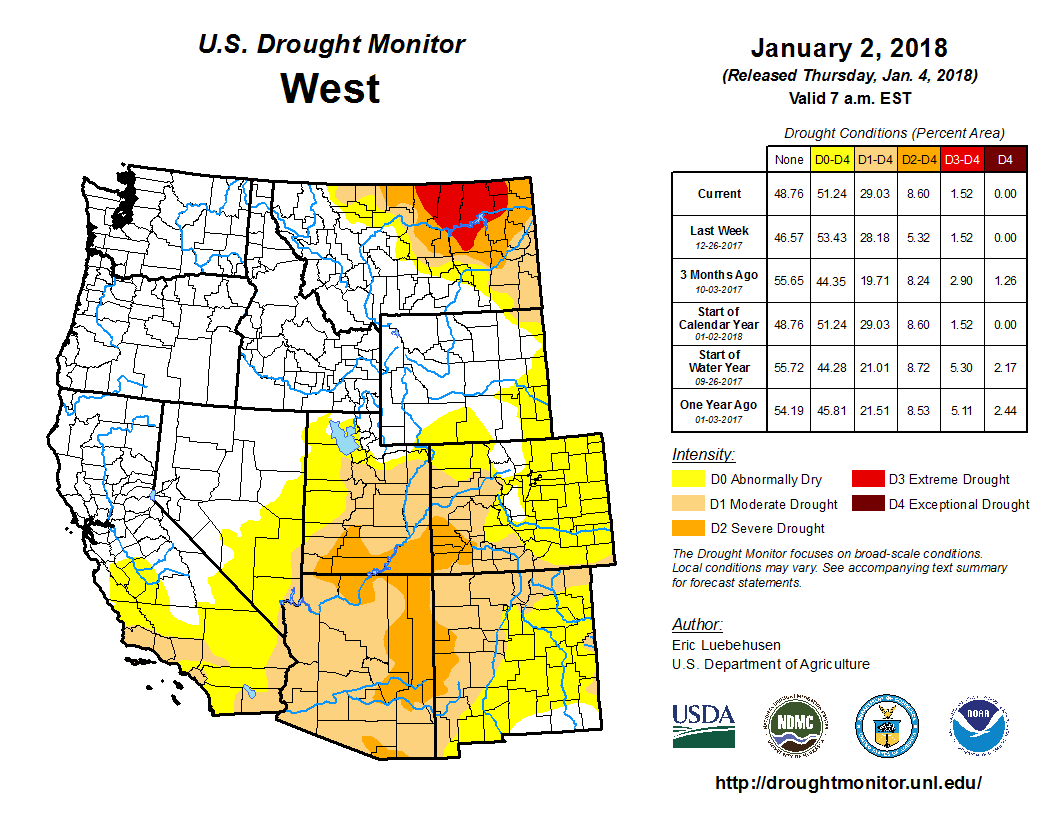
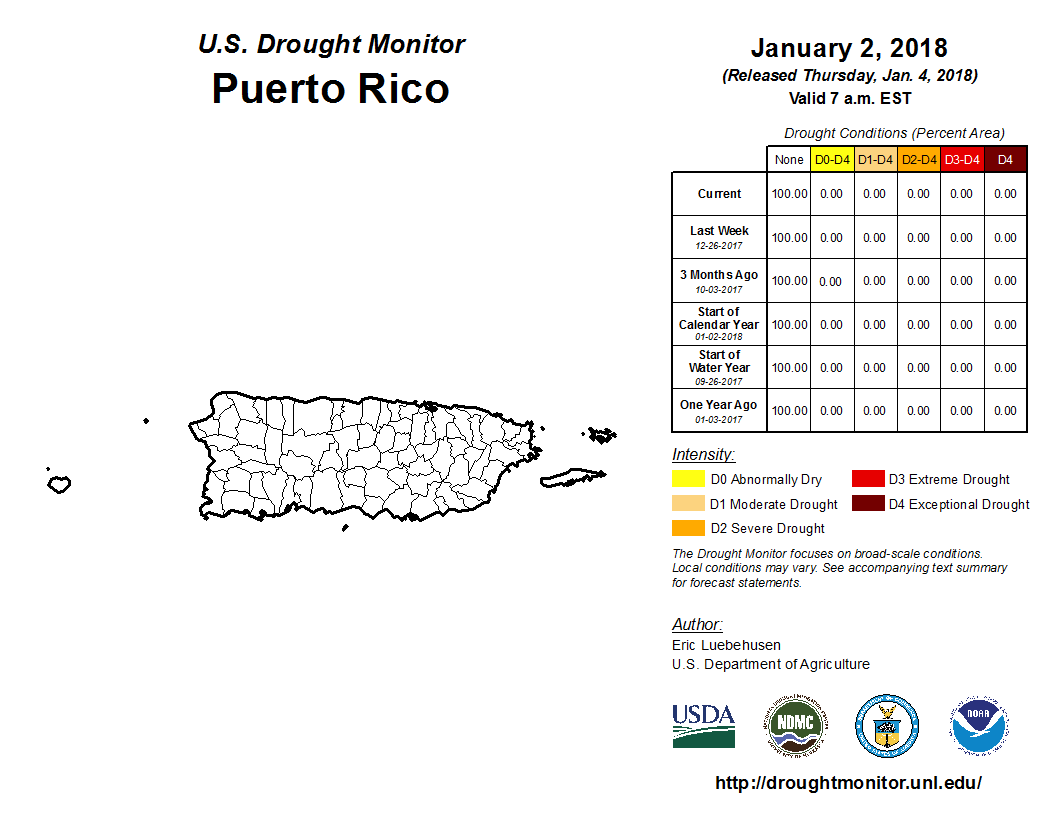
The U.S. Drought Monitor drought map valid January 2, 2018.
The atmospheric circulation varied considerably during December 2017, switching from a zonal pattern to ridge/trough pattern and back again to zonal then meridional. The flip/flopping between western ridge, westerly flow, and (over the central CONUS) northwesterly flow generally kept moist air masses away from much of the country. The net result was a drier-than-normal month across most of the West, central Plains to Midwest, Mid-Atlantic to southern New England, and parts of the Southeast. Montana, Wyoming, and southern Texas were significantly wetter than normal, and parts of the northern Plains, Lower Mississippi Valley, coastal Southeast, and northern New England had areas that were wetter than normal. With ridging mostly dominating, Alaska was warmer than normal with a mixed precipitation anomaly pattern. Hawaii was mostly drier than normal. Even though December is in the midst of winter, daytime temperatures were still warm in the southwestern CONUS. The persistent ridging brought excessive warmth to the Southwest, increasing evapotranspiration which exacerbated the dry conditions, resulting in expansion of abnormal dryness and drought in this region. For the Southwest, as well as southern to central Plains, Mid-Mississippi Valley, Mid-Atlantic region, and parts of the Southeast and Northeast, the December dryness was a continuation of dry conditions which have lasted for the last 2, 3, and even 6 months in some areas. Consequently, abnormal dryness and drought expanded in these areas. There was some contraction of drought and abnormal dryness in the areas where December precipitation was above normal (Montana and parts of the southern Plains and Southeast), but expansion outweighed contraction, so the USDM-based national moderate-to-exceptional drought footprint across the CONUS expanded from 21.1 percent of the CONUS at the end of November to 27.7 percent of the CONUS at the end of December (from 17.7 percent to 23.2 percent for all of the U.S.). According to the Palmer Drought Index, which goes back to the beginning of the 20th century, about 24.8 percent of the CONUS was in moderate to extreme drought at the end of December, almost double last month's 13.0 percent.

Drought conditions at the end of the month, as depicted on the January 2nd, 2018 USDM map, included the following core drought and abnormally dry areas:
- There was some contraction in Montana, but abnormal dryness (D0) to extreme (D3) drought continued in the northern High Plains.
- Abnormal dryness to severe (D2) drought expanded, and extreme drought continued, in the central and southern Plains to Lower and Mid-Mississippi Valley.
- Abnormal dryness to severe drought expanded in the Southwest. — The percent area of the West (from the Rockies to the West Coast) in moderate to extreme drought (based on the Palmer Drought Index) rapidly increased in December, growing from 22.7 percent at the end of November to 54.1 percent at the end of December.
- Abnormal dryness and moderate (D1) drought expanded in the Southeast and Mid-Atlantic states.
- Abnormal dryness expanded and moderate drought returned to parts of the Northeast.
- There was some contraction, but moderate to severe drought conditions continued in Hawaii.
There was no drought or abnormal dryness in Puerto Rico and Alaska.
Palmer Drought Index
The Palmer drought indices measure the balance between moisture demand (evapotranspiration driven by temperature) and moisture supply (precipitation). The Palmer Z Index depicts moisture conditions for the current month, while the Palmer Hydrological Drought Index (PHDI) and Palmer Drought Severity Index (PDSI) depict the current month's cumulative moisture conditions integrated over the last several months. While both the PDSI and PHDI indices show long-term moisture conditions, the PDSI depicts meteorological drought while the PHDI depicts hydrological drought. The PDSI map shows less severe and extensive drought (as well as wet spell conditions) in parts of the country than the PHDI map because the meteorological conditions that produce drought and wet spell conditions are not as long-lasting as the hydrological impacts.
|
 |
Used together, the Palmer Z Index and PHDI maps show that short-term dry conditions occurred across much of the West, eliminating previous long-term wetness (in the Great Basin) and intensifying or expanding long-term drought (in the Southwest). Short-term dry conditions occurred across the Mid-Mississippi Valley, expanding and intensifying previous long-term drought. Short-term dry conditions occurred across parts of the Southeast, Mid-Atlantic, and Northeast, expanding and intensifying previous long-term drought and shrinking previous long-term wet conditions. Short-term near-normal to wet conditions over Montana, Wyoming, and southern Texas contracted previous long-term drought.
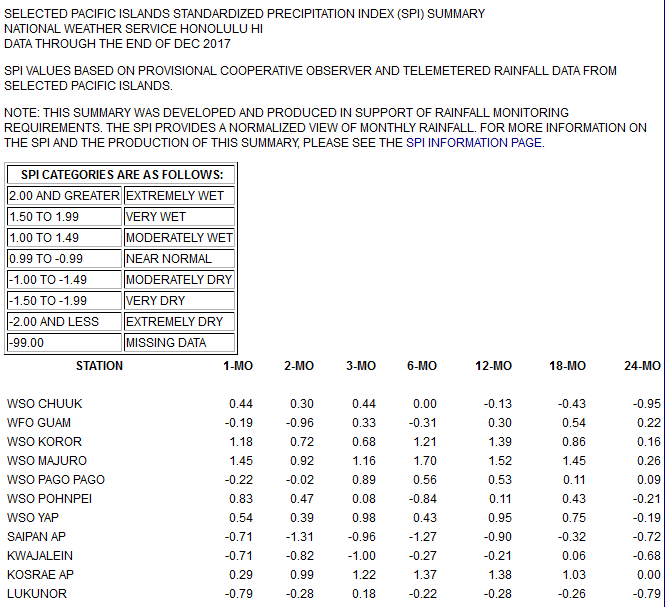
Standardized Precipitation Index
The Standardized Precipitation Index (SPI) measures moisture supply. The SPI maps here show the spatial extent of anomalously wet and dry areas at time scales ranging from 1 month to 24 months.
 |
 |
 |

The SPI maps illustrate how moisture conditions have varied considerably through time and space over the last two years. Dryness across much of the West is evident on the 1-month map, and across the Southwest dominates the 2- to 9-month time scales, and is even present (from Arizona to Colorado) at the 12- to 24-month time scales. Montana is wet at the 1- to 3-month time scales, long-term dryness dominates from 6 to 12 months, and near-normal to wet conditions are evident at 24 months. Parts of the southern Plains to Lower Mississippi Valley are near normal to wet on the 1-month map, dryness is widespread on the 2- and 3-month maps, but near-normal to wet conditions become evident at 6 months and dominate and 9 to 24 months. In the central Plains, dryness dominates at 1 to 2 months, wet conditions creep in at 3 months, there is a clash between wet and nearby dry conditions at 6 months, but near-normal to wet conditions win out at 9 to 24 months. In the northern Plains, near-normal to wet conditions try to rally on the 1-month map, but dry conditions dominate at 2 to 12 months, while near-normal conditions reclaim the region at 24 months, except for the western Dakotas where dryness still holds sway. Dry conditions dominate or are a major player in the Southeast at the 1- to 6-month and 12-month time scales, while near-normal to wet conditions are evident at 9 to 12 months. Dryness is evident in the Northeast at 1 to 6 months, and also 24 months, especially in southern New England, while wet conditions are evident at 3 to 24 months along the Great Lakes and in northern New England.
 |
 |
 |
Regional Discussion

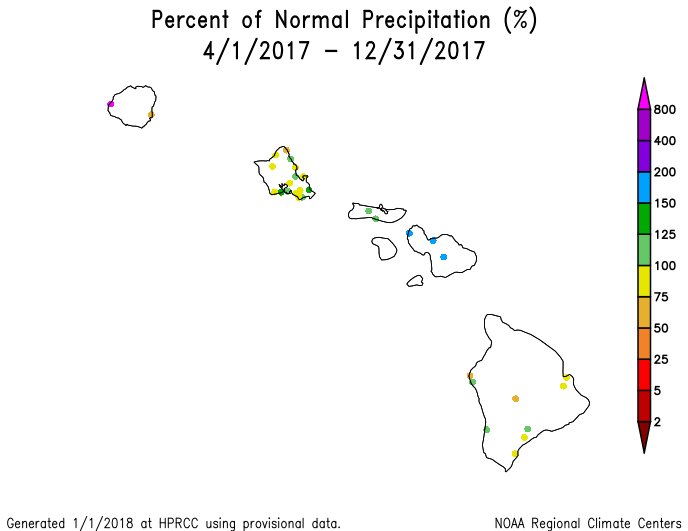
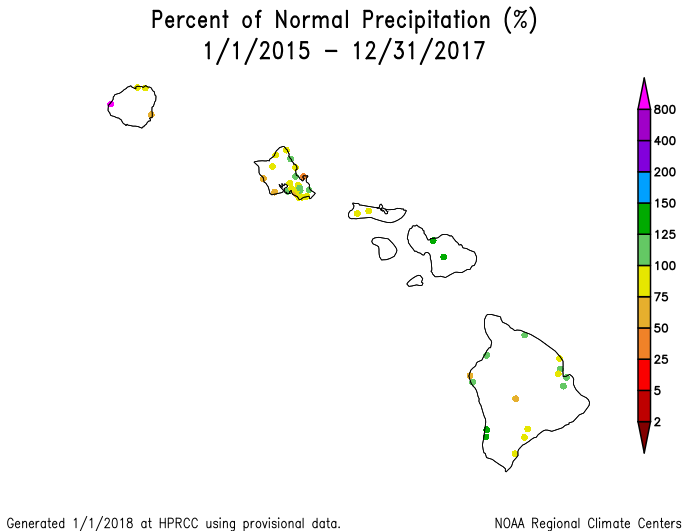
Map of percent of normal precipitation for Hawaii, December 2017.
Hawaii: December 2017 was mostly drier than normal across the Hawaiian Islands. A similar precipitation anomaly pattern existed for the last 2 and 6 months, although there were a few more stations that were wetter than normal. A mixed precipitation anomaly pattern was evident at 3 months and at longer time scales (last 9, 12, 24, and 36 months). Streamflow was mostly near to above normal. Abnormal dryness and drought contracted, but moderate to severe drought still covered about a fifth of the state on the January 2nd, 2018 USDM map.

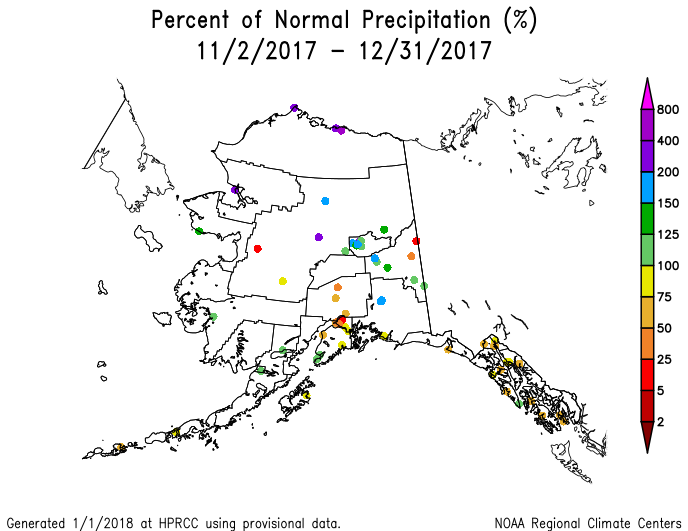
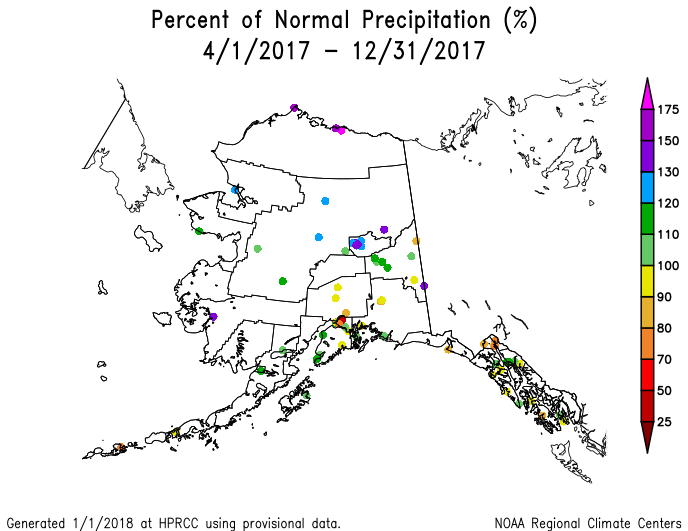
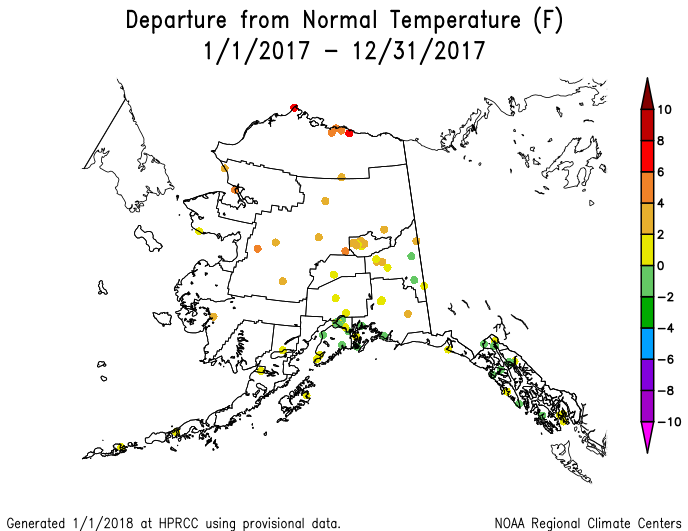
Alaska gridded precipitation rank map, December 2017.
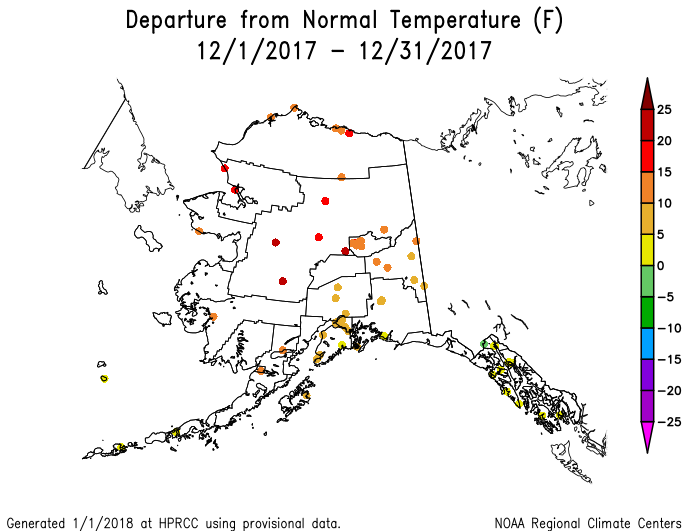
Alaska: December 2017 was drier than normal across interior regions of Alaska but wetter than normal to the north and south (climate division, gridded percentile, gridded percent of normal, and low elevation station maps); the high elevation (SNOTEL) stations had a mixed precipitation anomaly pattern. Dryness was centered more at the stations in the panhandle, south central, and interior southwest regions for the last 2 months. The panhandle was dry, but most of the rest of the state was wetter than normal, at 3 months (climate division, gridded percentile, gridded percent of normal, and low elevation station maps), except the south central coastal region was also drier than normal on the SNOTEL station and basin maps. Wetter-than-normal conditions dominated for the last 6 months (climate division, gridded percent of normal, and low elevation station maps). There was some dryness in the panhandle and south central regions for the last 9 to 12 (climate division, gridded percentile, gridded percent of normal, and low elevation station maps) months. This pattern was also evident at the 24- to 36-month time scales. Temperatures were warmer than normal across the state, with record warmth in the north, during December (low elevation station, gridded percentile, gridded anomaly, divisional maps). Panhandle stations were cooler than normal, but the rest of the state was warmer than normal, for the last 2, 3 (low elevation station, gridded percentile, gridded anomaly, divisional maps), 6 (gridded anomaly, divisional maps), and 12 (low elevation station, gridded percentile, gridded anomaly, divisional maps) months. Snow pack and snow water content were below normal at the stations and in the basins in the panhandle and southern coastal regions, but above normal to the north. Streamflow in the south was mostly above normal. Alaska remained free of drought and abnormal dryness on the January 2nd USDM map.
Precipitation anomaly maps were not available for Puerto Rico this month. December was drier than normal at San Juan. Streamflow was mostly above normal across the island. As seen on the January 2nd, 2018 USDM map, Puerto Rico was free of drought and abnormal dryness.
CONUS State Precipitation Ranks:

|

|
December 2017 was drier than normal across much of the CONUS. On a statewide basis, 33 states ranked in the driest third of the 123-year historical record with 12 states in the top ten driest category. The twelve spanned the country from coast to coast and included California (second driest), Oregon (eighth driest), Nevada (ninth driest), Colorado and New Mexico (both seventh driest), Kansas (fourth driest), Iowa (fifth driest), Illinois (seventh driest), West Virginia (eighth driest), Virginia (fourth driest), and Delaware and Maryland (both fifth driest).

|
|
October-December 2017 was drier than normal across much of the Southwest, Great Plains, Lower to Mid-Mississippi Valley, and parts of the Southeast to Northeast states. Record dryness occurred in parts of the Southwest. On a statewide basis, 20 states ranked in the driest third of the historical record with five in the top ten category — Arizona (fourth driest), Utah (fifth driest), Nevada (ninth driest), and Colorado and North Dakota (both seventh driest).
July-December 2017 was drier than normal across much of the Southwest, northern High Plains, Mid-Mississippi Valley, Mid-Atlantic, and parts of the Lower Mississippi Valley and New England, but the dryness was not as extreme. On a statewide basis, 13 states ranked in the driest third of the historical record with none in the top ten driest category.

|
|
January-December 2017 was drier than normal in the northern High Plains, Southwest, and parts of the Mississippi Valley, Mid-Atlantic, and southern New England regions. Only four states (Arizona, Connecticut, Montana, and North Dakota) ranked in the driest third of the historical record. North Dakota had the eighth driest year on record.
 Primary Hard Red Winter Wheat Belt precipitation, December, 1895-2017.
|
 Primary Hard Red Winter Wheat Belt precipitation, October-December, 1895-2017.
|
December 2017 was drier and near to warmer than normal across the Primary Hard Red Winter Wheat agricultural belt. The month ranked as the sixth driest and 34th warmest December, regionwide, in the 1895-2017 record.
October marks the beginning of the growing season for the Primary Hard Red Winter Wheat belt. October-December 2017 was near to drier than normal and warmer than normal across the agricultural belt, ranking as the 37th driest and 13th warmest October-December, regionwide.
NOAA Regional Climate Centers:
A more detailed drought discussion, provided by the NOAA Regional Climate Centers and others, can be found below.
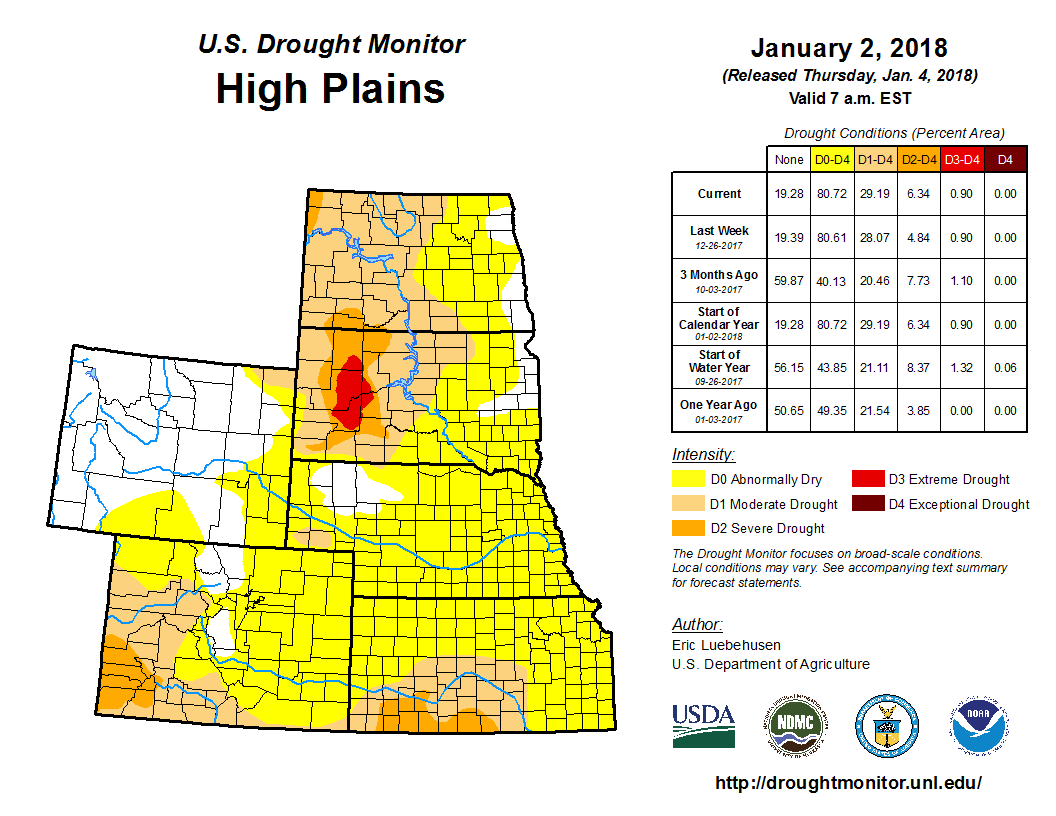
As described by the High Plains Regional Climate Center, in summary, precipitation was scarce throughout much of the High Plains during December, especially in Colorado and Kansas. Numerous locations had a top 10 driest December on record and these conditions were, in large part, a continuation of dryness since around mid-October. These dry conditions have contributed to widespread below-normal snowfall across the region, particularly in the Rockies of Colorado where the snowpack season was off to an abysmal start. A combination of these factors led to the expansion of abnormally dry conditions and drought during December, according to the USDM. While drought impacts tend to be minimal this time of year, dry soils and below-normal precipitation during winter often lead to impacts during the spring. The only state in the region that was spared from dry conditions was Wyoming, where above-normal precipitation continued to boost snowpack. As for temperatures, most of the region had normal to slightly above normal temperatures for December on the whole; however, early to mid-December was extremely warm while late December was extremely cold.
Specifically, dryness continued to prevail for much of the region to begin the winter season. A broad area that includes Colorado, Kansas, and eastern and central portions of the Dakotas and Nebraska received paltry amounts of precipitation during December. The driest area was southern and central Kansas, where precipitation was less than 5 percent of normal. For instance, only a trace of precipitation was recorded in Garden City, which tied several years for its driest December on record. Precipitation was also scarce across most of Colorado, where several locations had a top 10 driest December. On the other hand, wet conditions continued across Wyoming, with much of the state receiving greater than 150 percent of normal precipitation. The High Plains region has been abnormally dry during the past few months, which has resulted in widespread below-normal snowfall.
Dryness in November persisted into December across southern and eastern portions of the High Plains, which resulted in a wide expansion of abnormally dry conditions (D0) on the USDM map. The area depicted in dryness or drought (D0-D4) nearly doubled in December, from 41 percent at the end of November to 81 percent in late December. December precipitation was less than 50 percent of normal in areas where dryness spread. Moderate drought (D1) expanded further into western Colorado. Above-normal temperatures and widespread dryness contributed to a continued lack of snowfall. In Kansas, drought expanded to encompass approximately one-third of the state, and persistent dryness since October in a portion of southern Kansas warranted the introduction of severe drought (D2) on the USDM map. October-December precipitation in this area of the state ranged from only 10-50 percent of normal. Prolonged drought has contributed to some impacts this winter. For instance, livestock producers in North Dakota have reported a shortage of winter feed, so a hay lottery was established to help producers locate the feed that is needed for the winter. Also, drought likely played a role in the development and rapid movement of the Legion Lake Fire in South Dakota. More recently, the combination of abnormal dryness, the lack of snowfall, and above-normal temperatures followed by a cold snap may have caused winter crop damage, which will likely not be realized until spring.
As explained by the Southern Regional Climate Center, December temperatures were slightly above normal for most of the Southern region, while precipitation values varied spatially. Northwestern Oklahoma and northern Texas received 25 percent or less of normal precipitation. Areas of central, eastern, and northern Oklahoma, central and extreme eastern Texas, north, central, and extreme southeastern Louisiana, central and eastern Tennessee, northern Arkansas, and central Mississippi received 25-70 percent of normal precipitation. In contrast, southwest Texas received 300 percent or more of normal precipitation. South, northeast and west Texas, southeast Louisiana, southwest Mississippi, and southwest and central Arkansas received 150-200 percent of normal precipitation.
Drought conditions worsened during the month from severe to extreme drought in north central Arkansas and a small area in northern Texas. Conditions worsened from moderate to severe drought in northern Oklahoma, northern Texas, northern Louisiana, and central Mississippi. Moderate drought conditions expanded throughout central Oklahoma and abnormally dry conditions appeared in southeast Tennessee. In contrast, conditions improved from extreme to severe and moderate drought in central Arkansas. Conditions improved from severe to moderate drought in northeast Texas, southeast Oklahoma, and southern Arkansas. Moderate drought improved to abnormally dry conditions in northern Mississippi and southeast and western Texas. Conditions improved to normal in extreme southern Mississippi and south central Louisiana.
As summarized by the Midwest Regional Climate Center, December temperatures were below normal for much of the northern and eastern halves of the region, and precipitation was well below normal for nearly all of the Midwest. A swath across northern Missouri and central Illinois had less than 25 percent of normal precipitation for the month. Surrounding areas with less than 50 percent of normal extended into every Midwest state except Kentucky. Iowa (5th driest) and Illinois (7th) ranked among the driest Decembers in their records (1895-2017), while Missouri, Indiana, and Ohio ranked in the teens. Above-normal precipitation was observed only in the northern areas of Minnesota, Michigan, and Wisconsin. Annual precipitation was above normal for the region, at 104 percent of normal.
Drought expanded slightly and intensified in the Midwest during December. An area of extreme drought in south central Missouri was the first extreme drought in the region since early October (Iowa) and the first extreme drought in Missouri since 2012. The area affected by drought expanded into more of Missouri, Illinois, and Iowa in December and remained for a small area in north central Minnesota. Areas noted as abnormally dry also expanded and covered nearly all of Missouri, much of Iowa, and most of southern Illinois.
As noted by the Southeast Regional Climate Center, precipitation was near normal to well below normal across much of the Southeast region during December, while temperatures were above average in much of Florida, Georgia, South Carolina, Puerto Rico, and the U.S. Virgin Islands, but near average to below average temperatures across Alabama, North Carolina, and Virginia. The driest locations were found across portions of central and southeastern Florida, northern and western North Carolina, and Virginia, where monthly precipitation totals were 50 to less than 25 percent of normal. At least 22 long-term stations observed December precipitation totals that were ranked within their five lowest values on record. Seventeen of these stations were located in Virginia and the Washington, D.C. area. Several long-term stations tied their second or third highest count of December days with no measurable precipitation. From the 13th through the 31st, Norfolk, VA (1874-2017) observed its longest December streak of 19 consecutive days with no measurable precipitation.
Moderate (D1) drought continued to expand in coverage across the Southeast during December, increasing from 15 percent on November 28th to 28 percent on December 26th. By late December, moderate drought covered at least 15 percent of every state in the region, including central Virginia, central North Carolina, north-central South Carolina, southern Georgia, west-central and southeastern Alabama, and the Florida Panhandle. The greatest statewide extent of moderate drought was observed in Virginia (43 percent), Georgia (40 percent), and North Carolina (29 percent). More than half of the USGS gages in North Carolina and Virginia recorded well-below-normal (i.e., less than the 10th percentile) streamflows at the end of the month. Cold, dry conditions impeded the growth of small grains and caused some injury to fruit crops in parts of North Carolina.
As explained by the Northeast Regional Climate Center, December was cold for the Northeast with below-normal precipitation. The region received 2.31 inches (58.67 mm) of precipitation, 66 percent of normal. All twelve states were drier than normal, with seven states ranking this December among their 20 driest. The USDM released on December 7 showed parts of central and southern Maryland, totaling 1 percent of the Northeast, in a moderate drought and 14 percent of the region as abnormally dry. During the month, moderate drought was introduced in eastern Pennsylvania and abnormal dryness generally expanded in the region. Some areas experienced below-normal streamflow and groundwater levels. The USDM released on December 26 showed 3 percent of the Northeast in a moderate drought and 18 percent of the region as abnormally dry.
As summarized by the Western Regional Climate Center, December brought well below normal precipitation to most of the West (record dry in the Southwest) with the exceptions being primarily Montana and Wyoming where some areas saw record wet conditions. Temperatures were above normal for much of the Southwest and Four Corners states, and below normal in parts of the Pacific Northwest. A persistent ridge of high pressure in the Pacific Northwest that extended into the Gulf of Alaska led to anomalous warmth across most of the region. Persistent high pressure caused strong temperature inversions throughout the Great Basin leading to cold air pooling and poor air quality in valley locations. Inversions actually lead to below normal temperatures in some locations.
Southern California eastward through the Four Corners states was extremely dry this month. Santa Barbara, California recorded no precipitation (normal is 3.04 in/77.2 mm) for only the 6th time since records began in 1893 and Los Angeles (normal is 2.33 in/59.2 mm) observed 0.01 in (0.3 mm), 13th driest, with records dating back to 1877. Climatologically, December is one of the wettest months for southern California and the lack of precipitation led to continued and increased wildfire danger. The dry December led to expansion or introduction of abnormally dry, moderate drought, or severe drought categories in California, Nevada, and all of the Four Corners states. A large area in southern Utah is now in severe drought as of the end of December. In Arizona, 100% of the state is now is moderate or severe drought. In contrast to the dry Southwest, Montana and Wyoming saw well above normal precipitation for the month. Small pockets of drought improvements were made in Montana due to the wet conditions.
Snowpack in Oregon, California, Nevada, and all of the Four Corners states was well below normal at the end of the month due to persistent warm and dry conditions. In parts of Oregon and Washington water year precipitation (October through December) remains near or above normal while snowpack is below normal indicating the presence of warm snow drought conditions.
Many locations in Alaska observed record warm December temperatures. Little Port Walter in southeast Alaska observed its 6th wettest December (40.8 in/1036.3 mm) with records beginning in 1936, while Anchorage was quite dry (0.44 in/11.2 mm) seeing its 12th driest December back to 1953. In Hawaii, Kahului observed the 5th wettest (7.92 in/201.2 mm) December dating back to 1905. Most of that precipitation came from a single storm event that dropped 7.21 in (183.1 mm) December 20-21 with 6.40 in (162.6 mm) falling on the 20th.
Pacific Islands: The NOAA National Weather Service (NWS) offices, the Pacific ENSO Applications Climate Center (PEAC), and partners provided reports on conditions across the Pacific Islands.
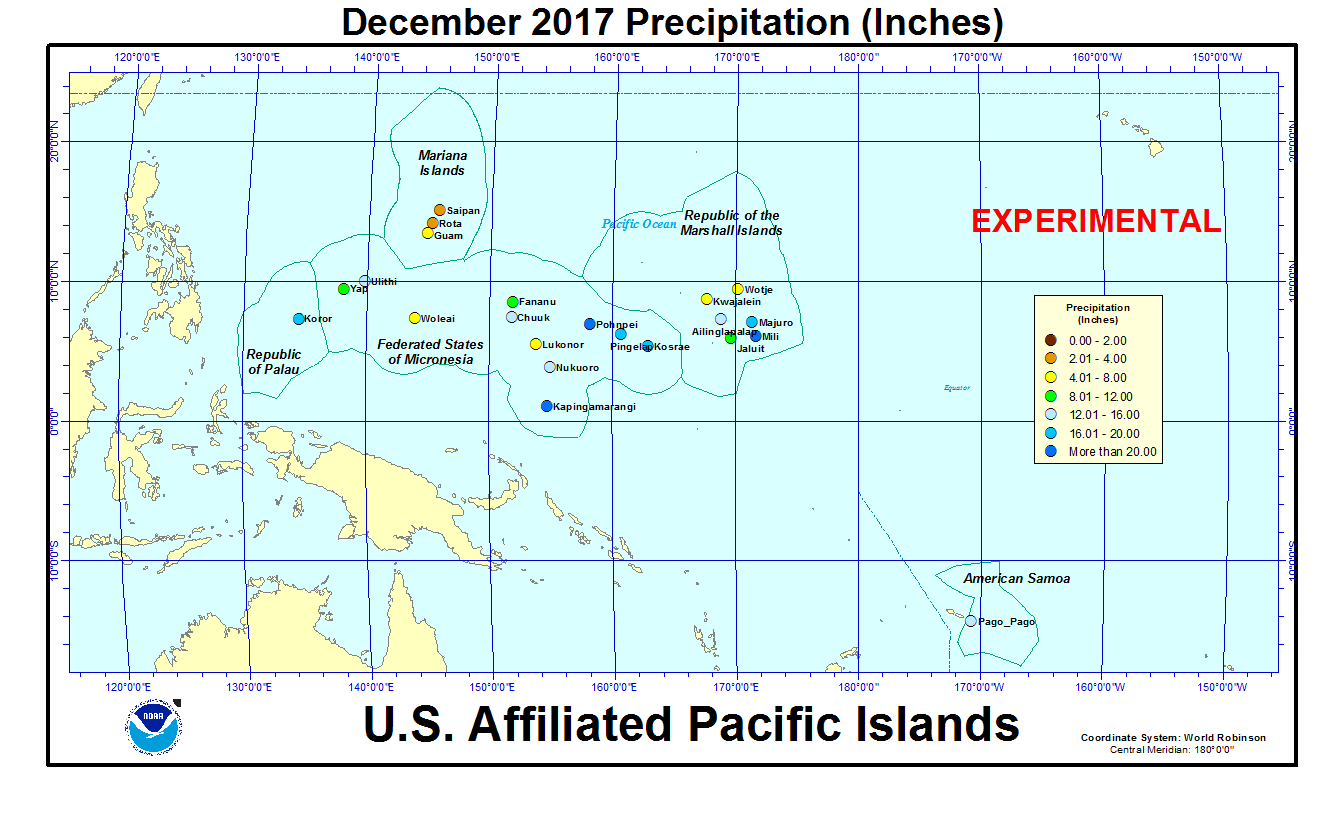
In the U.S. Affiliated Pacific Islands (USAPI) (maps — Federated States of Micronesia [FSM], Northern Mariana Islands, Marshall Islands [RMI], Republic of Palau, American Samoa, basinwide), December 2017 was drier than normal at Saipan, Guam, Kwajalein, Lukonor, and Pago Pago, and wetter than normal at Koror, Yap, Chuuk, Kapingamarangi, Pohnpei, Kosrae, and Majuro.
Rainfall amounts were below the minimum thresholds (4 or 8 inches) required to meet most monthly water needs at Lukonor and Woleai (in the FSM); Kwajalein and Wotje (in the RMI); and Rota and Saipan (in the Marianas). December rainfall was above the monthly minimum thresholds at the rest of the regular reporting stations in Micronesia. The 4- and 8-inch thresholds are important because, if monthly precipitation falls below the threshold, then water shortages or drought become a concern.
Significant dryness developed in the northern Marshall Islands in December 2016, with 6 of the last 13 months each having less than 2 inches at Utirik, 9 had less than 8 inches, and 3 months were missing; that equates to just one month having more than 8 inches (November 2017 had 9.29 inches). At Wotje, 5 of the last 13 months had less than 2 inches each, and 10 had less than 8 inches, with only 3 (June, September, and November 2017) having more than 8 inches. Eight inches is the monthly minimum in the RMI. Jaluit recorded 9.30 inches of rain for December 2017, but still had the second driest March-December through July-December out of 34 years of data. Even with 12.24 inches of rain for December 2017, Ailinglapalap still had the third driest May-December out of 33 years of data.
Dryness has developed in the last 2 months in the Marianas Islands. Rota and Saipan have each had less than 4 inches (the monthly minimum in the Marianas) of rain for November and December 2017; March-May were also each dry at Saipan. Each of the time periods from February-December through September-December ranked as the second driest (out of 29 or 30 years of data) for Saipan.
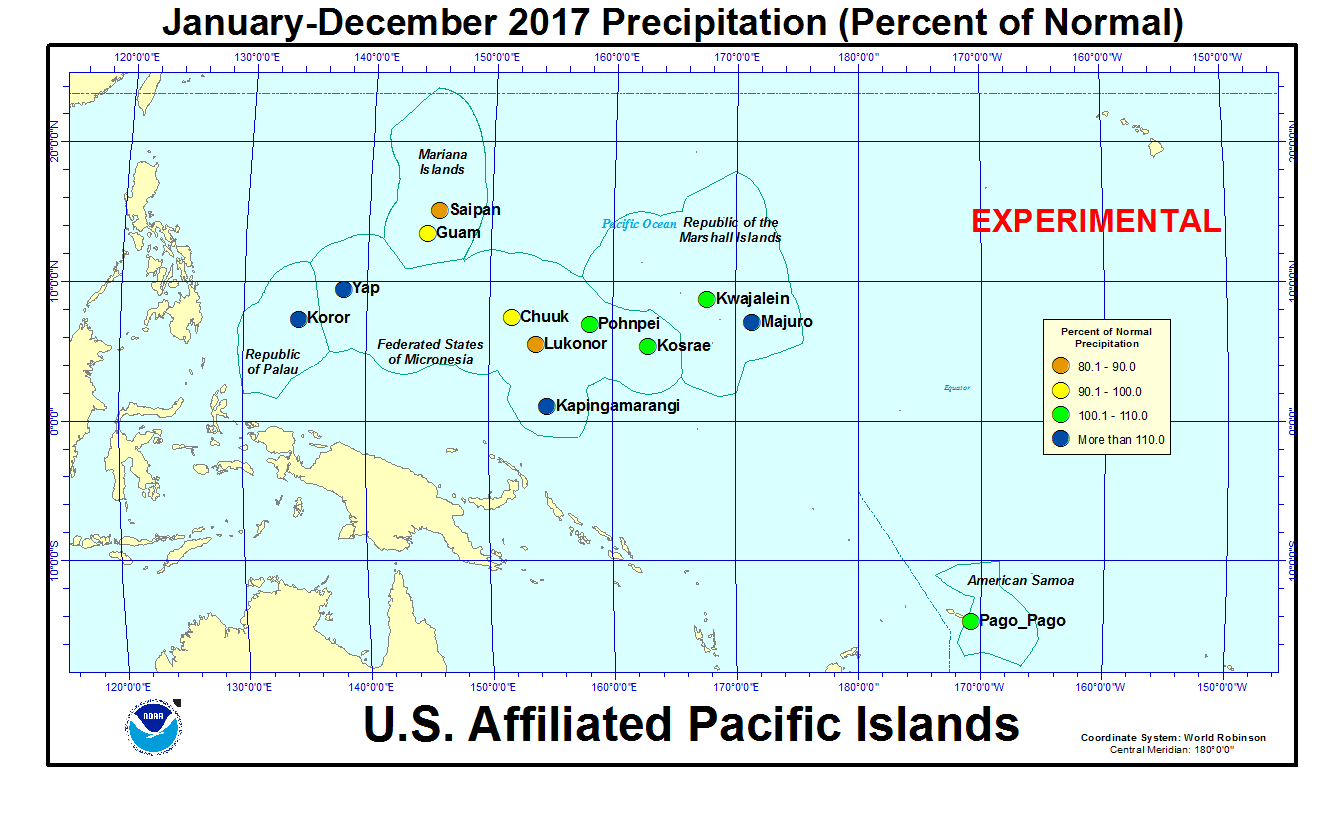
As measured by percent of normal precipitation, Saipan has been drier than normal in the short term (December and the last 3 months [October-December]) as well as the long term (last 12 months [January-December 2017]). Kwajalein was drier than normal in the short term and near to slightly wetter than normal in the long term. Lukonor was near normal at 3 months but drier than normal for December and in the long term. Guam was drier than normal for December but near normal for the other two time periods. Pago Pago was drier than normal for December but wetter than normal for the other two time periods. Pohnpei was near normal for the last 3 months but wetter than normal for December and in the long term. Chuuk was wetter than normal in the short term and near normal in the long term. Kapingamarangi, Koror, Kosrae, Majuro, and Yap were wetter than normal for all 3 time periods.
| Station Name | Jan 2017 | Feb 2017 | Mar 2017 | Apr 2017 | May 2017 | Jun 2017 | Jul 2017 | Aug 2017 | Sep 2017 | Oct 2017 | Nov 2017 | Dec 2017 | Jan- Dec |
|---|---|---|---|---|---|---|---|---|---|---|---|---|---|
| Chuuk | 113% | 114% | 189% | 60% | 83% | 73% | 99% | 91% | 110% | 127% | 105% | 120% | 100% |
| Guam NAS | 155% | 167% | 256% | 340% | 56% | 136% | 97% | 66% | 118% | 161% | 57% | 88% | 98% |
| Kapingamarangi | 159% | 207% | 126% | 159% | 114% | 81% | 102% | 41% | 92% | 72% | 64% | 420% | 120% |
| Koror | 131% | 175% | 245% | 76% | 107% | 89% | 130% | 104% | 161% | 118% | 84% | 160% | 117% |
| Kosrae | 103% | 213% | 150% | 112% | 115% | 80% | 104% | 93% | 155% | 143% | 168% | 123% | 108% |
| Kwajalein | 285% | 212% | 46% | 65% | 77% | 156% | 70% | 64% | 205% | 88% | 83% | 71% | 104% |
| Lukonor | 138% | 66% | 160% | 85% | 80% | 60% | 103% | 63% | 84% | 116% | 136% | 70% | 83% |
| Majuro | 228% | 138% | 199% | 110% | 49% | 118% | 112% | 111% | 187% | 143% | 76% | 172% | 130% |
| Pago Pago | 72% | 153% | 52% | 87% | 240% | 93% | 84% | 145% | 96% | 217% | 127% | 94% | 106% |
| Pohnpei | 182% | 71% | 115% | 96% | 92% | 141% | 113% | 55% | 122% | 81% | 95% | 130% | 105% |
| Saipan | 182% | 199% | 108% | 115% | 66% | 128% | 72% | 65% | 84% | 66% | 62% | 60% | 82% |
| Yap | 198% | 370% | 205% | 110% | 69% | 68% | 121% | 55% | 93% | 156% | 106% | 132% | 116% |
| Station Name | Jan 2017 | Feb 2017 | Mar 2017 | Apr 2017 | May 2017 | Jun 2017 | Jul 2017 | Aug 2017 | Sep 2017 | Oct 2017 | Nov 2017 | Dec 2017 | Jan- Dec |
|---|---|---|---|---|---|---|---|---|---|---|---|---|---|
| Chuuk | 11.37" | 8.27" | 15.74" | 7.51" | 9.40" | 8.50" | 11.86" | 11.65" | 12.92" | 14.64" | 11.15" | 13.52" | 136.53" |
| Guam NAS | 6.22" | 5.06" | 5.30" | 8.60" | 1.89" | 8.40" | 9.86" | 9.73" | 14.92" | 18.47" | 4.23" | 4.49" | 97.17" |
| Kapingamarangi | 14.54" | 19.18" | 14.44" | 21.70" | 13.75" | 11.15" | 14.47" | 3.35" | 9.13" | 5.93" | 5.95" | 41.30" | 174.89" |
| Koror | 13.30" | 14.99" | 18.26" | 5.54" | 12.61" | 15.53" | 24.14" | 13.98" | 18.90" | 14.03" | 9.55" | 17.89" | 178.72" |
| Kosrae | 17.21" | 27.51" | 24.16" | 19.62" | 20.34" | 11.73" | 15.57" | 13.23" | 22.02" | 15.65" | 23.21" | 19.85" | 230.1" |
| Kwajalein | 9.00" | 5.60" | 1.07" | 3.44" | 5.20" | 10.80" | 6.91" | 6.28" | 22.06" | 9.83" | 9.40" | 4.72" | 94.31" |
| Lukonor | 11.58" | 5.90" | 14.83" | 9.61" | 9.41" | 6.97" | 16.47" | 8.88" | 8.51" | 13.10" | 12.38" | 7.90" | 125.54" |
| Majuro | 17.65" | 9.50" | 13.07" | 10.36" | 4.93" | 13.03" | 12.52" | 13.00" | 20.93" | 18.21" | 10.27" | 19.59" | 163.06" |
| Pago Pago | 9.57" | 18.32" | 5.60" | 8.14" | 23.23" | 4.94" | 4.66" | 7.78" | 6.26" | 20.11" | 12.89" | 12.06" | 133.56" |
| Pohnpei | 24.00" | 6.76" | 15.16" | 17.68" | 18.45" | 20.85" | 17.45" | 7.82" | 15.27" | 12.31" | 14.13" | 20.86" | 190.74" |
| Saipan | 4.61" | 5.15" | 2.04" | 3.02" | 1.58" | 4.63" | 6.45" | 8.59" | 8.47" | 7.01" | 3.48" | 2.31" | 57.34" |
| Yap | 12.67" | 19.19" | 9.35" | 6.19" | 5.40" | 8.16" | 18.27" | 8.20" | 12.59" | 18.99" | 9.40" | 11.27" | 139.68" |
| Station Name | Jan 2017 | Feb 2017 | Mar 2017 | Apr 2017 | May 2017 | Jun 2017 | Jul 2017 | Aug 2017 | Sep 2017 | Oct 2017 | Nov 2017 | Dec 2017 | Jan- Dec |
|---|---|---|---|---|---|---|---|---|---|---|---|---|---|
| Chuuk | 10.10" | 7.25" | 8.32" | 12.47" | 11.30" | 11.66" | 11.98" | 12.86" | 11.71" | 11.51" | 10.61" | 11.25" | 136.77" |
| Guam NAS | 4.01" | 3.03" | 2.07" | 2.53" | 3.40" | 6.18" | 10.14" | 14.74" | 12.66" | 11.44" | 7.38" | 5.11" | 99.09" |
| Kapingamarangi | 9.15" | 9.27" | 11.43" | 13.64" | 12.08" | 13.78" | 14.15" | 8.13" | 9.93" | 8.19" | 9.27" | 9.84" | 145.85" |
| Koror | 10.18" | 8.56" | 7.44" | 7.32" | 11.83" | 17.48" | 18.53" | 13.50" | 11.77" | 11.84" | 11.39" | 11.16" | 152.90" |
| Kosrae | 16.67" | 12.93" | 16.06" | 17.51" | 17.75" | 14.64" | 14.91" | 14.22" | 14.22" | 10.94" | 13.83" | 16.11" | 213.87" |
| Kwajalein | 3.16" | 2.64" | 2.35" | 5.26" | 6.72" | 6.93" | 9.87" | 9.74" | 10.74" | 11.18" | 11.28" | 6.66" | 90.41" |
| Lukonor | 8.41" | 8.93" | 9.26" | 11.31" | 11.69" | 11.65" | 15.93" | 14.04" | 10.15" | 11.32" | 9.08" | 11.27" | 151.36" |
| Majuro | 7.74" | 6.88" | 6.58" | 9.42" | 10.11" | 11.01" | 11.17" | 11.69" | 11.17" | 12.73" | 13.44" | 11.39" | 125.25" |
| Pago Pago | 13.34" | 12.00" | 10.68" | 9.39" | 9.66" | 5.33" | 5.55" | 5.38" | 6.53" | 9.26" | 10.14" | 12.84" | 125.57" |
| Pohnpei | 13.18" | 9.55" | 13.17" | 18.41" | 19.96" | 14.81" | 15.43" | 14.26" | 12.55" | 15.27" | 14.83" | 16.08" | 182.36" |
| Saipan | 2.53" | 2.59" | 1.89" | 2.63" | 2.38" | 3.62" | 8.91" | 13.13" | 10.09" | 10.62" | 5.61" | 3.85" | 70.25" |
| Yap | 6.39" | 5.19" | 4.56" | 5.63" | 7.85" | 12.04" | 15.08" | 14.82" | 13.50" | 12.18" | 8.83" | 8.51" | 120.31" |
The following analysis of historical data for the USAPI stations in the Global Historical Climatology Network-Daily (GHCN-D) dataset, augmented with fill-in data from the 1981-2010 Normals, helps put the current data into historical perspective by computing ranks based on the period of record. The table below lists the precipitation ranks for December 2017, July-December 2017 (last 6 months), and January-December 2017 (the last 12 months). Some stations have a long period of record and their dataset is fairly complete, while other stations have a shorter period of record and the dataset has some missing data.
Rank of 1 = driest.
| Station | Dec 2017 Rank |
Dec No. of Years |
Jul- Dec 2017 Rank |
Jul- Dec No. of Years |
Jan- Dec 2017 Rank |
Jan- Dec No. of Years |
Period of Record |
| Jaluit | 19 | 34 | 2 | 34 | 6 | 34 | 1981-2017 |
| Koror | 60 | 67 | 61 | 67 | 63 | 66 | 1951-2017 |
| Woleai | 18 | 37 | 7 | 25 | 9 | 22 | 1968-2017 |
| Yap | 46 | 67 | 47 | 67 | 52 | 66 | 1951-2017 |
| Majuro | 62 | 64 | 61 | 64 | 61 | 63 | 1954-2017 |
| Mili | 31 | 34 | MSG | 33 | MSG | 31 | 1981-2017 |
| Ulithi | 33 | 36 | 27 | 35 | MSG | 32 | 1981-2017 |
| Ailinglapalap | 24 | 34 | 7 | 33 | 12 | 33 | 1981-2017 |
| Pingelap | 27 | 35 | 22 | 34 | 12 | 33 | 1981-2017 |
| Kosrae | 29 | 50 | 31 | 37 | 25 | 31 | 1954-2017 |
| Lukonor | 5 | 34 | 6 | 21 | 8 | 21 | 1981-2017 |
| Saipan | 9 | 30 | 2 | 30 | 3 | 29 | 1981-2017 |
| Pohnpei | 57 | 67 | 23 | 67 | 36 | 66 | 1951-2017 |
| Kwajalein | 19 | 66 | 26 | 66 | 30 | 65 | 1952-2017 |
| Kapingamarangi | 27 | 27 | 14 | 17 | 14 | 15 | 1962-2017 |
| Chuuk | 44 | 67 | 34 | 67 | 29 | 66 | 1951-2017 |
| Guam | 24 | 61 | 14 | 61 | 30 | 60 | 1957-2017 |
| Nukuoro | 22 | 35 | 34 | 34 | 33 | 33 | 1981-2017 |
| Pago Pago | 19 | 52 | 36 | 52 | 38 | 51 | 1966-2017 |
| Wotje | 21 | 33 | 16 | 33 | 23 | 33 | 1981-2017 |
| Utirik | MSG | 17 | MSG | 6 | MSG | 3 | 1985-2017 |


[top]
State/Regional/National Moisture Status
A detailed review of drought and moisture conditions is available for all contiguous U.S. states, the nine standard regions, and the nation (contiguous U.S.):
| northeast u. s. | east north central u. s. | central u. s. |
| southeast u. s. | west north central u. s. | south u. s. |
| southwest u. s. | northwest u. s. | west u. s. |
| Contiguous United States |
[top]
Contacts & Questions