Note: This Synoptic Discussion describes recent weather events and climate anomalies in relation to the phenomena that cause the weather. These phenomena include the jet stream, fronts and low pressure systems that bring precipitation, high pressure systems that bring dry weather, and the mechanisms which control these features — such as El Niño, La Niña, and other oceanic and atmospheric drivers (PNA, NAO, AO, and others). The report may contain more technical language than other components of the State of the Climate series.
Summary
The Earth's ocean-atmosphere system continued in a La Niña state during December 2017. The upper-level circulation pattern experienced several shifts over the contiguous United States (CONUS) during the month, changing back and forth between a westerly zonal flow and ridge/trough pattern. This caused extremes in temperatures, with much warmer-than-normal temperatures during some weeks and colder-than-normal temperatures other weeks, with the month ending on a very cold note. This variability resulted in a confused-looking monthly temperature anomaly pattern which masked the weekly extremes. Warmer-than-normal temperatures slightly dominated at the monthly scale, especially from the Southwest to northern Plains. Both the westerly pattern, and the northwesterly flow over the central CONUS associated with the ridge/trough pattern, blocked moist air masses, so drier-than-normal conditions dominated the month; they also inhibited the development of severe weather. The lack of precipitation resulted in a significant expansion of drought and abnormal dryness, especially from the Southwest to Mid-Mississippi Valley, and from the Southeast to Northeast. The upper-level circulation, temperature, and precipitation anomaly patterns suggested that the atmospheric drivers originating in the equatorial Pacific (i.e., La Niña and MJO), North Pacific (PNA), Arctic (AO), and Hudson Bay (TNH) had a controlling influence on the month's weather, some throughout the entire month (the La Niña "base state") and others during various weeks (MJO, PNA, AO, TNH). See below for details.
Synoptic Discussion
 Animation of daily upper-level circulation for the month.
|
 Animation of daily surface fronts and pressure systems for the month.
|
In the Northern Hemisphere, December is the first month of climatological winter which is the time of year when solar heating is at its minimum due to the low sun angle, and an expanded circumpolar vortex results in the furthest southern extent of the jet stream. Polar air masses dominate the weather over the contiguous U.S. (CONUS), and the warm, dry subtropical high pressure belts have their least influence.
 500-mb mean circulation for the CONUS for December 1-5, 2017, showing a zonal flow.
|
 500-mb mean circulation for the CONUS for December 6-12, 2017, showing a long-wave ridge in the West and trough in the East.
|
 500-mb mean circulation for the CONUS for December 13-22, 2017, showing mostly a zonal flow with some elongation.
|
 500-mb mean circulation for the CONUS for December 23-31, 2017, showing the dominance of a long-wave trough in the East with a long-wave ridge along the West Coast.
|
The upper-level circulation was very active this month with several short-wave troughs migrating across the CONUS in the jet stream flow. The overall general (or "long-wave") circulation pattern, through which the short-wave troughs migrated, underwent several shifts during the month. A zonal circulation pattern held sway during the first week of December. A zonal circulation is generally a west-to-east flow that keeps cold air masses bottled up to the north and warmer air masses concentrated to the south. It reduces north-south movement of air masses and inhibits the atmosphere's efforts to transfer heat from the tropics towards the poles to balance out the distribution of heat across the Earth. The circulation pattern shifted to a meridional state the following week. A meridional circulation consists of large undulations of the jet stream to the north and south, frequently resulting in stable long-wave troughs and ridges. Troughs transport colder air masses from the poles southward, and ridges transfer heat from the low latitudes to higher latitudes, thus balancing out the Earth's surface heat in the long run. A generally zonal flow followed during roughly the third week, with some undulations due to closed lows frequently passing over the Southwest. The month ended with the Hudson Bay Low expanding southward into the CONUS, intensifying a long-wave trough which dominated the central and eastern parts of the country. Each of these patterns was characterized by specific weather phenomena, temperature anomalies, precipitation anomalies, and impacts.
 500-mb circulation anomalies* for the CONUS for December 1-5, 2017.
|
 Temperature anomalies (departure from normal) for the CONUS for December 1-5, 2017.
|
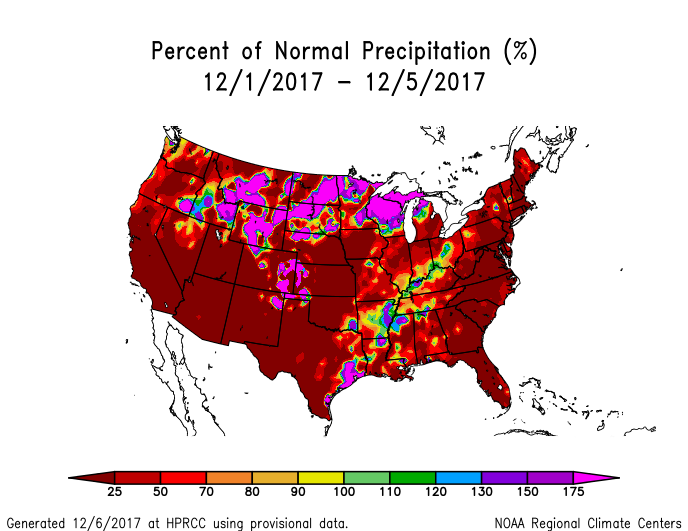 Precipitation anomalies (percent of normal) for the CONUS for December 1-5, 2017.
|
- * A westerly flow shows up on the 500-mb anomaly map as below-normal heights in the West and above-normal heights in the East because the climatological ("normal") pattern is a ridge in the West and trough in the East. A westerly flow is manifested by a weakened western ridge and weakened eastern trough, which is what this anomaly pattern reflects.
A generally westerly flow in the jet stream held sway during the first week, keeping colder air masses bottled up north of the Canadian border, resulting in a warmer-than-normal week for much of the CONUS. Pacific weather systems mostly kept to a northerly track, bringing above-normal precipitation to the central and northern Rockies, northern Plains, and western Great Lakes, and laying down a mountain snowpack across the higher elevations of the Pacific Northwest and northern Rockies. A front near the end of this period tapped Gulf of Mexico moisture to drop above-normal precipitation across parts of coastal Texas and the Lower Mississippi Valley. The rest of the CONUS was moisture-starved and drier than normal.
 500-mb circulation anomalies for the CONUS for December 6-12, 2017.
|
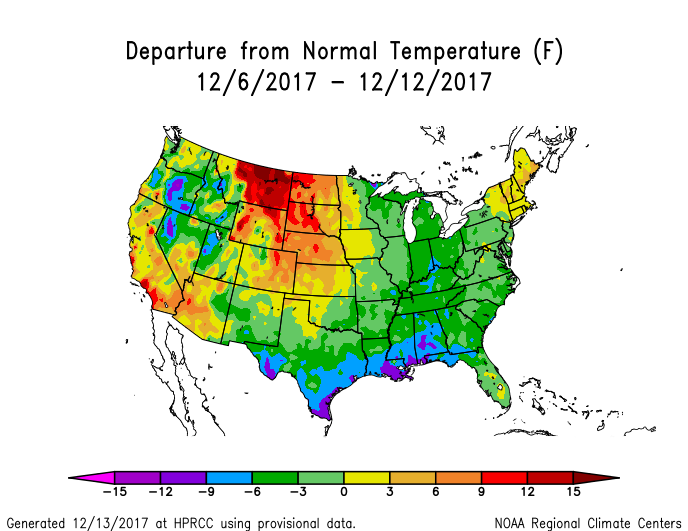 Temperature anomalies (departure from normal) for the CONUS for December 6-12, 2017.
|
 Precipitation anomalies (percent of normal) for the CONUS for December 6-12, 2017.
|
During the following week, a western ridge/eastern trough pattern dominated the upper-level circulation. This pattern deflected storm systems away from the West and enabled colder Canadian air masses to plunge south into the eastern CONUS. The western ridge, and associated chinook wind patterns along the east slopes of the Rockies, brought above-normal temperatures to the northern and central Plains. Even though a ridge dominated the circulation pattern over the West, the mountain snowpack likely contributed to below-normal temperatures in the interior West, as did cold pooling from strong temperature inversions. With no Pacific moisture or storms, the West was dry, and a northwesterly flow in the upper levels of the atmosphere kept moisture out of the central CONUS. Weather systems moving along cold fronts in the Deep South tapped Gulf of Mexico moisture to bring above-normal precipitation to southern Texas, across the Gulf coast, to the southern Atlantic Coast states. The air was below freezing with these air masses, so a swath of snow was deposited across southern Texas and the Southeast; this far south, the snowpack melted after just a few days.
 500-mb circulation anomalies for the CONUS for December 13-22, 2017.
|
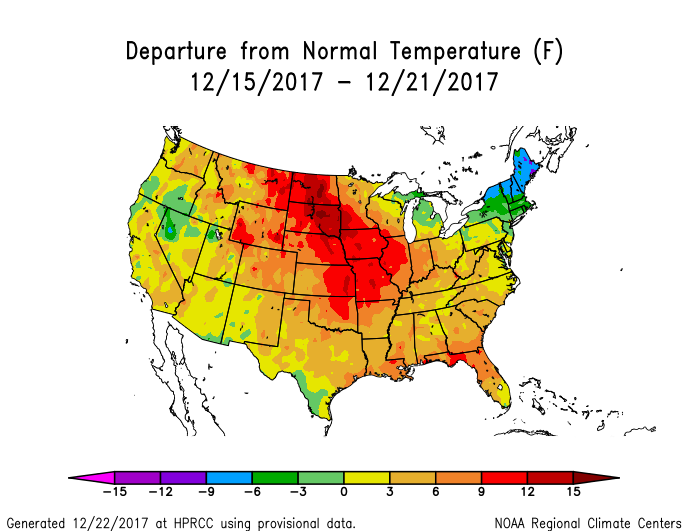 Temperature anomalies (departure from normal) for the CONUS for December 15-21, 2017.
|
 Precipitation anomalies (percent of normal) for the CONUS for December 15-21, 2017.
|
The upper-level circulation pattern flattened out again roughly during December 13-22, although a ridge tried to hold on over the West. Pacific fronts and weather systems penetrated the western ridge, flattening it, with some of them moving across the southern states, while others tracked across the north. The western ridge had enough strength to keep much of the West drier than normal. The Pacific systems dried out as they crossed the Rockies, and the westerly flow blocked Gulf of Mexico moisture, so the central Plains was drier than normal during this period. But the Pacific systems that tracked across the north brought above-normal precipitation to the northern parts of the Pacific Northwest and northern Plains as well as the central Rockies. The southern weather systems brought Gulf of Mexico moisture up against cold fronts lying in the South, resulting in above-normal precipitation from the southern Plains to southern Appalachians. A low pressure system and cold front on the 19th-20th generated tornadoes across the Lower Mississippi Valley to Southeast. While some precipitation did fall across the Midwest to Northeast, the weather systems largely tracked north or south of this region so this period was mostly drier than normal here. The westerly flow kept the really cold air bottled up in Canada, so most of the CONUS was warmer than normal; the warm temperature departures were especially significant across the northern Plains.
 500-mb circulation anomalies for the CONUS for December 23-31, 2017.
|
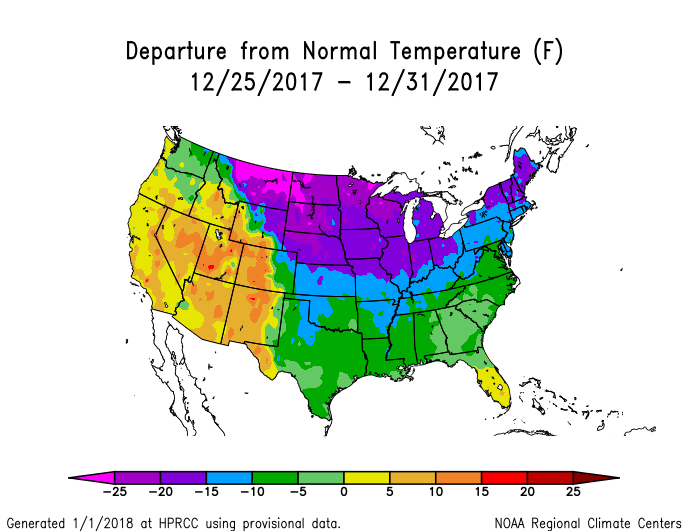 Temperature anomalies (departure from normal) for the CONUS for December 25-31, 2017.
|
 Precipitation anomalies (percent of normal) for the CONUS for December 25-31, 2017.
|
By December 23, a huge omega block-type ridge had developed in the upper-level circulation along the western coast of North America. This helped displace, or intensify, the Hudson Bay Low, which set the stage for the return of a western ridge/eastern trough pattern over the CONUS. The associated due-northerly flow in the upper atmosphere funneled very cold Arctic air masses across Canada and into the heart of the CONUS. The pattern became entrenched, sending wave after wave of brutally cold air across the central and eastern CONUS for the rest of December and well into January. The western ridge kept the Southwest warmer than normal but also dry. Weather systems moving in this convoluted flow pattern brought above-normal precipitation to the northern parts of the Pacific Northwest and into the northern Plains. Precipitation fell across the Great Lakes to Northeast, and along the Gulf Coast states, but it was still generally below normal for the period. The central Plains to Mid-Atlantic states were caught in between these storm tracks and received little to no precipitation. With below-freezing air, the northern weather systems laid down a snowpack from the northern and central Rockies, across the Plains and Ohio Valley, to the Northeast, and the relentless blasts of arctic air behind each new cold front kept most of the snowpack from melting.
 500-mb mean circulation for the CONUS for December 2017.
|
 500-mb circulation anomalies for the CONUS for December 2017.
|
 Temperature anomalies (departure from normal) for the CONUS for December 2017.
|
 Precipitation anomalies (percent of normal) for the CONUS for December 2017.
|
When conditions are averaged across the entire month, the circulation anomalies associated with the ridge/trough weeks tended to dominate the monthly pattern, while the monthly temperature anomaly pattern reflected a chaotic merging of the anomaly patterns of the various weeks. The precipitation anomaly pattern for the month represented an additive result of the anomaly patterns for the various weeks. The circulation during this month was also reflected in snow, drought, and regional records.
- Monthly temperatures were unusually warm across the Southwest, where four states had the tenth warmest, or warmer, December in the 1895-2017 record. The cold snaps in the central and eastern parts of the country were counterbalanced by warm periods, so that the statewide monthly temperatures were near average, except for some Great Lakes and Northeast states which were in the cool third of the historical record.
- When daily temperature records are examined, the extreme warmth was a little more extreme, frequent, and/or widespread than the extreme cold. When integrated across the month, there were 4,110 record warm daily high (2,359) and low (1,751) temperature records. This was about 1.4 times the 2,903 record cold daily high (2,033) and low (870) temperature records.
- As noted earlier, December marks the beginning of the Northern Hemisphere climatological winter, the coldest season when heating demand peaks in the United States. Even though the last week of December 2017 was extremely cold in the high population centers of the Midwest and East, with high heating demand during that period, the temperatures were warmer than normal at other times during the month, reducing heating demand during those times. The aggregate effect was a REDTI (Residential Energy Demand Temperature Index) value for December 2017 which ranked only 38th lowest in the 123-year historical record for December.
- With only Arkansas and Montana wetter than average this month, most of the CONUS was drier than normal. Thirty-three states ranked in the driest third of the historical record for December, including twelve states in the top ten driest category. The twelve spanned the country from coast to coast and included California (second driest), Oregon (eighth driest), Nevada (ninth driest), Colorado and New Mexico (both seventh driest), Kansas (fourth driest), Iowa (fifth driest), Illinois (seventh driest), West Virginia (eighth driest), Virginia (fourth driest), and Delaware and Maryland (both fifth driest). More than a fourth (30.1 percent) of the country was very dry (had December precipitation in the driest tenth of the historical record). When averaged across the CONUS, December 2017 ranked as the ninth driest December in the 1895-2017 record.
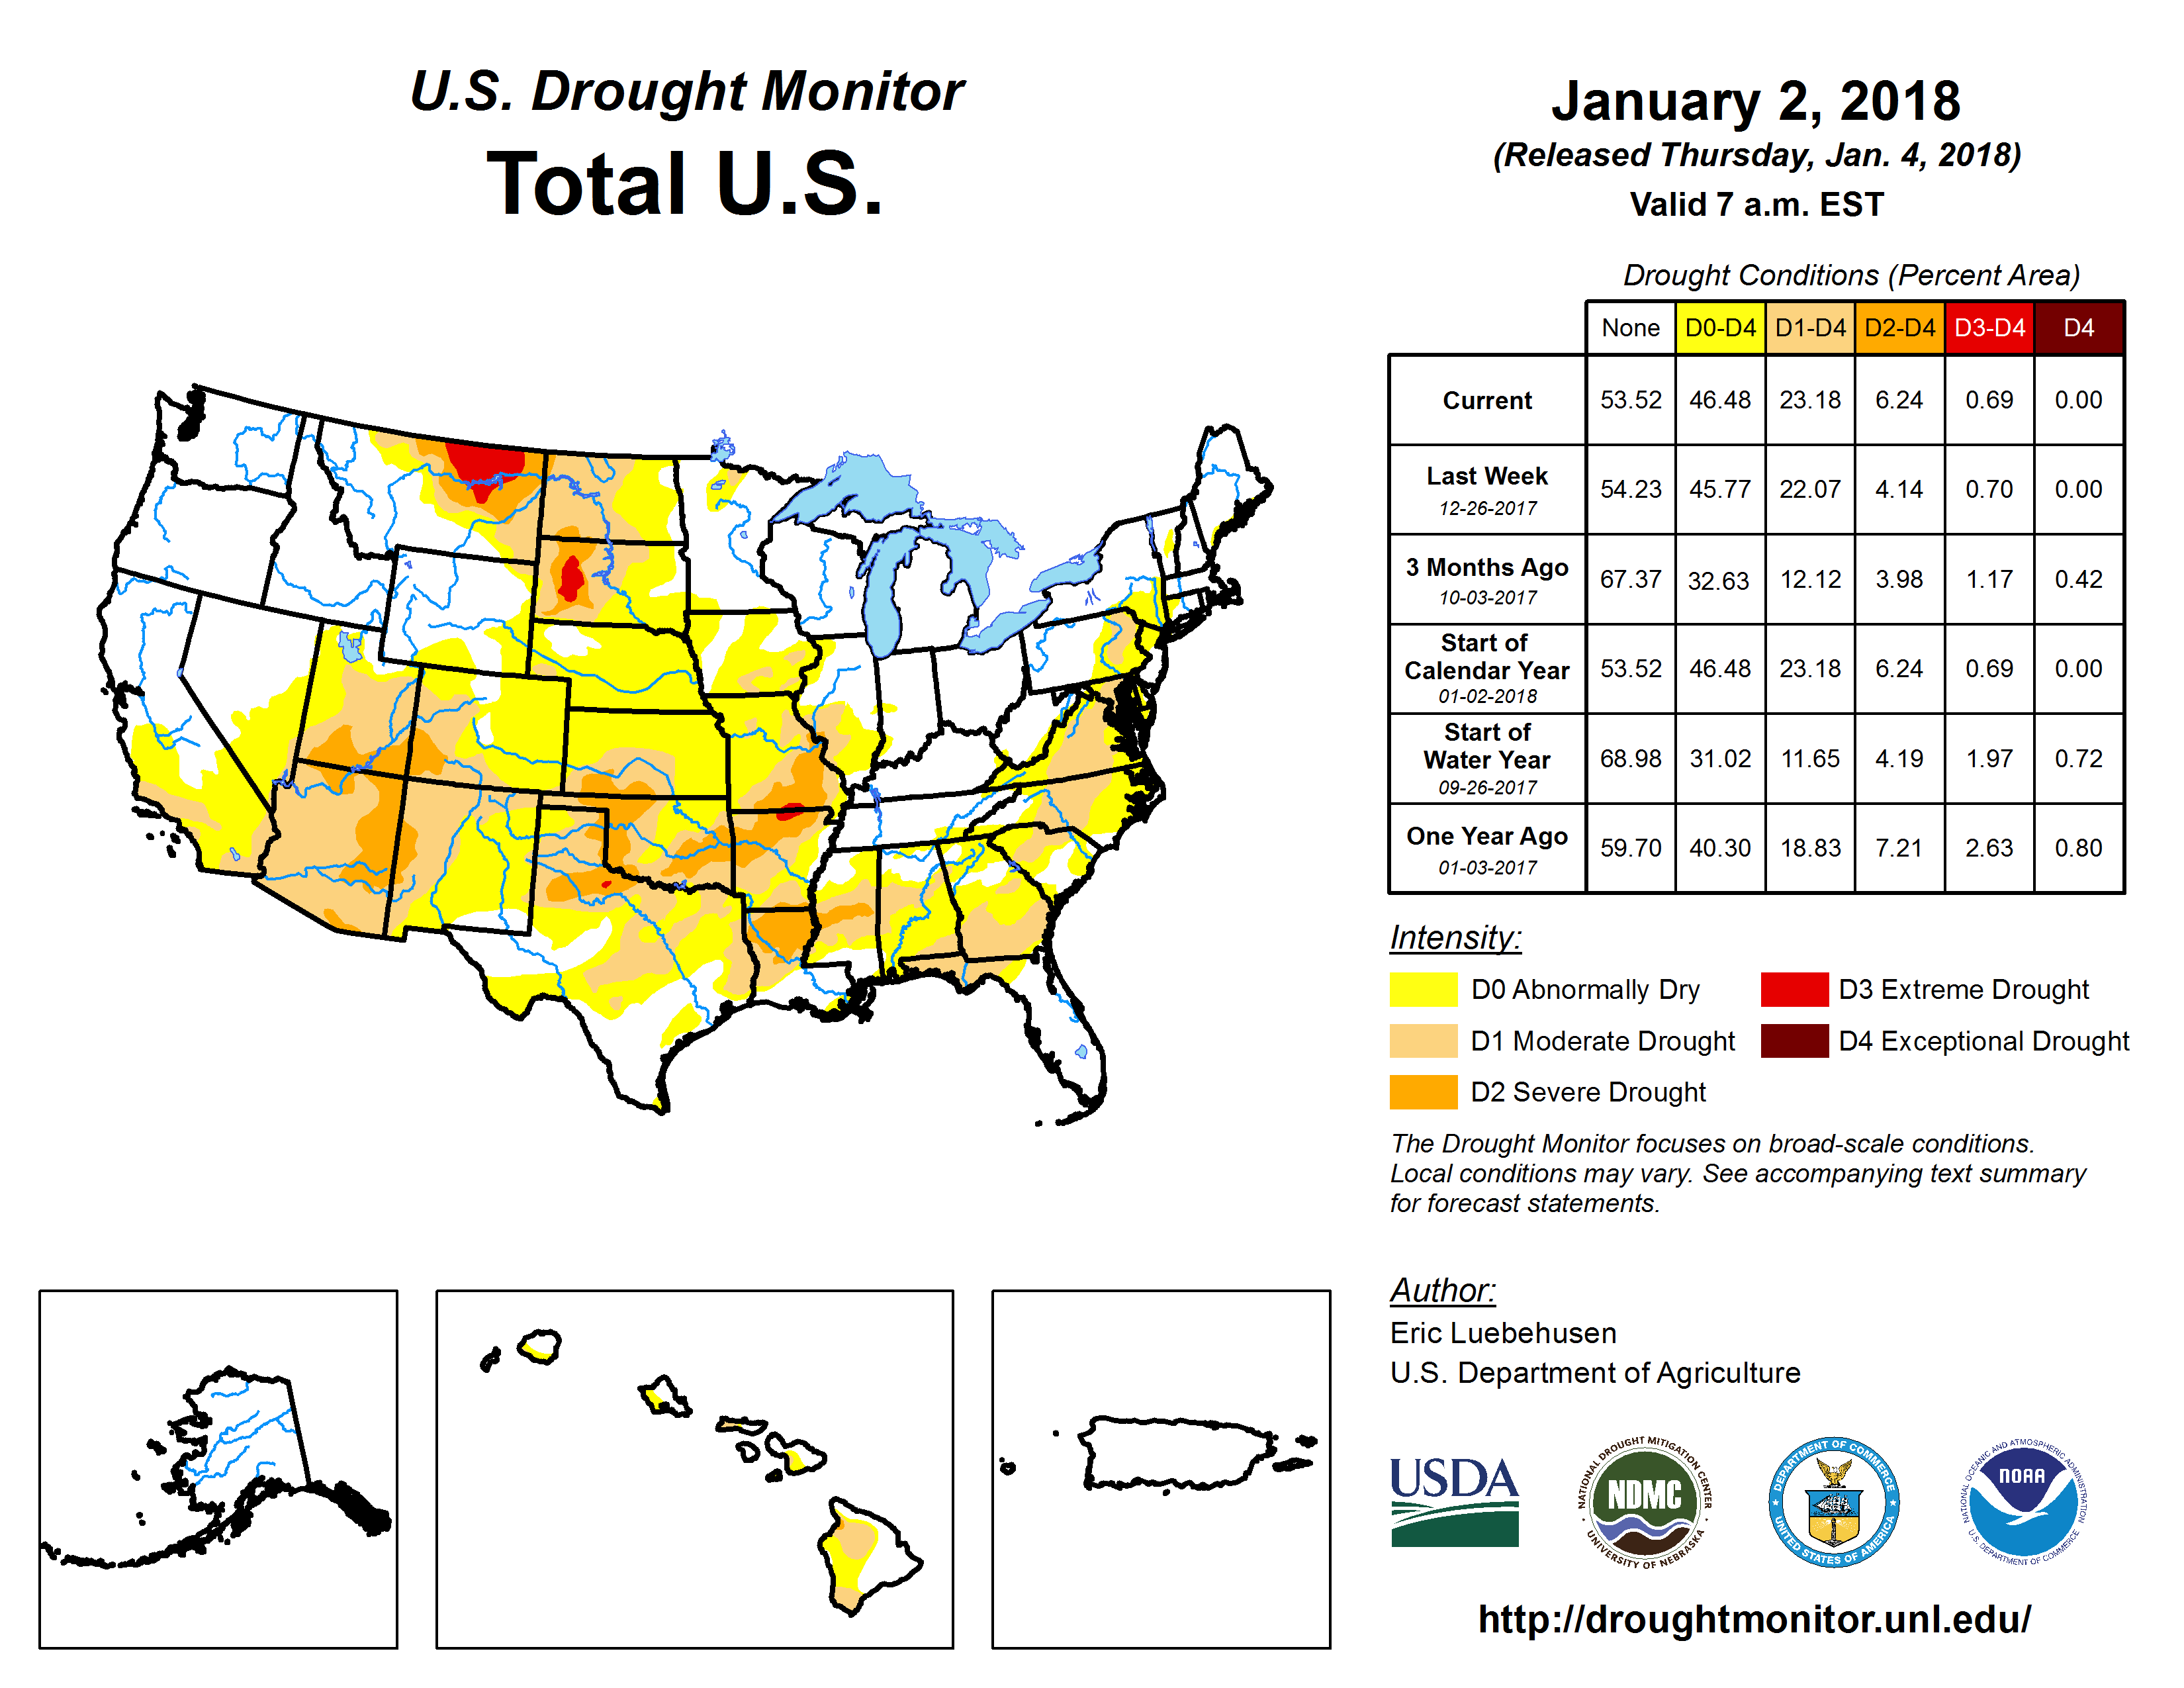
- Above-normal precipitation fell across Montana and Wyoming, in the north, and across southern Texas to the Lower Mississippi Valley and parts of the Southeast, in the south, which helped to contract drought and abnormal dryness in those areas. Drought also improved in Hawaii. But below-normal precipitation dominated most of the CONUS. This continued a pattern of dryness which has persisted for the last two to three months, and even longer in some areas. As a result, drought and abnormal dryness expanded across the Southwest to Mid-Mississippi Valley and across parts of the Southeast to Northeast on the U.S. Drought Monitor (USDM) map. Expansion outweighed contraction, so at the national level drought expanded from 21.1 percent of the CONUS at the end of November to 27.7 percent of the CONUS at the end of December (from 17.7 percent to 23.2 percent for all of the U.S.).
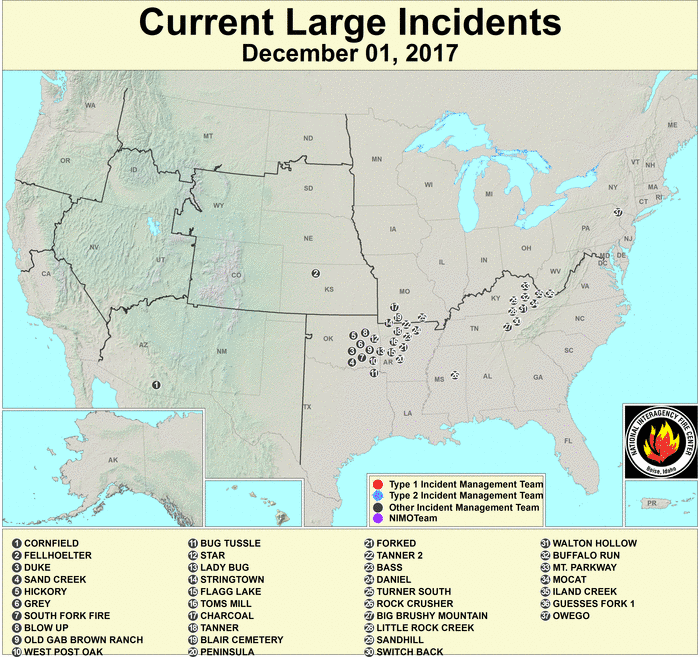
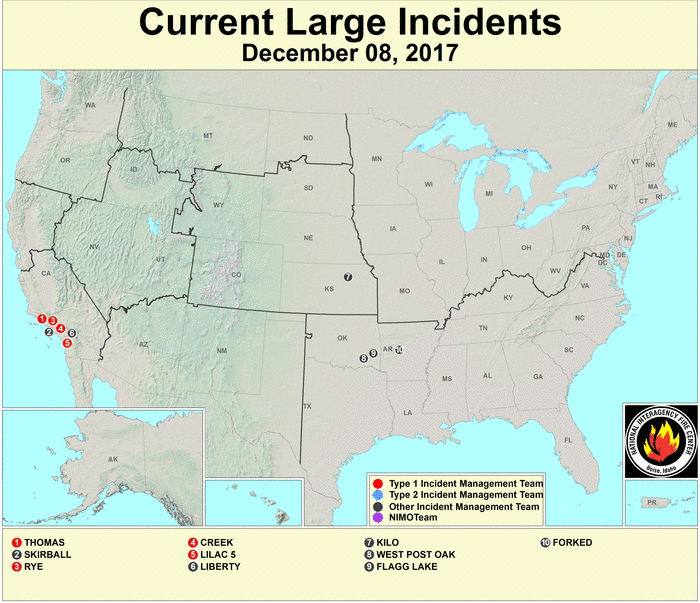
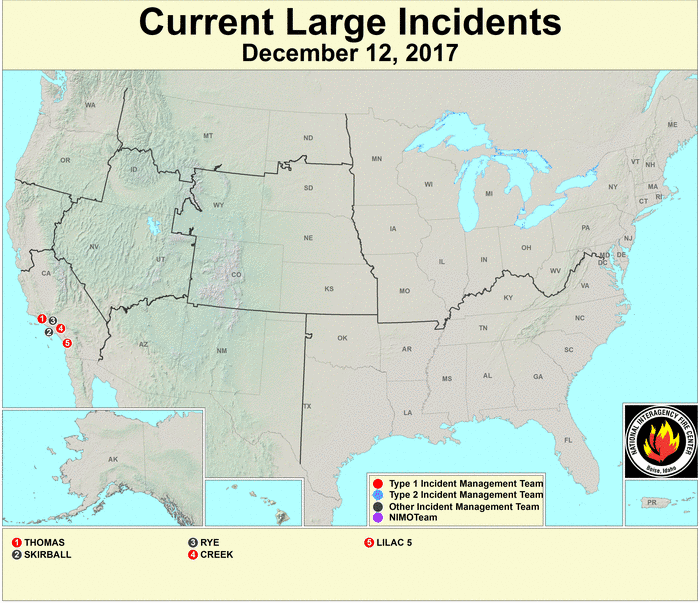
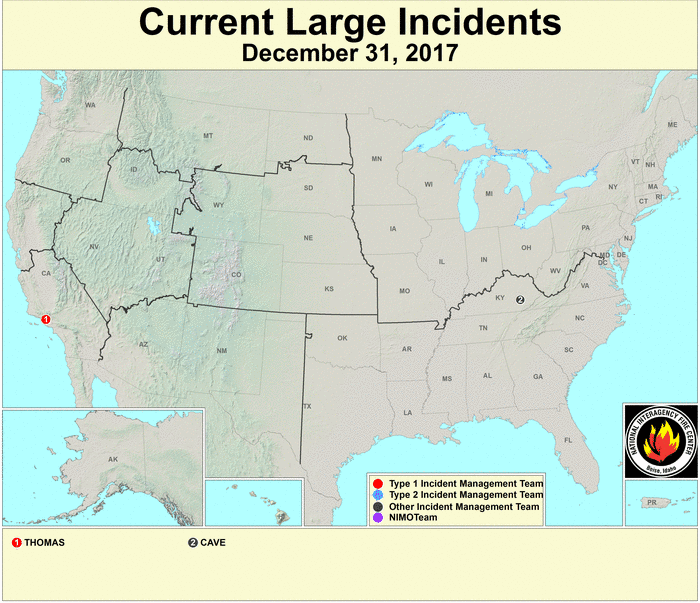
- The month began with several large wildfires burning in the southern Plains and southern Appalachians. These fires were mostly extinguished by mid-month, but new large wildfires had developed in southern California. These fires were mostly tamed during the last half of the month.
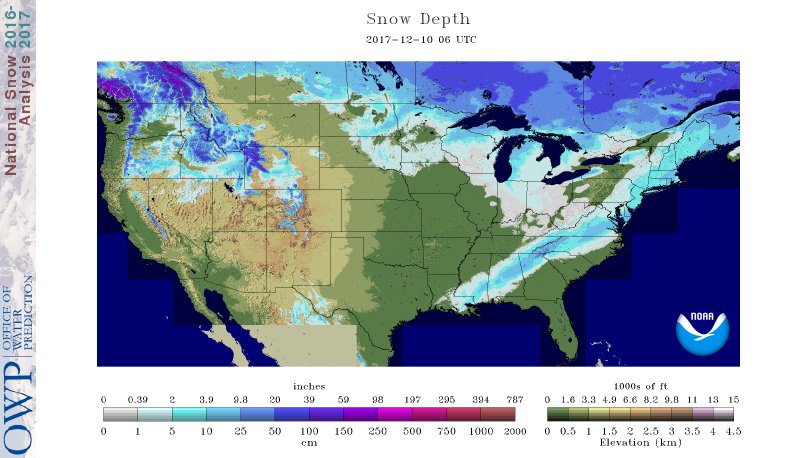
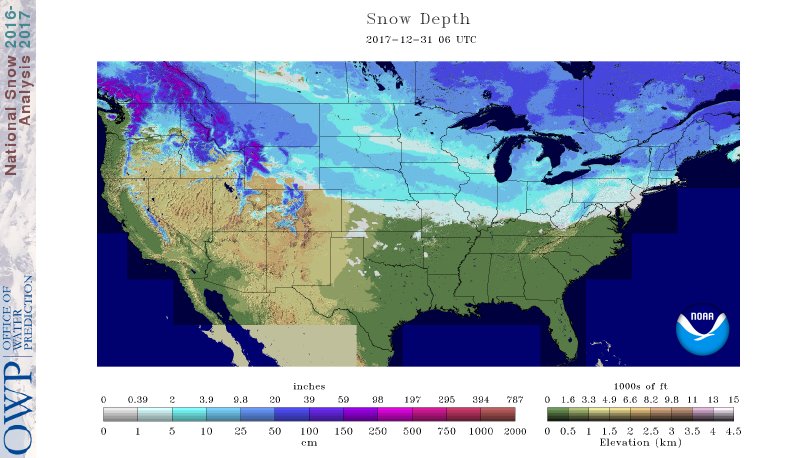
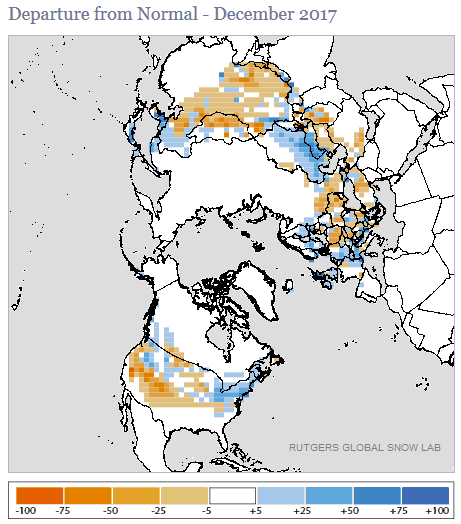
- As noted earlier, some of the weather systems and air masses were cold enough to produce snow instead of rain. December began with 9.2 percent of the CONUS experiencing a snow cover. Pacific weather systems moving across the Northwest and northern Plains increased the snow cover area to about a fourth of the CONUS early in the month. A westerly flow kept the snow cover extent within 22 to 30 percent over the next two weeks. The snow cover area rapidly increased when the pattern shifted at the end of the month, peaking at about 49.0 percent of the CONUS on December 25. The month ended with 41.9 percent snow cover. The satellite-based observations of snow cover extent duration showed above-normal snowpack across the Northeast, below-normal across the southern CONUS, and a mixed anomaly pattern from the Pacific Northwest to northern Plains. When integrated across the month and across the CONUS, December 2017 ranked as the 20th lowest snow cover extent in the 52-year satellite record.
- The atmospheric circulation needed to create the instability and dynamics favorable for severe weather consists largely of a southwesterly flow across the central part of the CONUS. With an upper-level ridge (over the West), northwesterly flow (over the central CONUS), and westerly flow dominating the upper-level circulation this month, severe weather was inhibited, with only 13 tornadoes reported this month (based on preliminary reports), which is below the December average of 24. Most of the tornadoes developed on December 19-20 in the Lower Mississippi Valley and Southeast when a low pressure system and front tracked across the Gulf of Mexico.
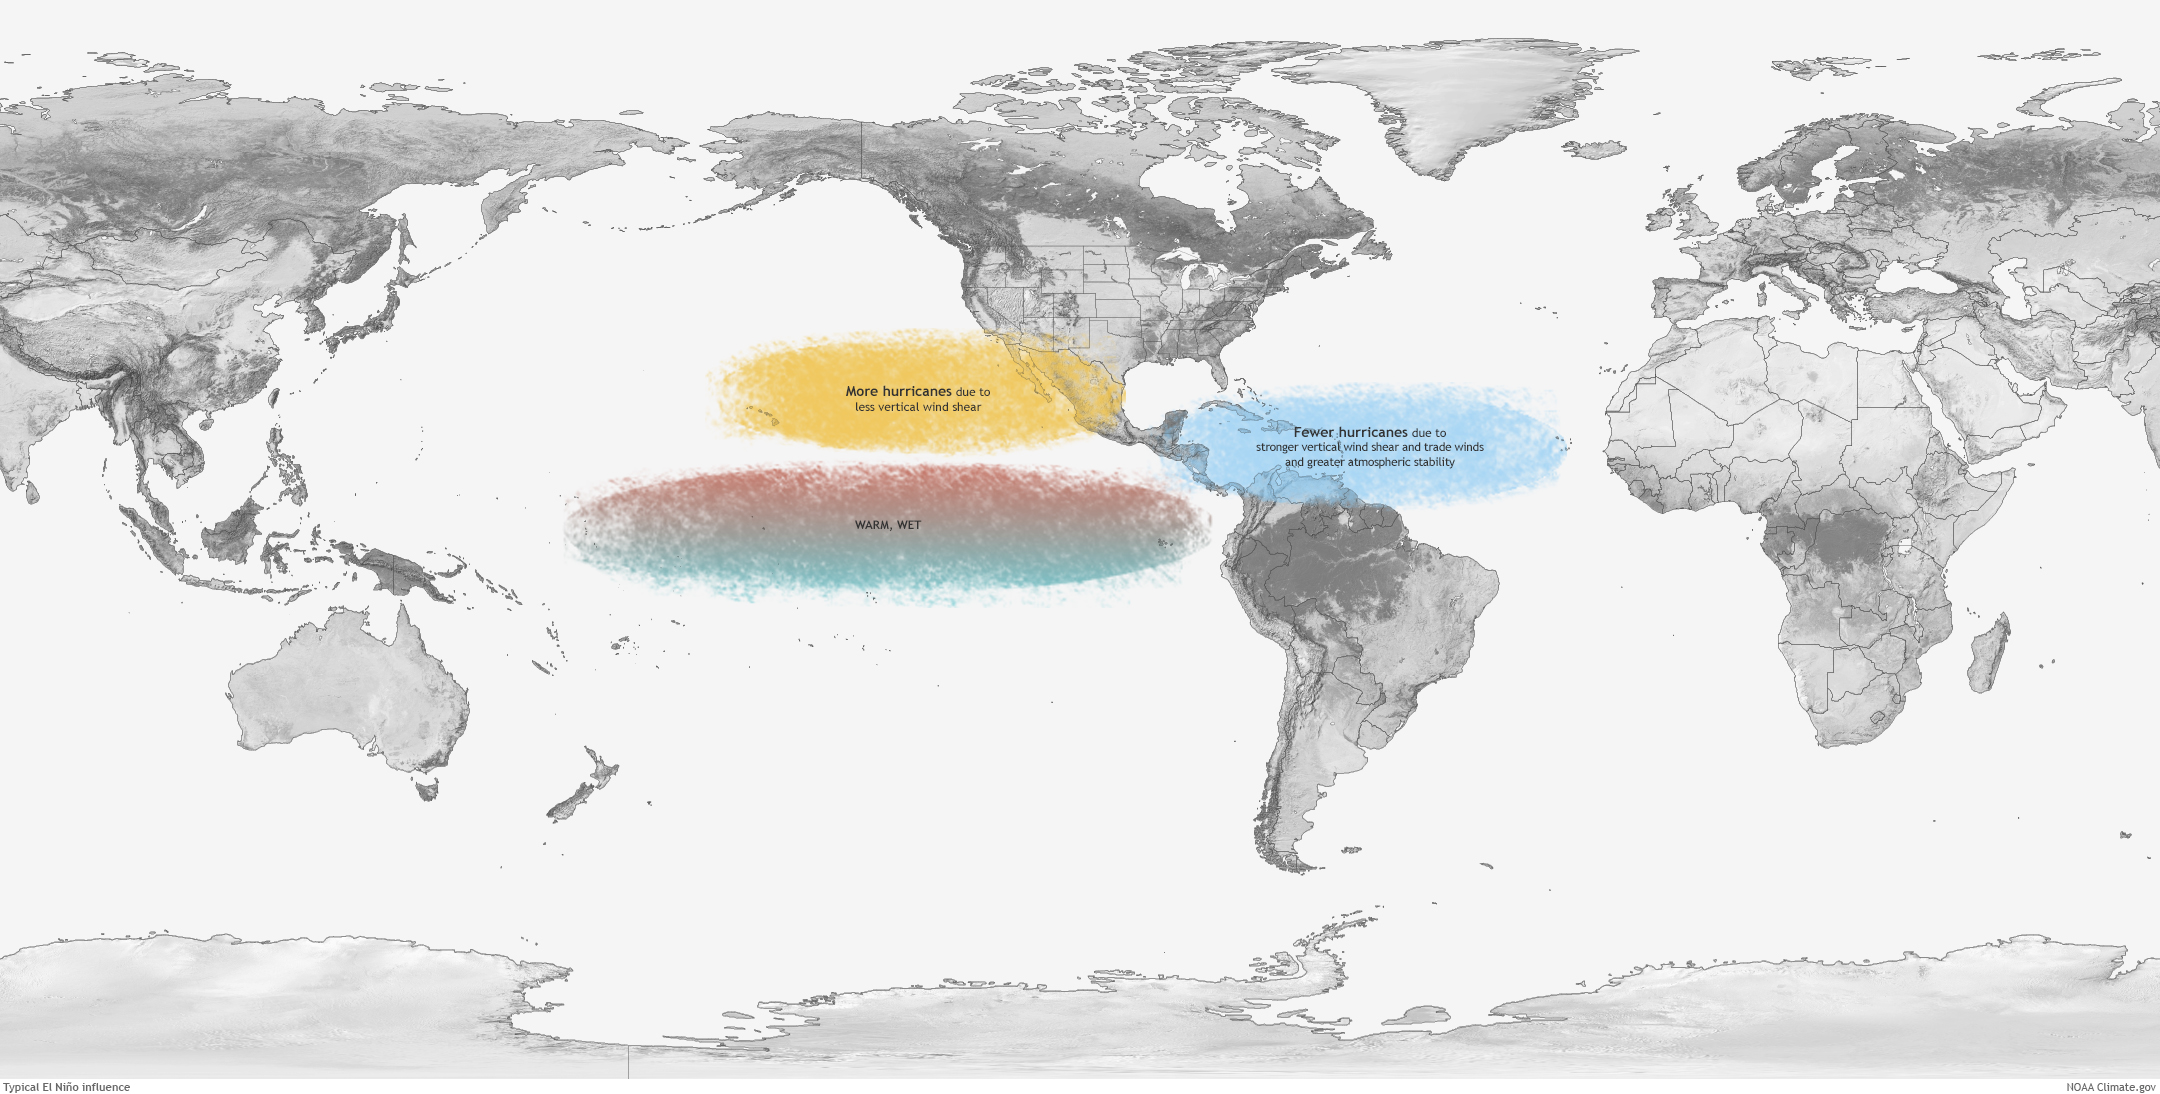
Typically tropical cyclone activity is enhanced in the Eastern North Pacific and inhibited in the North Atlantic during El Niños, and inhibited in the Eastern North Pacific and enhanced in the North Atlantic during La Niñas, due mostly to changes in vertical wind shear during the two extreme events. The relationship is unclear during ENSO-neutral events. The tropical Pacific Ocean continued in a La Niña state during December 2017.
- The Atlantic hurricane season runs from June 1st through November 30th and the Eastern North Pacific hurricane season runs from May 15th through November 30th. No tropical storms or hurricanes developed in these basins during December. No tropical cyclones formed in, or moved into, the central North Pacific.
- Two named tropical systems (Tropical Storm Kai-Tak and Typhoon Tembin) and one tropical disturbance were active in the western Tropical Pacific near the U.S.-Affiliated Pacific Islands (USAPI) in Micronesia, but none of them had any significant effect on the USAPI. Tropical Storm Kai-Tak and Typhoon Tembin originated as areas of convection over western Micronesia at mid-month, but didn't intensify until they crossed into the Philippine Sea. Both tropical cyclones moved over the Philippines before traversing the South China Sea and encountering Southeast Asia. Another area of convection (99W) developed over western Micronesia at the end of the month; it developed into Tropical Storm Bolaven in early January after crossing the Philippines.
 North America monthly upper-level circulation pattern and anomalies. The upper-level circulation pattern during December, when averaged for the month, consisted of a ridge over the western CONUS and trough over the eastern CONUS. The ridge was the most significantly stronger than normal all along the western coast of North America where the 500-mb height anomalies were largest. A deeper-than-normal trough extended from the Hudson Bay to the Great Lakes and northeastern CONUS. |
|
Map of monthly precipitation anomalies. December was wetter than normal across Montana and Wyoming, parts of the Upper Mississippi Valley and western Great Lakes, parts of the southern Plains to Lower Mississippi Valley, and parts of the coastal Southeast, but drier-than-normal weather dominated most of the CONUS. Alaska had a mixed precipitation anomaly pattern, Hawaii was mostly drier than normal, and December was drier than normal in San Juan, Puerto Rico. |
|
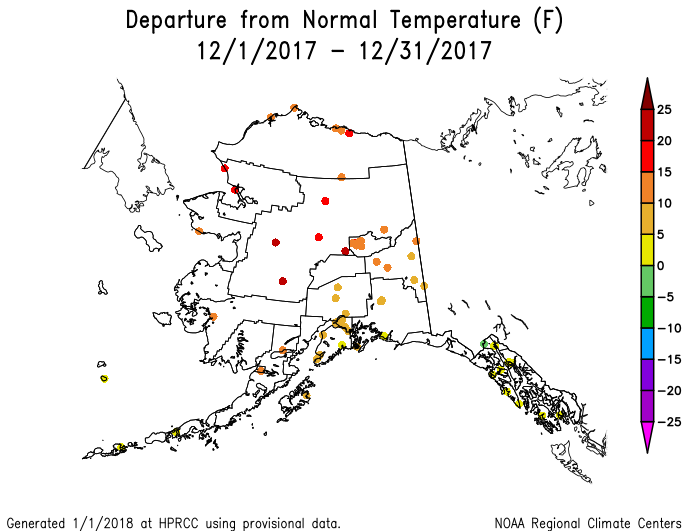
Map of monthly temperature anomalies. Monthly temperatures were warmer than normal in the southwestern CONUS and in Alaska, near to warmer than normal across most of the Plains and Southeast, and cooler than normal in parts of the Pacific Northwest and northern Rockies, and from the Great Lakes to Northeast. |
 Northern Hemisphere monthly upper-level circulation pattern and anomalies. Global Linkages: The upper-level (500-mb) circulation anomaly pattern over North America was part of a complex long-wave pattern that stretched across the Northern Hemisphere. East-west trough/ridge pairs (or couplets) and anomaly couplets could be found in the monthly maps, especially over Eurasia, North America/North Pacific, North America/North Atlantic/Europe, and Siberia/North Pacific; and latitudinally (eastern North America/Arctic, Western Europe/Arctic, and Arctic/eastern Siberia to Sea of Japan). The above-normal 500-mb heights were associated with upper-level ridging at the mid-latitudes; below-normal precipitation (over western North America, parts of Russia); below-normal snow cover (over parts of Asia, western Europe, southwestern CONUS); above-normal surface temperatures over the southwestern CONUS, Alaska, western Russia, and extreme northern Siberia; and warm SST anomalies in the eastern North Atlantic and parts of the North Pacific, South Pacific, South Atlantic, and Indian Oceans. The areas of below-normal 500-mb heights were associated with upper-level troughing; near- to below-normal surface temperatures over southeastern Canada to northeastern CONUS, Sea of Japan coastal areas, Scandinavia; cool SST anomalies in parts of the central North Pacific and Sea of Okhotsk; above-normal precipitation over Scandinavia and Eastern Europe to western Russia; and above-normal snow cover over northeastern CONUS, Scandinavia, and Sea of Japan coastal areas. Parts of eastern North America, Eurasia, northern Africa, and the Arabian peninsula were near to cooler than normal, and parts of the equatorial Pacific, eastern South Pacific, and South Atlantic had cooler-than-normal SST anomalies. But with large parts of the continents still having warmer-than-normal temperatures, and large portions of the Atlantic, Pacific, and Indian Oceans having warmer-than-normal sea surface temperatures, the December 2017 global temperature was still above normal. |
Atmospheric Drivers
Subtropical highs, and fronts and low pressure systems moving in the mid-latitude storm track flow, are influenced by the broadscale atmospheric circulation. The circulation of the atmosphere can be analyzed and categorized into specific patterns. The Tropics, especially the equatorial Pacific Ocean, provides abundant heat energy which largely drives the world's atmospheric and oceanic circulation. The following describes several of these modes or patterns of the atmospheric circulation, their drivers, the temperature and precipitation patterns (or teleconnections) associated with them, and their index values this month:
-
El Niño Southern Oscillation (ENSO)
- Description: Oceanic and atmospheric conditions in the tropical Pacific Ocean can influence weather across the globe. ENSO is characterized by two extreme modes: El Niño (warmer-than-normal sea surface temperature [SST] anomalies in the tropical Pacific) and La Niña (cooler-than-normal SST anomalies), with the absence of either of these modes termed "ENSO-neutral" conditions.
- Status: La Niña conditions were present during December 2017 with below-average SSTs across the central and eastern equatorial Pacific Ocean.
- Teleconnections (influence on weather): To the extent teleconnections are known, the typical temperature and precipitation patterns associated with La Niña during December include above-normal temperatures across the southern Plains to Lower Mississippi Valley; below-normal temperatures across the northern Plains to Upper Midwest and parts of the West; near-normal temperatures from the central Plains to East Coast; above-normal precipitation in the Pacific Northwest to northern Rockies and much of California; and below-normal precipitation across most of the Southwest, in the central and southern Plains, Mid-Mississippi Valley, Lower Mississippi Valley to Southeast, and Mid-Atlantic region.
- Comparison to Observed: The December 2017 temperature anomaly pattern does not agree with the teleconnections for La Niña. The December 2017 precipitation anomaly pattern agrees in the central Plains to Mid-Atlantic regions and most of the Southeast, but not in southern Texas, the coastal Carolinas, and the West Coast.
-
Madden-Julian Oscillation (MJO)
- Description: The MJO is a tropical disturbance or "wave" that propagates eastward around the global tropics with a cycle on the order of 30-60 days. It is characterized by regions of enhanced and suppressed tropical rainfall. One of its indices is a phase diagram which illustrates the phase (1-8) and amplitude of the MJO on a daily basis. The MJO is categorized into eight "phases" depending on the pattern of the location and intensity of the regions of enhanced and suppressed tropical rainfall. The MJO can enter periods of little or no activity, when it becomes neutral or incoherent and has little influence on the weather. Overall, the MJO tends to be most active during ENSO-neutral years, and is often absent during moderate-to-strong El Niño and La Niña episodes.
- Status: The MJO Wheeler-Hendon index began the month in phase 5, transitioned through phased 6 and 7 before going slightly incoherent for a few days (as it transitioned through phases 8 and 1), and ended the month in phase 2. Other aspects of the tropical ocean-atmosphere system (referred to in the CPC reports as the background or low frequency [i.e., La Niña] state, Kelvin and Rossby waves, and tropical cyclone activity) appeared to play a role in influencing the month's climate (especially Rossby waves and the base state, as well as Kelvin waves) (MJO updates for December 4, 11, 18, 25, and January 1).
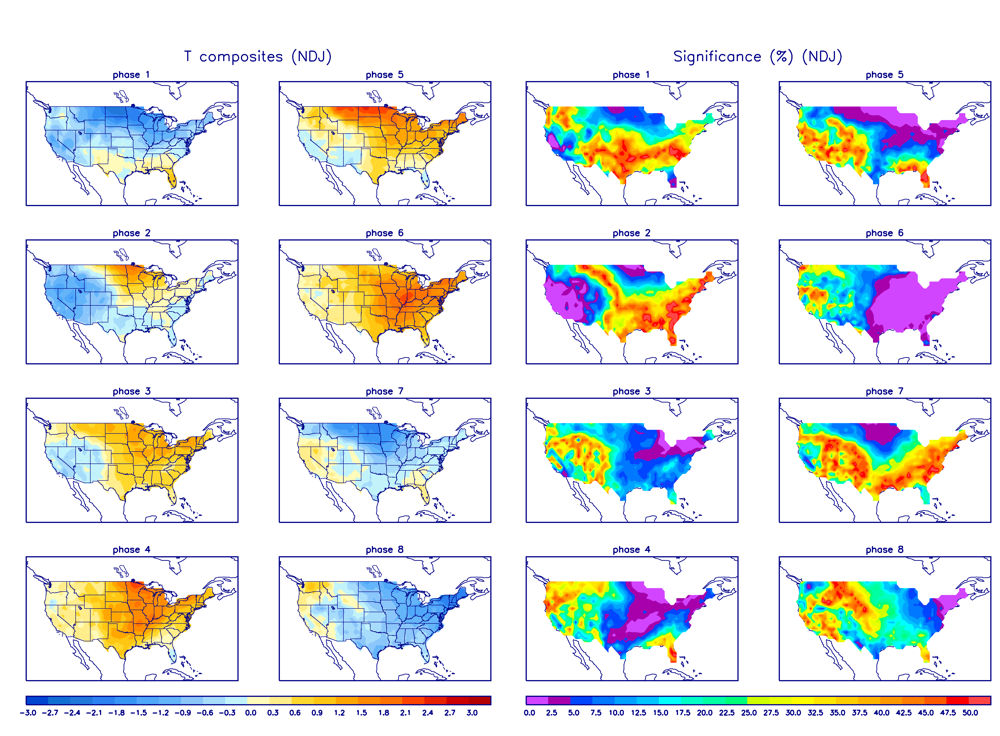
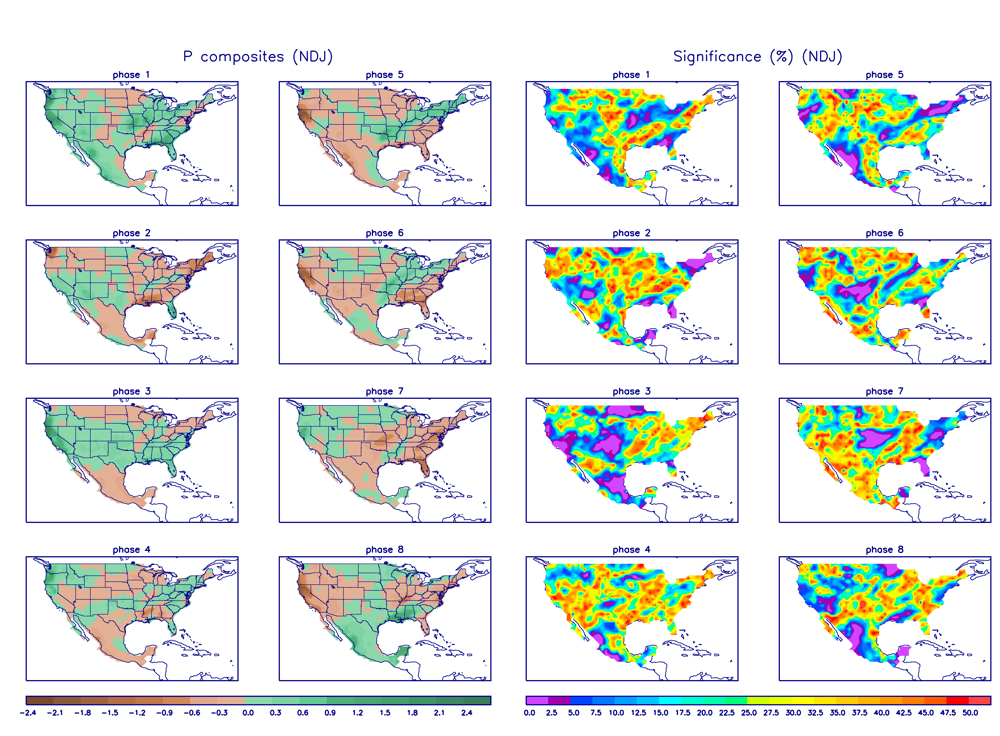
- Teleconnections (influence on weather): The MJO's temperature and precipitation teleconnections to U.S. weather depend on time of year and MJO phase. To the extent teleconnections are known, the December (November-January) teleconnections for temperature are shown here and for precipitation are shown here.
- Comparison to Observed: The MJO is transitory and can change phases (modes) within a month, so it is usually more closely related to weekly weather patterns than monthly. In the case of December 2017, the monthly temperature anomaly pattern does not match the temperature anomaly patterns associated with the MJO phases experienced this month. The weekly temperature anomaly patterns, however, closely match the corresponding MJO phase teleconnections for December 3-9 (phases 5-6), 10-16 (phase 6), and (mostly) 24-30 (transitioning near the unit circle through phases 8 and 1 to phase 2). Neither does the monthly precipitation anomaly pattern match the precipitation anomaly patterns associated with the MJO phases experienced this month. But the weekly precipitation anomaly patterns show some agreement. December 3-9 (phases 5-6) was dry in the West; December 10-16 (phase 6) was dry across most of the CONUS; and December 17-23 (phase 7) was dry in the central Plains and wet in the northern High Plains.
- The Pacific/North American (PNA) pattern
- Description: The PNA teleconnection pattern is associated with strong fluctuations in the strength and location of the East Asian jet stream. PNA-related blocking of the jet stream flow in the Pacific can affect weather downstream over North America, especially the West and especially in the winter half of the year.
- Status: The daily PNA index was positive for most of the month, especially the first half, averaging positive for the month as a whole. The 3-month-averaged index was negative.
- Teleconnections (influence on weather): To the extent teleconnections are known, a positive PNA for this time of year (January on the quarterly teleconnection maps) is associated with below-normal temperatures across the southern Plains to East Coast; above-normal temperatures across the West Coast and northern Plains to Alaska; below-normal upper-level circulation anomalies over southeastern North America; above-normal upper-level circulation anomalies over western North America; and below-normal precipitation in the Northwest, Great Basin, and most of the CONUS along and east of the Mississippi River.
- Comparison to Observed: The December 2017 upper-level circulation anomaly pattern is similar to the teleconnections for a positive PNA, except the negative anomalies in the eastern CONUS are shifted a bit northward. The monthly temperature anomaly pattern mostly doesn't match, but the weekly temperature anomaly pattern for December 6-12 (when the daily PNA was at its peak positive values) is a very good match. The monthly precipitation anomaly pattern is also a good match.
- The Arctic Oscillation (AO) pattern
- Description: The AO teleconnection pattern relates upper-level circulation over the Arctic to circulation features over the Northern Hemisphere mid-latitudes and is most active during the cold season.
- Status: The daily AO index was negative for the first half of the month and positive the last half, averaging near zero for the month. The 3-month-averaged index was slightly positive.
- Teleconnections (influence on weather): To the extent teleconnections are known, a near-zero AO in December (November-January in the AO Composites table) is typically associated with drier-than-normal conditions in the central Plains to Southeast, wetter-than-normal conditions from northern California to western Washington, and near-normal moisture conditions elsewhere in the CONUS (but the patterns are similar for a positive and negative AO); above-normal temperatures in the northern Rockies to central Plains and near-normal temperatures elsewhere across the CONUS; and near-normal upper-level circulation anomalies over North America and the adjacent oceans (Arctic, North Pacific, North Atlantic).
- Comparison to Observed: The December 2017 monthly upper-level circulation and temperature anomaly patterns show little agreement with the teleconnections for a near-zero (neutral) AO. The monthly precipitation anomaly pattern matches in the Southeast, but not in the West. However, the weekly temperature anomaly pattern for December 15-21 (when the daily AO was at its peak positive values) is a very good match for the teleconnections for a positive AO.
- The North Atlantic Oscillation (NAO) pattern
- Description: The NAO teleconnection pattern relates upper-level circulation over the North Atlantic Ocean to circulation features over the Northern Hemisphere mid-latitudes.
- Status: The daily NAO index was near zero to slightly positive throughout the month, and averaged positive for the month. The 3-month-averaged index was slightly positive.
- Teleconnections (influence on weather): To the extent teleconnections are known, a positive NAO during this time of year (January on the quarterly teleconnection maps) is associated with above-normal upper-level circulation anomalies over the central to eastern CONUS, extending across the North Atlantic to Western Europe; above-normal temperature anomalies from the Plains to East Coast; below-normal circulation anomalies over northern Canada to Greenland; and drier-than-normal precipitation anomalies in California to Nevada, but the precipitation teleconnections are weak.
- Comparison to Observed: The December 2017 precipitation anomaly pattern agrees with the teleconnections over California and Nevada, but that may be a coincidence since the precipitation teleconnections are weak. The upper-level circulation and temperature anomaly patterns show little agreement to the teleconnections.
- The West Pacific (WP) pattern
- Description: The WP teleconnection pattern is a primary mode of low-frequency variability over the North Pacific and reflects zonal and meridional variations in the location and intensity of the (East Asian) jet stream in the western Pacific.
- Status: The monthly WP index was positive, as was the three-month average WP index.
- Teleconnections (influence on weather): To the extent teleconnections are known, a positive WP during this time of year (January on the quarterly teleconnection maps) is typically associated with above-normal temperatures from the Midwest to Northeast; below-normal temperatures in the Southwest; above-normal circulation anomalies over eastern North America; below-normal circulation anomalies over the western CONUS; and above-normal precipitation from Oklahoma to the Ohio Valley.
- Comparison to Observed: The December 2017 monthly upper-level circulation, temperature, and precipitation anomaly patterns do not match the teleconnections for a positive WP.
- The Tropical/Northern Hemisphere (TNH) pattern
- Description: The TNH teleconnection pattern reflects large-scale changes in both the location and eastward extent of the Pacific jet stream, and also in the strength and position of the climatological mean Hudson Bay Low, and is dominant in the winter months. The pattern significantly modulates the flow of marine air into North America, as well as the southward transport of cold Canadian air into the north-central United States.
- Status: The TNH index was positive during December.
- Teleconnections (influence on weather): To the extent teleconnections are known, a positive TNH is typically associated with cooler-than-normal temperatures for much of the country as well as eastern Canada, drier-than-normal conditions in the West, and slightly wetter-than-normal conditions in the Tennessee Valley. The upper-level circulation anomalies for a positive TNH are below-normal 500-mb geopotential heights over the eastern two-thirds of Canada and the north central U.S., and above-normal heights over the northeastern Pacific and Gulf of Mexico into the western North Atlantic.
- Observed: The December 2017 monthly temperature temperature anomaly pattern does not agree with the teleconnections for a positive TNH, although there is some similarity with the weekly temperature anomaly pattern for the last week in December. The precipitation anomaly pattern does not agree over the Tennessee Valley but does over the West, but that may be a coincidence. The upper-level circulation anomaly pattern is a good match over the North Pacific to North America, but not over the Gulf of Mexico to North Atlantic.
| Week | Temperature | Precipitation |
| December 3-9 | MJO | MJO |
| December 10-16 | MJO, PNA | MJO |
| December 17-23 | AO | MJO |
| December 24-30 | MJO, TNH | — |
Examination of the available circulation indices and their teleconnection patterns, and comparison to observed December 2017 weekly and monthly temperature, precipitation, and circulation anomaly patterns, suggest that La Niña had some influence on the weather over the CONUS in December, but that it shared this influence with other drivers originating in other parts of the world. There was some agreement between the observed precipitation anomalies and the teleconnections for La Niña, but the temperature anomalies did not match. The other equatorial driver (associated with the MJO), however, had good agreement between the observed weekly anomalies and the corresponding teleconnections for most weeks. The PNA, NAO, WP, and TNH were all positive for the month. The observed anomalies showed little agreement with the teleconnections for the NAO and WP, so the drivers behind these indices likely had little influence on this month's weather. The upper-level circulation anomaly patterns had some similarity to the teleconnections for the PNA and TNH, which suggested the Pacific jet stream and Hudson Bay Low strongly influenced the circulation over North America. There was also a good match between the observed precipitation anomalies and the teleconnections for the PNA and TNH. The AO was negative for the first half of the month and positive for the second half. There was little agreement between the AO teleconnections and the observed upper-level circulation anomalies, and just some agreement with the observed precipitation anomalies. The temperature anomalies showed little agreement with the AO teleconnections, except for the third week of the month. Likewise, the observed temperature anomalies generally did not match the teleconnections for the PNA and TNH, except for certain weeks. The PNA matched well during the second week (when the PNA index was strongest) and the TNH matched during the last week.
This month illustrates several things. First, it illustrates how the weather and climate anomaly patterns can be influenced by atmospheric drivers (or modes of atmospheric variability) originating in the equatorial Pacific Ocean, North Pacific Ocean, and northeast North America (Hudson Bay Low). Second, it demonstrates how the circulation anomaly patterns can result from a complex interaction of many drivers operating at different time scales, and how some drivers can have influence at certain times of the month while others have influence at other times of the month. Third, it shows the importance of selecting an appropriate time scale to examine and how signals can be masked when averaging over a monthly time scale.