Note: This report catalogs recent tropical cyclones across the North Atlantic and East Pacific and places each basin’s tropical cyclone activity in a climate-scale context. It is not updated in real time. Users seeking the real time status and forecasts of tropical cyclones should visit The National Hurricane Center.
Atlantic Basin
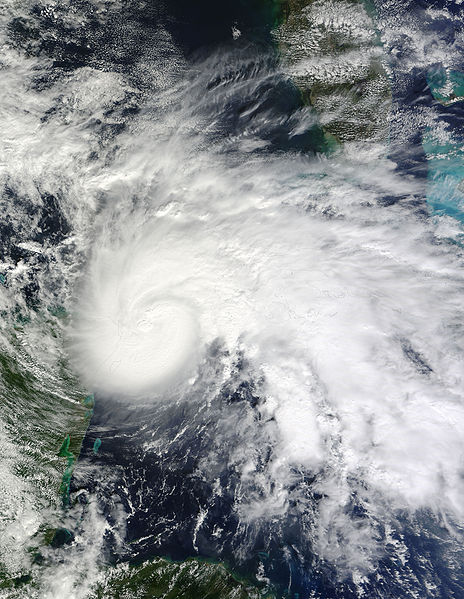 Tropical Storm Ida Satellite Image |
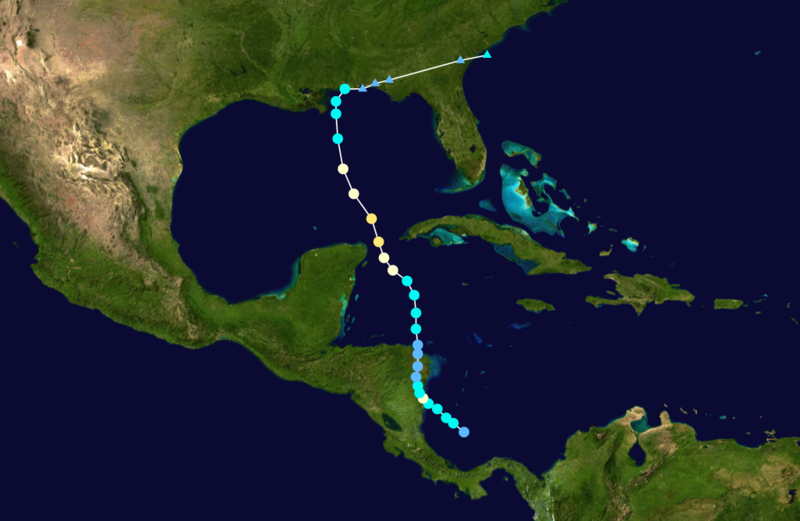 Tropical Storm Ida Track  Saffir-Simpson Scale Color Legend | ||||||||
| Tropical Cyclone | Ida | ||||||||
| Cyclogenesis Date | 11/04 | Cyclolysis Date | 11/10 | ||||||
| Highest Saffir-Simpson Category | Cat 2 | ||||||||
| Maximum 6-hr Sustained Wind | 104 mph (90 kt or 167 km/h) | ||||||||
| Min Pressure | 993 mbar | ||||||||
| Accumulated Cyclone Energy (ACE*) Index (kt2) | 7.4575 x 10⁴ | ||||||||
| Landfall Information (date, location and sustained winds) | 11/05 - Tasbapauni, Nicaragua (65 kt or 120 km/h) 11/10 - Dauphin, Alabama (40 kt or 75 km/h) 11/10 - Bon Secour, Alabama(40 kt or 75 km/h) |
||||||||
| Deaths | 1 | ||||||||
| *The (ACE) Index calculations are based on preliminary data. | |||||||||
More information on Ida is available from the NOAA National Hurricane Center.
Northwest Pacific Basin
 Tropical Storm Nida Satellite Image |
 Tropical Storm Nida Track Saffir-Simpson Scale Color Legend | ||||||||
| Tropical Cyclone | Nida | ||||||||
| Cyclogenesis Date | 11/23 | Cyclolysis Date | 12/03 | ||||||
| Highest Saffir-Simpson Category | Cat 5 | ||||||||
| Maximum 6-hr Sustained Wind | 184 mph (160 kt or 296 km/h) | ||||||||
| Min Pressure | 905 mbar | ||||||||
| Accumulated Cyclone Energy (ACE*) Index (kt2) | 45.4025 x 10⁴ | ||||||||
| Landfall Information (date, location and sustained winds) | N/A | ||||||||
| Deaths | 0 | ||||||||
| *The (ACE) Index calculations are based on preliminary data. | |||||||||
North Indian Basin
 Tropical Storm Phyan Satellite Image |
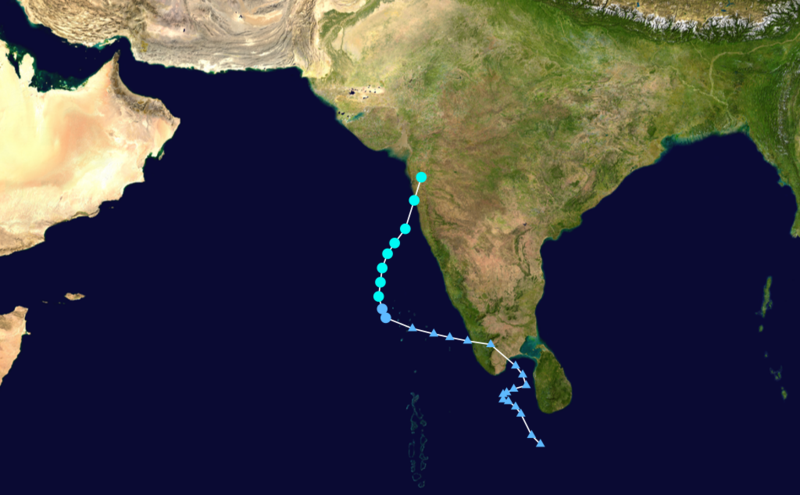 Tropical Storm Phyan Track Saffir-Simpson Scale Color Legend | ||||||||
| Tropical Cyclone | Phyan | ||||||||
| Cyclogenesis Date | 11/09 | ||||||||
| Cyclolysis Date | 11/11 | ||||||||
| Highest Saffir-Simpson Category | TS | ||||||||
| Maximum 6-hr Sustained Wind | 58 mph (50 kt or 93 km/h) | ||||||||
| Min Pressure | 992 | ||||||||
| Accumulated Cyclone Energy (ACE*) Index (kt2) | 1.3100 x 10⁴ | ||||||||
| Landfall Information (date, location and sustained winds) | 11/11 - Maharashtra (39 kt or 72 km/h) | ||||||||
| Deaths | N/A | ||||||||
| *The (ACE) Index calculations are based on preliminary data. | |||||||||
South Indian Basin
 Tropical Storm Anja Satellite Image |
 Tropical Storm Anja Track Saffir-Simpson Scale Color Legend | ||||||||
| Tropical Cyclone | Anja | ||||||||
| Cyclogenesis Date | 11/14 | ||||||||
| Cyclolysis Date | 11/18 | ||||||||
| Highest Saffir-Simpson Category | Cat 4 | ||||||||
| Maximum 6-hr Sustained Wind | 132 mph (115 kt or 213 km/h) | ||||||||
| Min Pressure | 950 | ||||||||
| Accumulated Cyclone Energy (ACE*) Index (kt2) | 12.5300 x 10⁴ | ||||||||
| Landfall Information (date, location and sustained winds) | N/A | ||||||||
| Deaths | N/A | ||||||||
| *The (ACE) Index calculations are based on preliminary data. | |||||||||
 Tropical Storm Bongani Satellite Image |
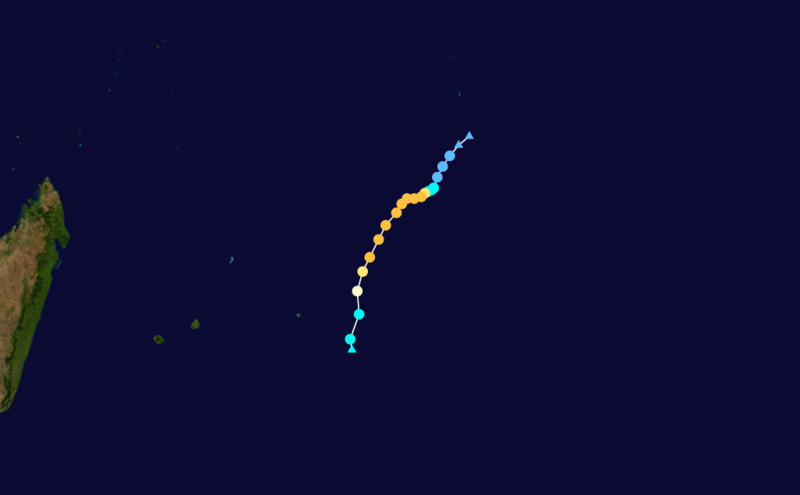
 Tropical Storm Bongani Track Saffir-Simpson Scale Color Legend | ||||||||
| Tropical Cyclone | Bongani | ||||||||
| Cyclogenesis Date | 11/23 | ||||||||
| Cyclolysis Date | 11/25 | ||||||||
| Highest Saffir-Simpson Category | 45 | ||||||||
| Maximum 6-hr Sustained Wind | 52 mph (45 kt or 83 km/h) | ||||||||
| Min Pressure | 997 | ||||||||
| Accumulated Cyclone Energy (ACE*) Index (kt2) | 1.3918 x 10⁴ | ||||||||
| Landfall Information (date, location and sustained winds) | N/A | ||||||||
| Deaths | N/A | ||||||||
| *The (ACE) Index calculations are based on preliminary data. | |||||||||