Note: This Synoptic Discussion describes recent weather events and climate anomalies in relation to the phenomena that cause the weather. These phenomena include the jet stream, fronts and low pressure systems that bring precipitation, high pressure systems that bring dry weather, and the mechanisms which control these features — such as El Niño, La Niña, and other oceanic and atmospheric drivers (PNA, NAO, AO, and others). The report may contain more technical language than other components of the State of the Climate series.
Summary
The Earth's ocean-atmosphere system continued in an ENSO-neutral state during January 2019, although El Niño conditions were expected to develop soon. The upper-level circulation was quite active this month with short-wave ridges and troughs migrating through a long-wave pattern which retrograded in the opposite direction across the contiguous United States (CONUS) as the month progressed. Temperatures see-sawed as the long-wave ridge retrograded, and Pacific weather systems brought areas of above-normal precipitation as they migrated across the CONUS with the short-wave systems. Beneficial precipitation in the West helped contract the national drought footprint. National snow cover area declined beneath ridging at the beginning of the month, then increased as weather systems drew in colder Canadian air and Gulf of Mexico moisture beneath central CONUS troughing as the month progressed. A trough and complex surface low/frontal system brought a severe weather outbreak to the South on January 19th, but other than that the upper-level flow inhibited severe weather with a below-normal tornado count for the month. The upper-level circulation, temperature, and precipitation anomaly patterns suggest that the weather during January reflected the influence of atmospheric drivers originating in the North Pacific Ocean, with an alternating influence of Arctic and North Atlantic drivers. See below for details.
Synoptic Discussion
 Animation of daily upper-level circulation for the month.
|
 Animation of daily surface fronts and pressure systems for the month.
|
In the Northern Hemisphere, January is in the middle of climatological winter when solar heating is at its minimum due to the low sun angle, and an expanded circumpolar vortex results in the furthest southern extent of the jet stream. Polar air masses dominate the weather over the contiguous U.S. (CONUS), and the warm, dry subtropical high pressure belts have their least influence.
 500-mb mean circulation for North America for January 1-17, 2019.
|
 500-mb mean circulation for North America for January 18-31, 2019.
|
 500-mb circulation anomaly for North America for January 1-17, 2019.
|
 500-mb circulation anomaly for North America for January 18-31, 2019.
|
January 2019 began with a large upper-level low pressure system moving out of the southwestern U.S. across the southern Plains, Southeast, and Mid-Atlantic region. Upper-level long-wave ridging then dominated the northern states and shifted west (retrograded) during the next two weeks, with upper-level lows and short-wave troughs undercutting the ridge as they traversed across the southern States. The long-wave ridge shifted further west during the last half of the month, with the ridge axis along the West Coast, allowing a deep trough to develop over the eastern CONUS.
 500-mb mean circulation for North America for January 1-3, 2019.
|
 500-mb circulation anomalies for North America for January 1-3, 2019.
|
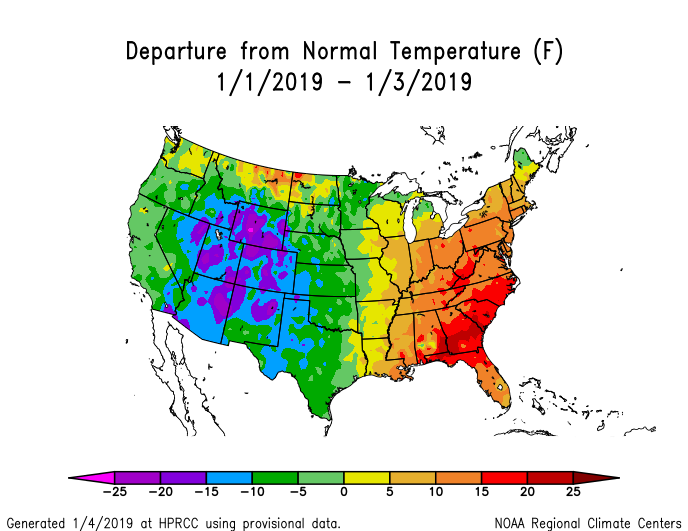 Temperature anomalies (departure from normal) for the CONUS for January 1-3, 2019.
|
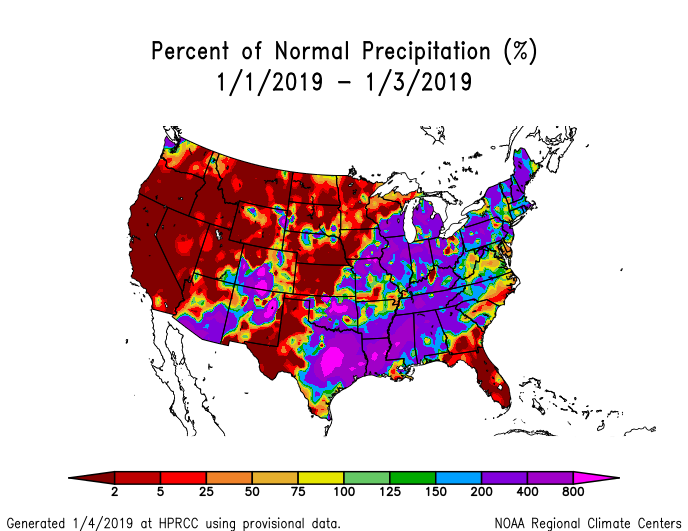 Precipitation anomalies (percent of normal) for the CONUS for January 1-3, 2019.
|
January 1-3: The upper-level low at the beginning of the month brought colder-than-normal temperatures to the western CONUS. A southerly flow on its eastern side funneled Gulf of Mexico moisture and warmer-than-normal air into the southern Plains to Southeast, and Ohio Valley to Northeast.
 500-mb mean circulation for North America for January 4-10, 2019.
|
 500-mb circulation anomalies for North America for January 4-10, 2019.
|
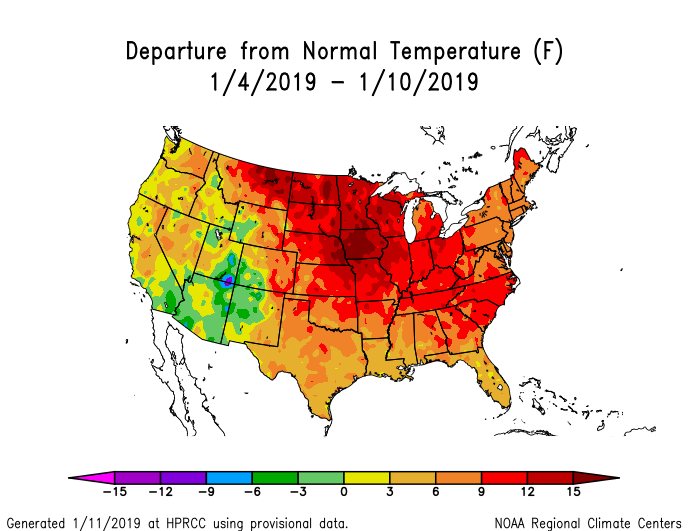 Temperature anomalies (departure from normal) for the CONUS for January 4-10, 2019.
|
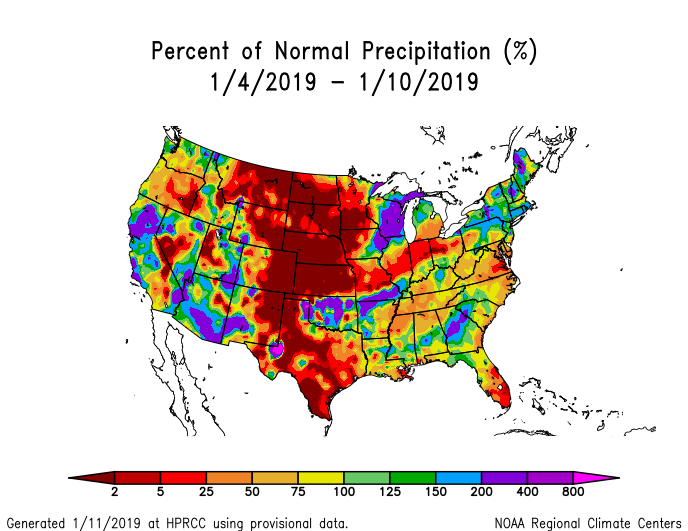 Precipitation anomalies (percent of normal) for the CONUS for January 4-10, 2019.
|
January 4-10: As the upper-level low exited the country, the upper-level ridge shifted westward and strengthened, bringing warmer-than-normal temperatures to much of the CONUS. Upper-level lows and short-wave troughs still propagated across the southern states in the jet stream flow, but they were fighting against the long-wave ridge, so precipitation was above-normal only in scattered areas.
 500-mb mean circulation for North America for January 11-17, 2019.
|
 500-mb circulation anomalies for North America for January 11-17, 2019.
|
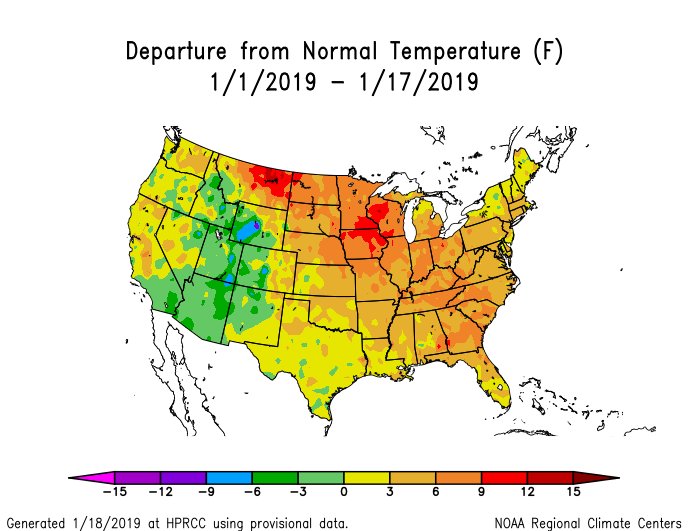
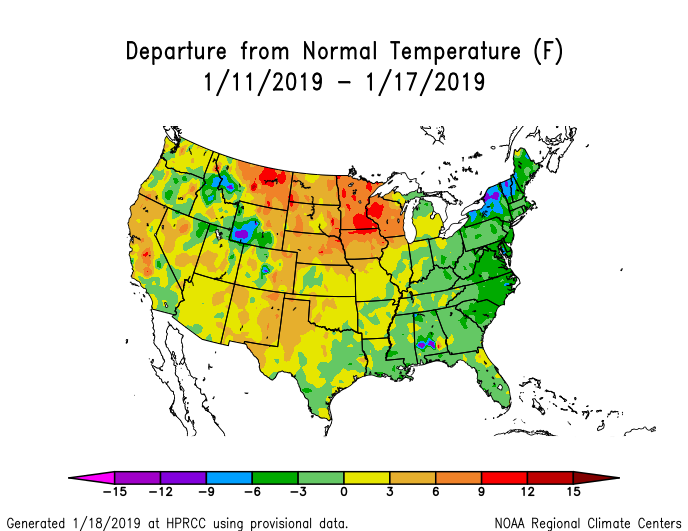 Temperature anomalies (departure from normal) for the CONUS for January 11-17, 2019.
|
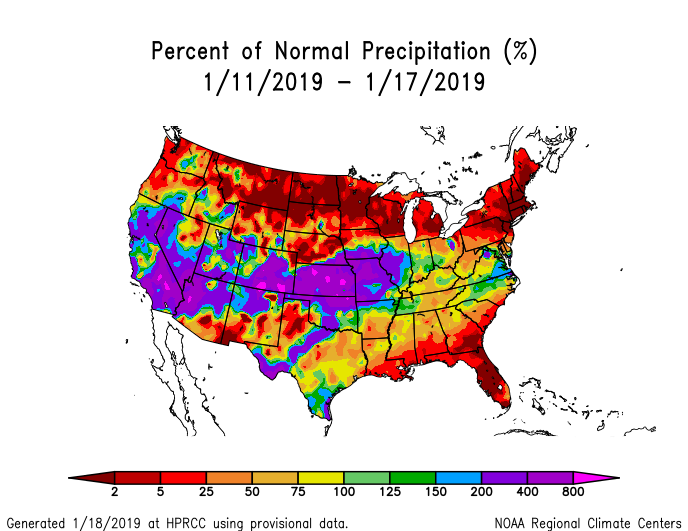 Precipitation anomalies (percent of normal) for the CONUS for January 11-17, 2019.
|
January 11-17: As the upper-level lows reached the eastern CONUS, some tracked up the East Coast with their surface lows pulling in cooler Canadian air behind them, eventually bringing cooler-than-normal temperatures to the eastern CONUS. The upper-level long-wave pattern continued to retrograde through the period, with Pacific lows eventually spreading above-normal precipitation across California to the central Plains and Mid-Mississippi Valley.
 500-mb mean circulation for North America for January 18-24, 2019.
|
 500-mb circulation anomalies for North America for January 18-24, 2019.
|
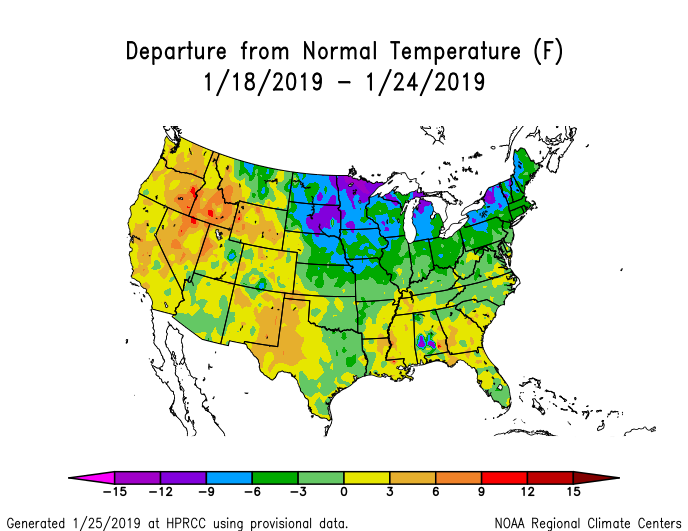 Temperature anomalies (departure from normal) for the CONUS for January 18-24, 2019.
|
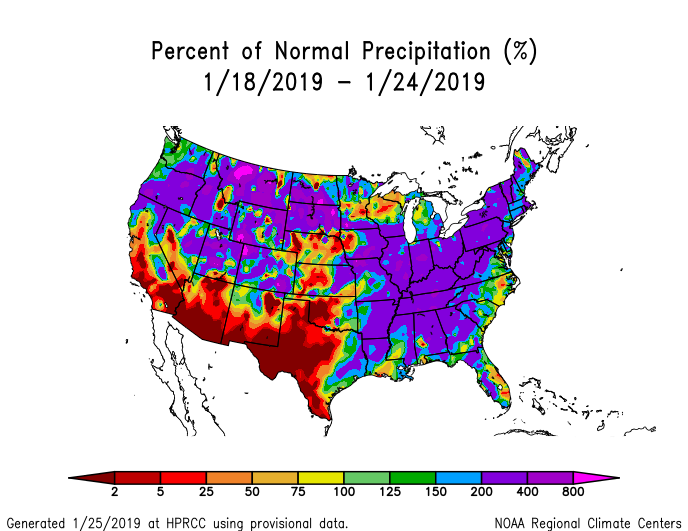 Precipitation anomalies (percent of normal) for the CONUS for January 18-24, 2019.
|
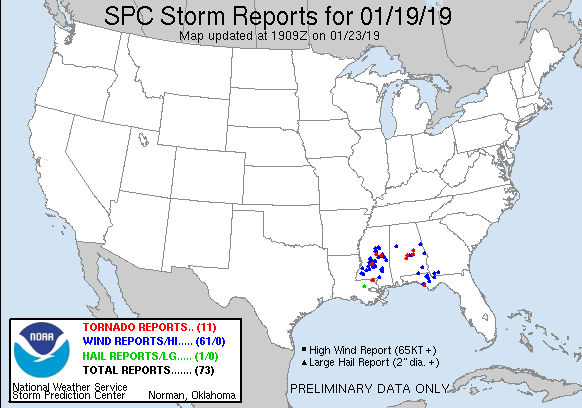
January 18-24: As the upper-level long-wave ridge settled in along the West Coast, a long-wave trough began to intensify across eastern North America. But before it strengthened, two strong upper-level lows from the Pacific migrated across the southern to eastern states. The first one triggered severe weather in the South around January 19th. Both pulled in Gulf of Mexico moisture to bring above-normal precipitation to much of the country along and east of the Mississippi River. Moisture from the Pacific contributed to above-normal precipitation across the Pacific Northwest to northern Plains. The ridge kept much of the West warmer than normal, but colder-than-normal Canadian air masses began to spread into the Upper Midwest to Northeast.
 500-mb mean circulation for North America for January 25-31, 2019.
|
 500-mb circulation anomalies for North America for January 25-31, 2019.
|
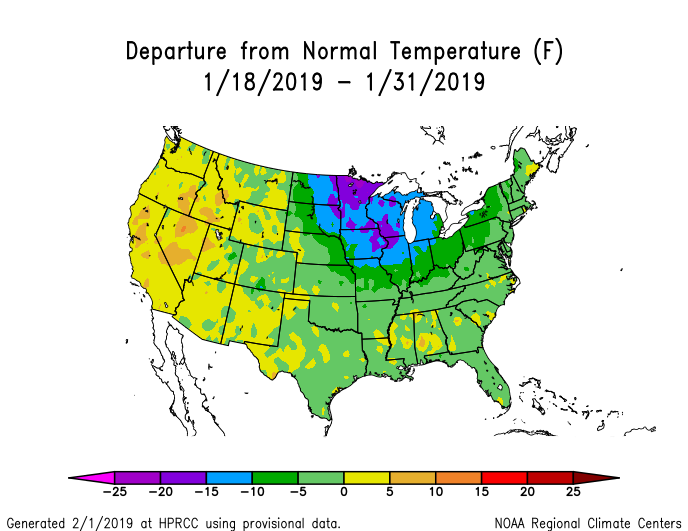
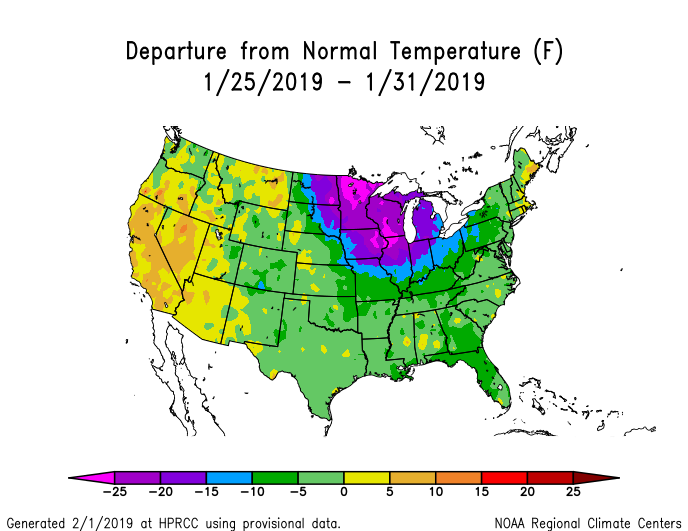 Temperature anomalies (departure from normal) for the CONUS for January 25-31, 2019.
|
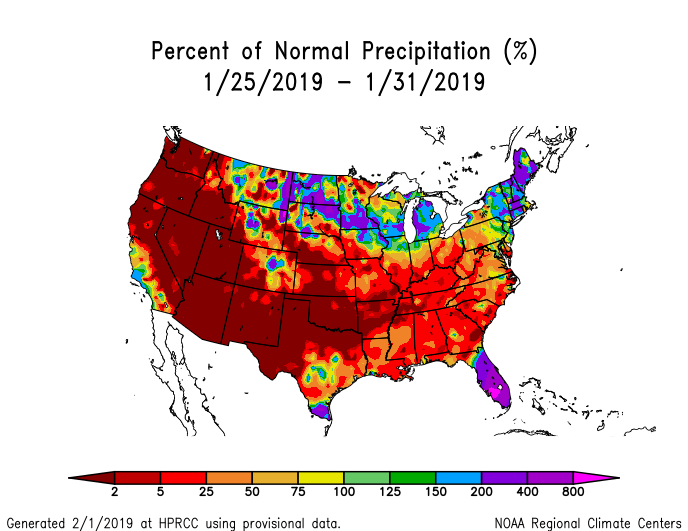 Precipitation anomalies (percent of normal) for the CONUS for January 25-31, 2019.
|
January 25-31: During the last week of the month, a classic ridge west/trough east pattern became firmly established. The northwesterly flow over the central CONUS blocked moisture from the Pacific and Gulf, resulting in below-normal precipitation across much of the country. The northwesterly flow and eastern long-wave trough funneled very cold Canadian air masses across the country east of the Rockies, while warmer-than-normal air hung on beneath the ridge over the Far West.
 500-mb mean circulation for North America for January 2019.
|
 500-mb circulation anomalies for North America for January 2019.
|
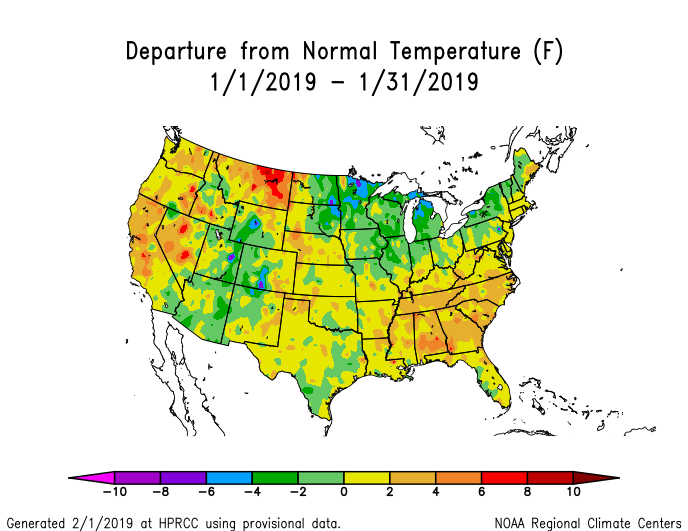 Temperature anomalies (departure from normal) for the CONUS for January 2019.
|
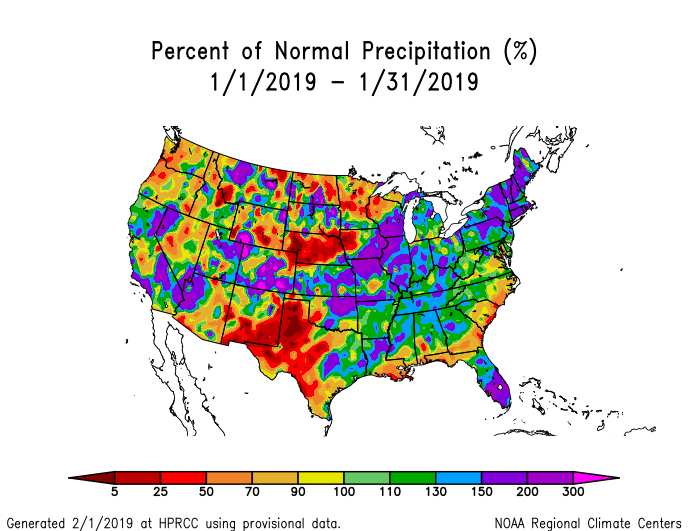 Precipitation anomalies (percent of normal) for the CONUS for January 2019.
|
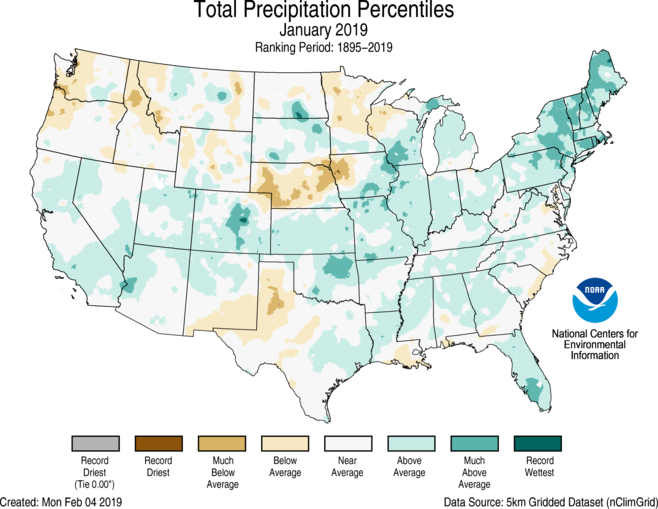
The full monthly circulation pattern reflected the dominance of the ridge west/trough east pattern at the higher latitudes, but was tempered in the south by the migrating short-wave troughs and their companion short-wave ridges which resulted in a near-normal monthly mean circulation pattern. The monthly temperature anomaly pattern was patchy, reflecting the mixture of weekly temperature anomalies — colder-than-normal across the Great Lakes where the trough dominated during the last half of the month, colder-than-normal in the Southwest reflecting the migrating short-wave troughs, and warmer than normal in the Northwest and Southeast where ridging was not totally offset by troughing. The precipitation anomaly pattern for the month (the wet areas) represented an additive result of precipitation from the individual frontal passages and low pressure systems. The dry areas resulted from persistence of upper-level ridging, or areas that missed out on the precipitation purely by chance, and were most notable in the central Plains (especially Nebraska) and southern High Plains. The circulation during this month was also reflected in snow, drought, and regional records.
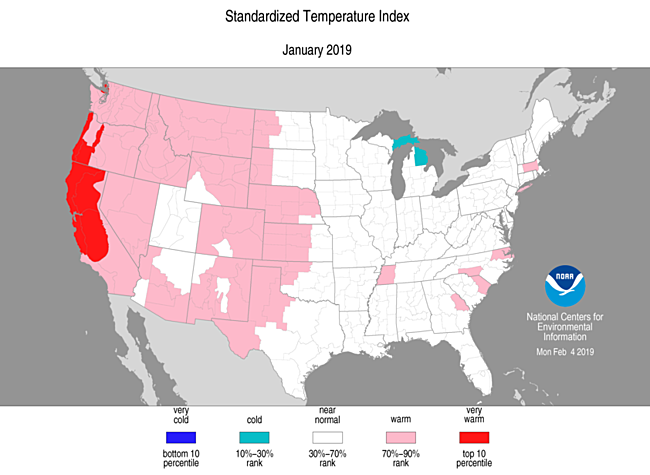
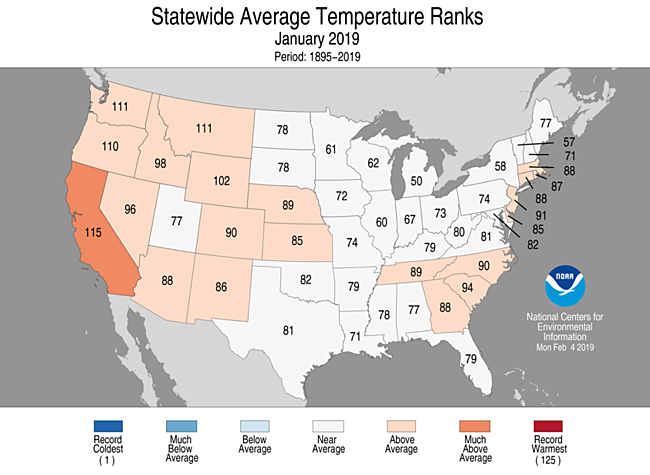
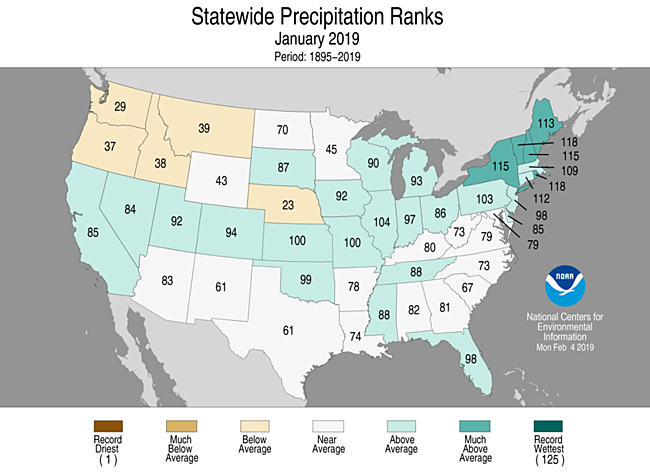
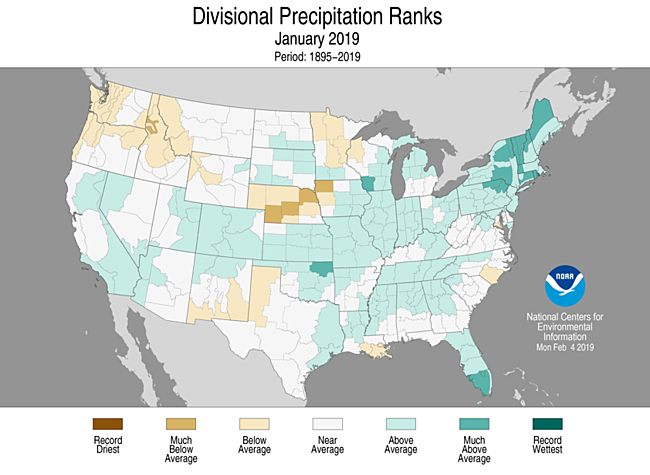
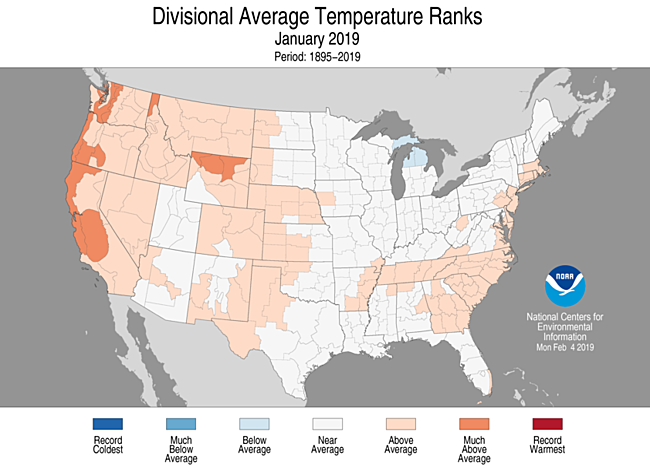
- While some parts of the country were very cold during some parts of the month, no state had a January average temperature in the cold third of the historical record. On the other hand, monthly temperatures averaged extremely warm along the West Coast, with California having the eleventh warmest January in the 1895-2019 historical record. On a statewide basis, Rhode Island and Vermont ranked in the top ten wettest category with a rank of eighth wettest, and New Hampshire and New York each had the eleventh wettest January. But the changing nature of the circulation and its effect on the migrating weather systems kept any other states from having extreme precipitation ranks.
- Temperatures averaged across the country gave the CONUS the 29th warmest January in the 1895-2019 record. The high population centers of the Midwest to Northeast were near to cooler than normal, while the high population centers of the Southeast and West were warmer than normal. This averaged out to a slightly below-average heating demand during this normally very cold time of year, with the national REDTI (Residential Energy Demand Temperature Index) value for January 2019 ranking as the 37th lowest January REDTI in the 125-year record.
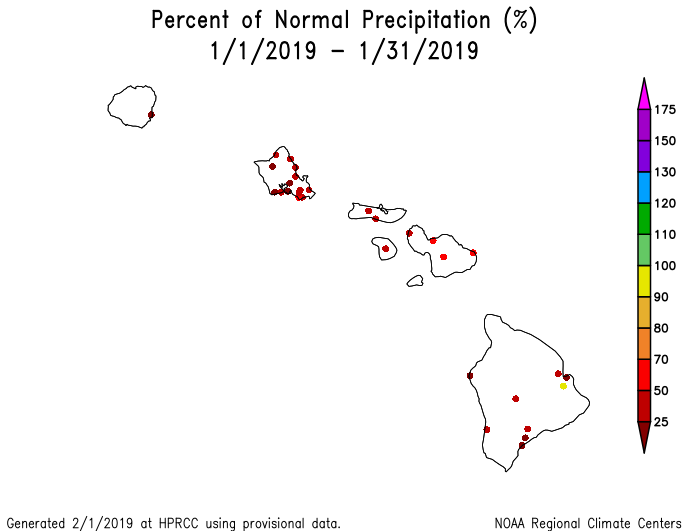
- Much of the precipitation during January fell on areas that were in drought or abnormally dry at the end of December, resulting in welcome drought improvement, especially in the West. Drought and abnormal dryness contracted across much of the West and southern Florida, and in parts of the Plains. Abnormal dryness and drought expanded in parts of the northern to central Rockies, southern Plains, and Puerto Rico, and especially across most of Hawaii where the month continued a dry trend. Contraction outweighed expansion this month, so at the national level drought contracted from 21.9 percent of the CONUS at the end of December to 16.5 percent of the CONUS at the end of January (from 18.7 percent to 14.3 percent for all of the U.S.).
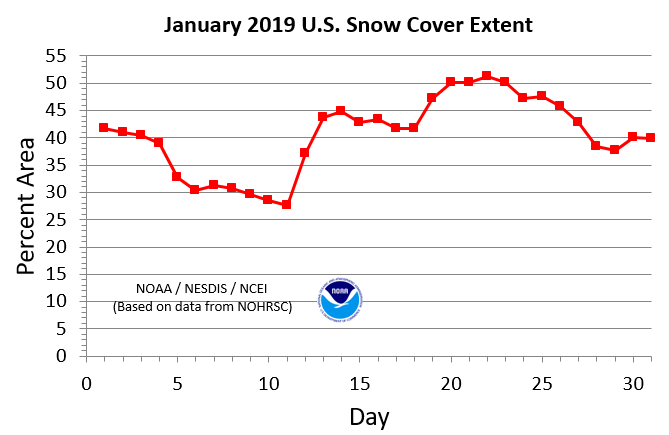
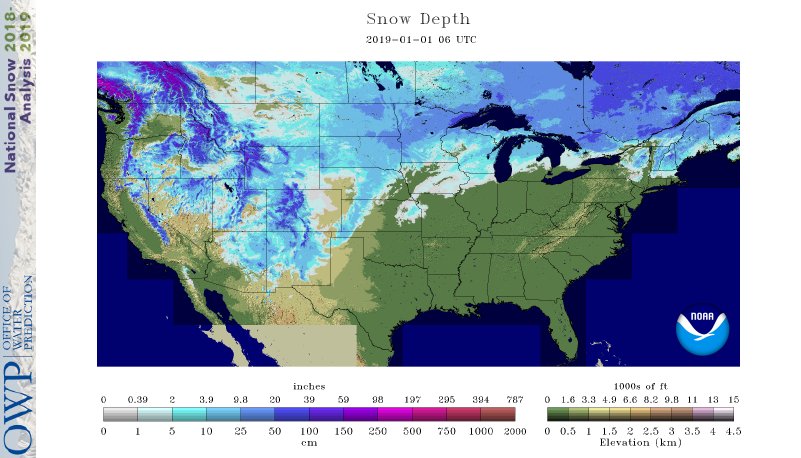
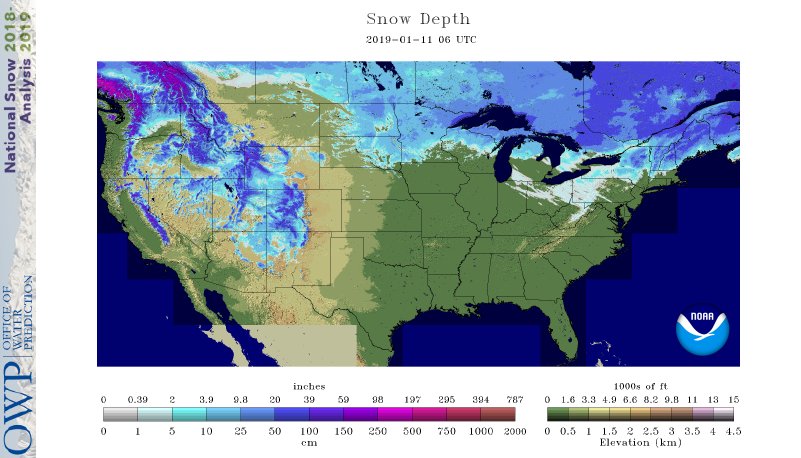
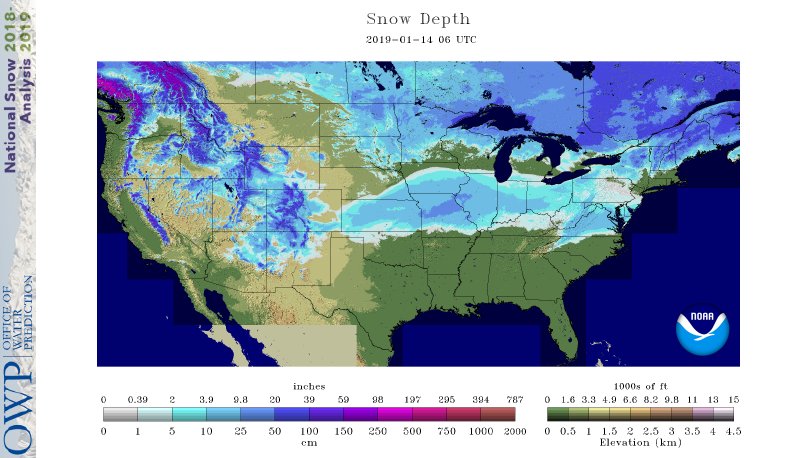
- January began with snow cover over the western mountains, northern and central Plains, Great Lakes, and New England. A westerly-flowing jet stream with its transient short-wave troughs tracked weather systems across the CONUS, and the warm air advection ahead of these systems helped erode the snow cover. The national snow cover area declined from about 41.8 percent on January 1st to 27.7 percent by January 11th. An upper-level low and trough generated a surface low over the southern Plains which pulled in enough below-freezing air to generate a snow field across the central Plains to Ohio Valley and Mid-Atlantic Coast on the 11th-13th. This expanded the snow cover to about 44.8 percent by January 14th. A couple more systems followed, expanding the snow cover to half (51.3%) of the CONUS by the 22nd. When the upper-level long-wave trough became established over the eastern CONUS during the last week of January, the persistent frigid air masses reduced melting of the snow cover, but its northerly flow also cut off much of the moisture supply, so the national snow cover area slowly decreased to about 40% of the CONUS by month's end. Based on satellite observations, the monthly snow coverage across the CONUS was 1.41 million sq. mi. (3.653 million sq. km.), 46 thousand sq. mi. (118 thousand sq. km.) above average, and ranked near the middle of 53-year record at 24th largest January snow cover area. Snow cover was above normal in parts of the West, northern Plains, Ohio, and Northeast, but below normal in other parts of the West, Plains, and East Coast.
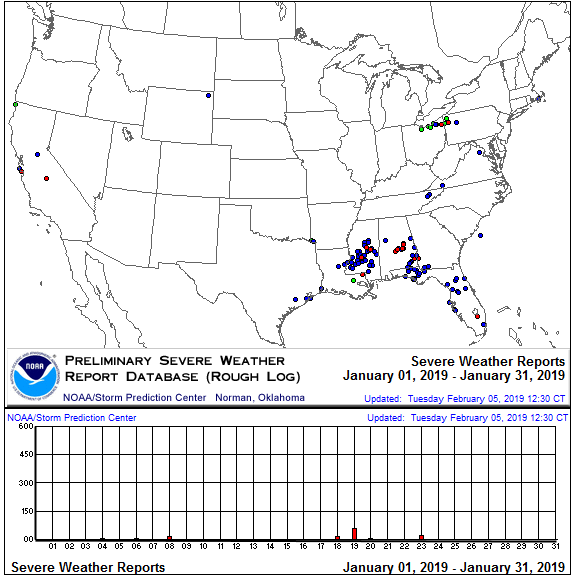
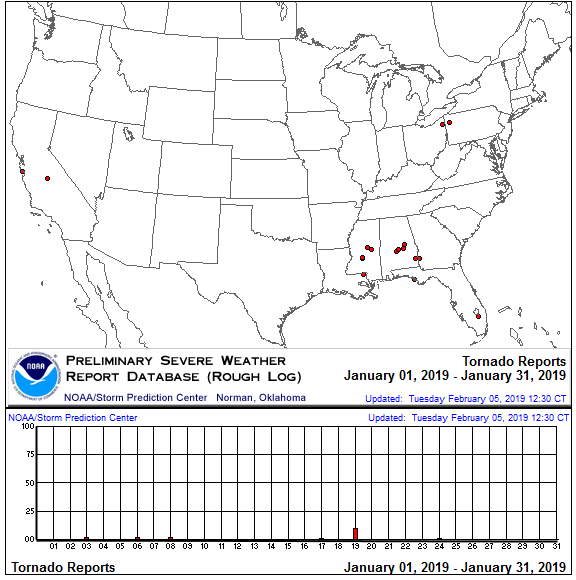
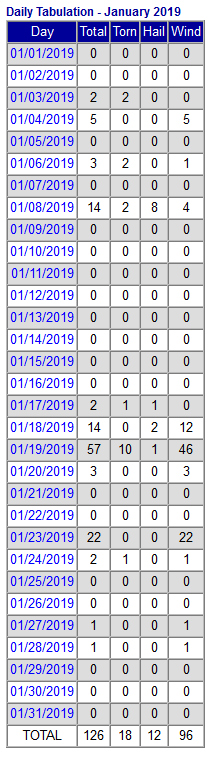
- The atmospheric circulation needed to create the instability and dynamics favorable for severe weather consists largely of a southwesterly flow across the central part of the CONUS, which funnels moist Gulf of Mexico air and its latent heat energy into the mix. Surface fronts provide additional atmospheric lifting. The changing direction of the circulation around surface lows and the upper-level troughs and lows above them adds spin to the rising air, which enhances the formation of tornadoes. While this upper-level circulation pattern, with its frontal systems and surface lows, occurred occasionally, the overall pattern this January inhibited severe weather more than it supported it. The number of tornadoes for January 2019 (18 based on preliminary data) was roughly half the January average of 35. A couple tornadoes occurred in California and a couple more near the Great Lakes. But the bulk of tornadoes occurred in the Southeast on the 19th when a deep upper-level trough moved over the region, generating an intense surface low and frontal system.
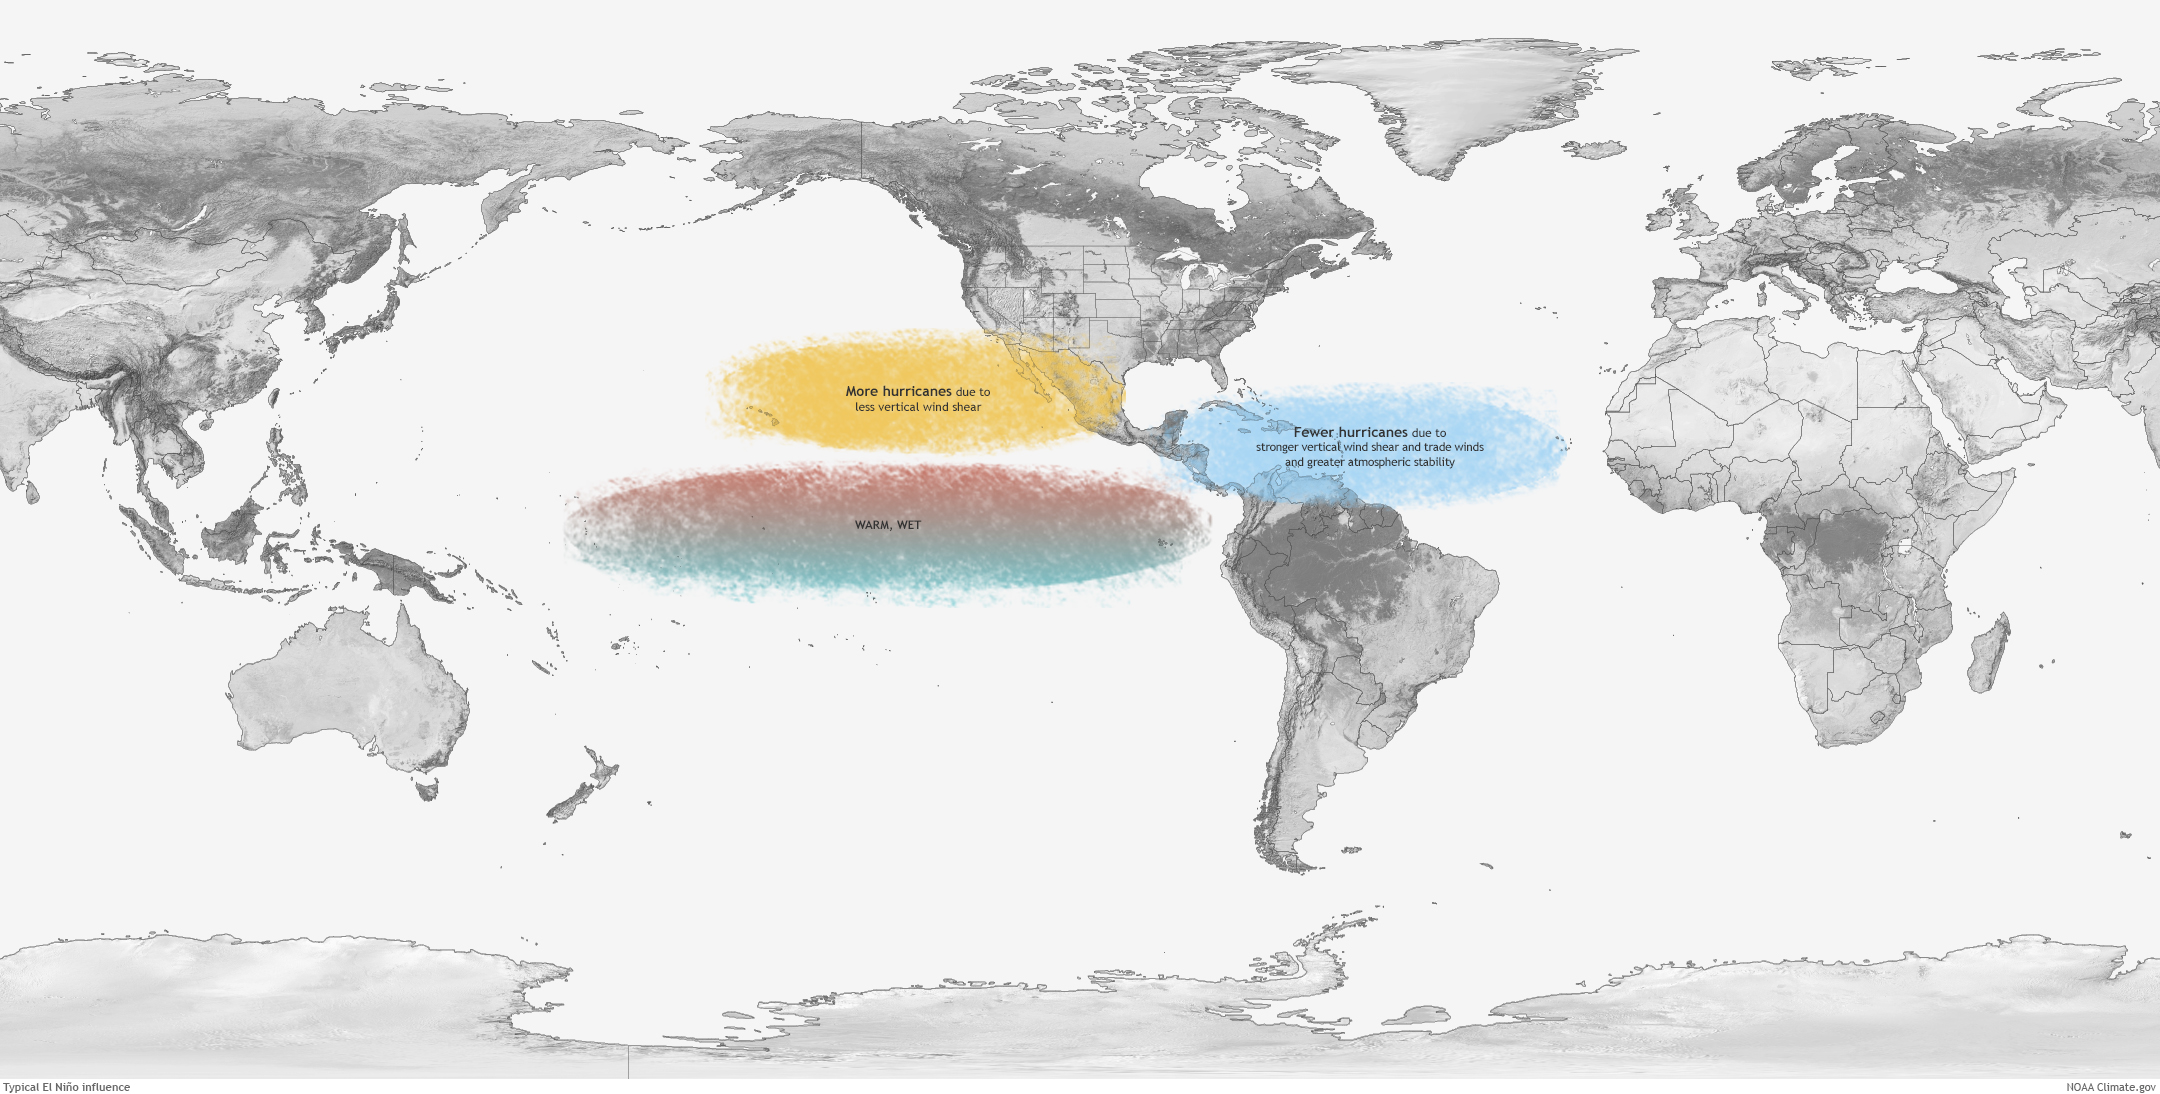
Typically tropical cyclone activity is enhanced in the Eastern North Pacific and inhibited in the North Atlantic during El Niños, and inhibited in the Eastern North Pacific and enhanced in the North Atlantic during La Niñas, due mostly to changes in vertical wind shear during the two extreme events. The relationship is unclear during ENSO-neutral events. Warm sea surface temperatures (SSTs) fuel tropical cyclones while vertical wind shear tears them apart. The tropical Pacific Ocean was in an ENSO-neutral state during January 2019.
- The Atlantic hurricane season runs from June 1st through November 30th and the Eastern North Pacific (ENP) hurricane season runs from May 15th through November 30th.
- No tropical systems developed in the North Atlantic, Eastern North Pacific, or Central North Pacific during January 2019.
- In the Western North Pacific, two tropical systems were active in January. Tropical Storm Pabuk developed early in the month from Tropical Depression 36W which formed near the end of December. Pabuk crossed into the Indian Ocean and dissipated soon after. Tropical Depression 01W formed early in January along the eastern periphery of the U.S.-Affiliated Pacific Islands (USAPI) (Micronesia). It never intensified beyond tropical depression strength, quickly weakening to a remnant disturbance after a few days. But the remnants of 01W moved slowly westward across the USAPI, dropping significant rainfall over southern parts of the region. The remnants of 01W had moved west of Micronesia by January 19th and dissipated a few days later in the vicinity of the Philippines.
 North America monthly upper-level circulation pattern and anomalies. The upper-level circulation pattern during January, when averaged for the month, consisted of above-normal height anomalies with ridging across the Pacific Northwest and west coast of Canada, and above-normal heights over Mexico. The height anomalies were near normal over the U.S. Southwest (reflecting frequent short-wave troughs passing through the western long-wave ridge) and central to eastern CONUS (where the troughs and ridges averaged each other out). The deep trough near the end of the month was reflected by below-normal heights over southeastern Canada. |
|
Map of monthly precipitation anomalies. A mixed precipitation anomaly pattern was evident across the U.S. in January. Monthly precipitation was below normal across parts of the West, Plains, western Great Lakes, and in a strip along the Gulf of Mexico Coast to Southeast Coast. January was wetter than normal across other parts of the West, and Plains, and much of the South, Midwest, Northeast, and southern Florida. Much of Alaska and Puerto Rico were drier than normal, but parts were wetter than normal. Hawaii was mostly drier than normal. |
|
Map of monthly temperature anomalies. A mixed temperature anomaly pattern was evident across the U.S. in January. Monthly temperatures were warmer than normal in the Far West, northern High Plains, Southeast, parts of the central Plains, and most of Alaska. Temperatures were below normal in the Southwest to central Rockies, Upper Midwest to New England, and parts of the southern Plains. |
Atmospheric Drivers
Subtropical highs, and fronts and low pressure systems moving in the mid-latitude storm track flow, are influenced by the broadscale atmospheric circulation. The circulation of the atmosphere can be analyzed and categorized into specific patterns. The Tropics, especially the equatorial Pacific Ocean, provides abundant heat energy which largely drives the world's atmospheric and oceanic circulation. The following describes several of these modes or patterns of the atmospheric circulation, their drivers, the temperature and precipitation patterns (or teleconnections) associated with them, and their index values this month:
-
El Niño Southern Oscillation (ENSO)
- Description: Oceanic and atmospheric conditions in the tropical Pacific Ocean can influence weather across the globe. ENSO is characterized by two extreme modes: El Niño (warmer-than-normal sea surface temperature [SST] anomalies in the tropical Pacific) and La Niña (cooler-than-normal SST anomalies), with the absence of either of these modes termed "ENSO-neutral" conditions.
- Status: The ocean and atmosphere system reflected an ENSO-neutral state during January 2019. SSTs were above average across the equatorial Pacific Ocean, suggesting El Niño conditions were imminent, but the atmosphere was not responding to the oceanic conditions, so officially ENSO-neutral conditions continued for now with El Niño conditions considered likely in the next few months. The anomalously warm SSTs resulted in an ONI (Oceanic Nino Index) value (0.7 for September-November 2018) that crossed the El Niño threshold (0.5), but the ONI needs to be above the threshold for at least 5 consecutive overlapping 3-month seasons for a full-fledged El Niño episode to be declared by CPC.
- Teleconnections (influence on weather): The NWS CPC has no teleconnections for ENSO-neutral conditions.
- Comparison to Observed: The January 2019 temperature and precipitation anomaly patterns do not match the teleconnections for El Niño or La Niña.
-
Madden-Julian Oscillation (MJO)
- Description: The MJO is a tropical disturbance or "wave" that propagates eastward around the global tropics with a cycle on the order of 30-60 days. It is characterized by regions of enhanced and suppressed tropical rainfall. One of its indices is a phase diagram which illustrates the phase (1-8) and amplitude of the MJO on a daily basis. The MJO is categorized into eight "phases" depending on the pattern of the location and intensity of the regions of enhanced and suppressed tropical rainfall. The MJO can enter periods of little or no activity, when it becomes neutral or incoherent and has little influence on the weather. Overall, the MJO tends to be most active during ENSO-neutral years, and is often absent during moderate-to-strong El Niño and La Niña episodes.
- Status: The MJO Wheeler-Hendon index indicated that the MJO transitioned rapidly through phases 6-8, became neutral briefly, and spent the last half of the month moving through phases 4-6. Other aspects of the tropical ocean-atmosphere system (referred to in the CPC reports as the background or low frequency [e.g., La Niña or El Niño] state, Kelvin and Rossby waves, and tropical cyclone activity) also appeared to play a role in influencing the month's climate (especially Rossby waves, Kelvin waves, and tropical cyclone activity) (MJO updates for January 7, 14, 21, 28, and February 4).
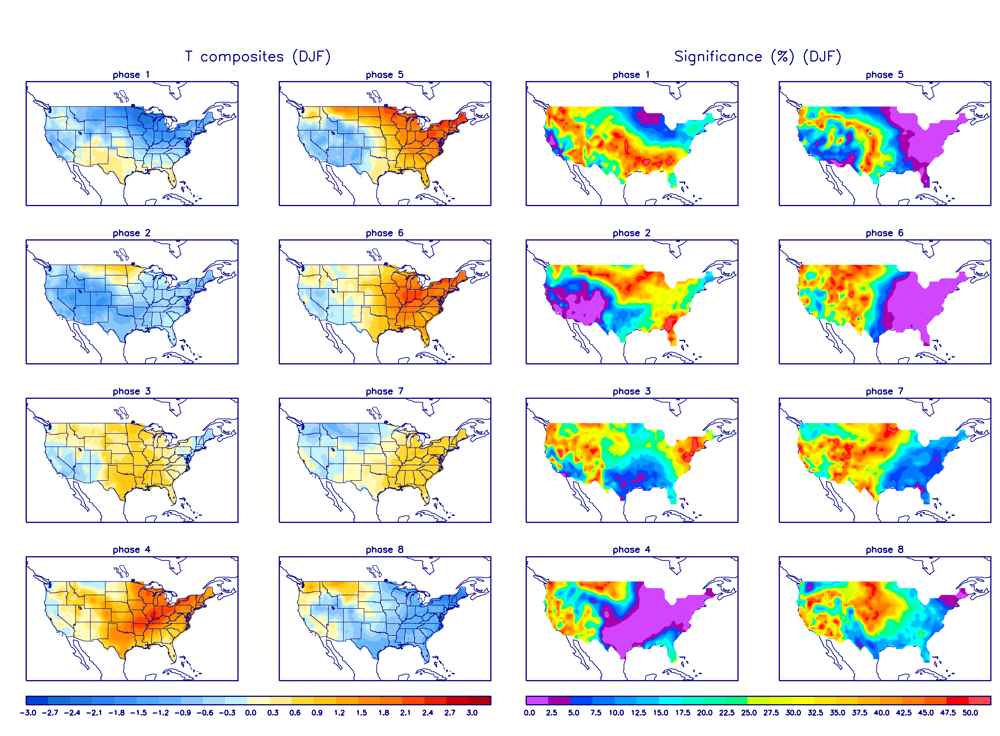
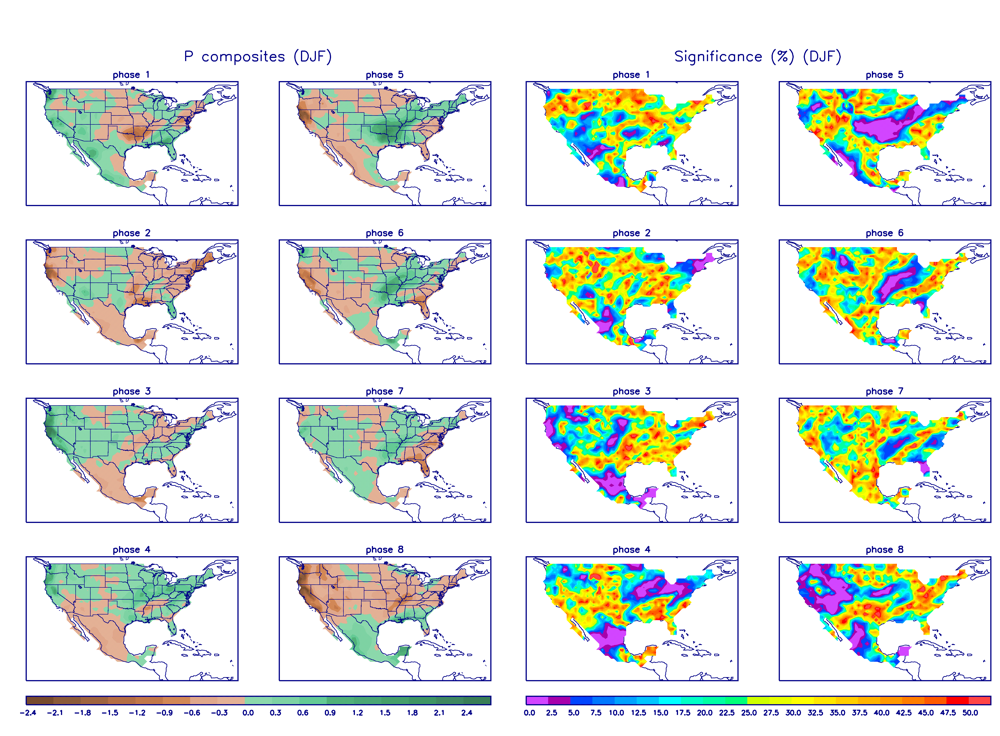
- Teleconnections (influence on weather): The MJO's temperature and precipitation teleconnections to U.S. weather depend on time of year and MJO phase; there is also a lagged component associated with the teleconnections. To the extent teleconnections are known, the January (December-February) teleconnections for temperature are shown here and for precipitation are shown here.
- Comparison to Observed: The MJO is transitory and can change phases (modes) within a month, so it is usually more closely related to weekly weather patterns than monthly. In the case of January 2019, the MJO spent three days in phase 6, one day in phase 7, about seven days in phase 8 (January 5-11), then three days in phase 4, three days in phase 5, and six days in phase 6 (January 24-29), before ending the month in phase 7. The monthly temperature anomaly pattern does not match the teleconnections for these phases. The weekly temperature anomaly patterns don't match the corresponding phase teleconnections (January 4-10 temperature anomaly vs. phase 8, and January 25-31 temperature anomaly vs. phase 6) (in fact, they are opposite). The monthly precipitation anomaly pattern does not match the teleconnections for these phases. The weekly precipitation anomaly patterns don't match the corresponding phase teleconnections (January 4-10 precipitation anomaly vs. phase 8, and January 25-31 precipitation anomaly vs. phase 6).
- The Pacific/North American (PNA) pattern
- Description: The PNA teleconnection pattern is associated with strong fluctuations in the strength and location of the East Asian jet stream. PNA-related blocking of the jet stream flow in the Pacific can affect weather downstream over North America, especially the West and especially in the winter half of the year.
- Status: The daily PNA index was positive for most of the month, and averaged positive for the month as a whole.
- Teleconnections (influence on weather): To the extent teleconnections are known, a positive PNA for this time of year (January on the quarterly teleconnection maps) has below-normal upper-level circulation anomalies over the northern North Pacific and the southeast U.S., and above-normal circulation anomalies over western North America; is associated with warm temperature anomalies over Alaska, western Canada, Montana, and the U.S. West Coast, and cold temperature anomalies over Texas to the Southeast and Northeast; and is associated with below-normal precipitation in the Pacific Northwest to central Rockies and much of the CONUS along and east of the Mississippi River (except the Gulf of Mexico coast).
- Comparison to Observed: The January 2019 monthly upper-level circulation anomaly pattern agrees with the teleconnections for a positive PNA over the North Pacific and western North America, and the weekly circulation anomaly pattern for January 25-31 is a reasonable match over North America. The monthly temperature anomaly pattern does not match the teleconnections, but the weekly temperature anomaly pattern for January 11-17 is a reasonable match over the CONUS. The monthly precipitation anomaly pattern does not agree with the teleconnections for a positive PNA, but the weekly precipitation anomaly pattern for January 25-31 mostly agrees.
- The Arctic Oscillation (AO) pattern
- Description: The AO teleconnection pattern relates upper-level circulation over the Arctic to circulation features over the Northern Hemisphere mid-latitudes and is most active during the cold season.
- Status: The daily AO index oscillated between zero and negative the first half of the month, spent most of the second half negative, and averaged negative for the month. The 3-month-averaged index was slightly negative.
- Teleconnections (influence on weather): To the extent teleconnections are known, a negative AO in January (December-February in the AO Quarterly Composites table) is typically associated with above-normal upper-level circulation anomalies over the Arctic Ocean and Greenland into northern Alaska and the northern North Atlantic; below-normal upper-level circulation anomalies over the eastern half of the CONUS, across the North Atlantic extending into Europe, and over parts of the North Pacific; below-normal temperatures across the northern to central Plains and from the Mississippi River to East Coast; near-normal temperatures elsewhere in the CONUS; wetter-than-normal conditions in northern California; and drier-than-normal conditions in southern California to Arizona and from the southern Plains to Ohio Valley.
- Comparison to Observed: The January 2019 monthly upper-level circulation, temperature, and precipitation anomaly patterns do not match the teleconnections for a negative AO. Most of the weeks don't match, either, except the January 25-31 weekly temperature anomaly pattern is a very good match and the January 25-31 weekly precipitation pattern is a reasonable match.
- The North Atlantic Oscillation (NAO) pattern
- Description: The NAO teleconnection pattern relates upper-level circulation over the North Atlantic Ocean to circulation features over the Northern Hemisphere mid-latitudes.
- Status: The daily NAO index was near zero to positive for most of the month, and averaged positive for the month. The 3-month-averaged index was strongly positive.
- Teleconnections (influence on weather): To the extent teleconnections are known, a positive NAO during this time of year (January on the quarterly teleconnection maps) is associated with above-normal upper-level circulation anomalies across the CONUS from the Rockies to East Coast, across the Atlantic, to Europe; below-normal circulation anomalies over northern Canada to Greenland; above-normal temperatures across the southern Plains to Southeast, and northern Plains to Northeast; and below-normal precipitation in the Far West, but there are few precipitation teleconnections.
- Comparison to Observed: The January 2019 monthly upper-level circulation anomaly pattern does not match the teleconnections for a positive NAO. The January 4-10 weekly circulation anomaly pattern matches across the eastern CONUS, but this may be a coincidence since it shows strong negative anomalies over other parts of North America which aren't in the teleconnections. The monthly temperature anomaly pattern agrees in the Southeast but not elsewhere. The January 4-10 weekly temperature anomaly pattern agrees but may be a coincidence since the daily PNA index is near neutral to only weakly positive. The monthly temperature and precipitation anomaly patterns and weekly patterns mostly disagree where the few teleconnections exist.
- The West Pacific (WP) pattern
- Description: The WP teleconnection pattern is a primary mode of low-frequency variability over the North Pacific and reflects zonal and meridional variations in the location and intensity of the (East Asian) jet stream in the western Pacific.
- Status: The monthly WP index was positive.
- Teleconnections (influence on weather): To the extent teleconnections are known, a positive WP during this time of year (January on the quarterly teleconnection maps) is typically associated with below-normal circulation anomalies over the western CONUS and eastern Siberia; above-normal circulation anomalies over the eastern CONUS and southeast Canada; below-normal temperatures over California and Nevada; above-normal temperatures over the Mid- to Upper Mississippi Valley, Great Lakes, Northeast, and southeast Canada; and above-normal precipitation from Oklahoma to the Ohio Valley.
- Comparison to Observed: The January 2019 monthly upper-level circulation and temperature anomaly patterns do not match the teleconnections for a positive WP, but the monthly precipitation anomaly pattern matches where the teconnections exist. On a weekly basis, the January 4-10 weekly circulation anomaly pattern is a good match over the CONUS and the January 11-17 weekly circulation anomaly pattern is a reasonable match, although distorted over Canada. The January 4-10 weekly temperature anomaly pattern has some similarities in the CONUS.
- The Tropical/Northern Hemisphere (TNH) pattern
- Description: The TNH teleconnection pattern reflects large-scale changes in both the location and eastward extent of the Pacific jet stream, and also in the strength and position of the climatological mean Hudson Bay Low, and is dominant in the winter months. The pattern significantly modulates the flow of marine air into North America, as well as the southward transport of cold Canadian air into the north-central United States.
- Status: The TNH index was positive during January.
- Teleconnections (influence on weather): To the extent teleconnections are known, a positive TNH is typically associated with colder-than-normal temperatures for much of the country as well as eastern Canada, drier-than-normal conditions in the West, and slightly wetter-than-normal conditions in the Tennessee Valley. The upper-level circulation anomalies for a positive TNH are below-normal 500-mb geopotential heights over the eastern two-thirds of Canada and the north central U.S., and above-normal heights over the northeastern Pacific and Gulf of Mexico into the western North Atlantic.
- Observed: The January 2019 monthly upper-level circulation anomaly pattern shows some agreement with the teleconnections for a positive TNH, but it is a bit shifted. There is a better match for the transient circulation pattern of January 18-24. The weekly and monthly temperature anomaly patterns have too much disagreement with the teleconnections. The monthly precipitation anomaly pattern agrees in the East but not in the West, and the weekly patterns don't match.
- The East Pacific-North Pacific (EP-NP) pattern
- Description: The EP-NP teleconnection pattern relates SST and upper-level circulation patterns (geopotential height anomalies) over the eastern and northern Pacific to temperature, precipitation, and circulation anomalies downstream over North America. Its influence during the winter is not as strong as during the other three seasons.
- Status: The January 2019 monthly EP-NP index was positive.
- Teleconnections (influence on weather): To the extent teleconnections are known, a positive EP-NP index this time of year (April or October on the quarterly teleconnection maps) is typically associated with below-normal upper-level circulation anomalies over eastern Canada extending into the eastern CONUS, and over the North Pacific; above-normal upper-level circulation anomalies across Alaska and the Canadian West Coast, and from the Caribbean into the North Atlantic; warmer-than-normal temperatures across Alaska and the U.S. West Coast; and below-normal temperatures across eastern Canada and the CONUS east of the Rockies (except for the Southeast). There are too few precipitation teleconnections to compare.
- Comparison to Observed: The January 2019 monthly upper-level circulation anomaly pattern is a good match for the teleconnections associated with a positive EP-NP, as is the upper-level circulation anomaly pattern for the last half of the month (January 18-31). The monthly temperature anomaly pattern shows little agreement, but the last two weeks (January 18-24 and January 25-31) are a good match. There are too few teleconnections to compare the monthly precipitation anomaly pattern to.
| Week | Circulation | Temperature | Precipitation |
| January 4-10 | WP | NAO, WP |
— |
| January 11-17 | WP | PNA | — |
| January 18-24 | TNH, EP-NP |
EP-NP | — |
| January 25-31 | PNA, EP-NP |
AO, EP-NP |
PNA, AO |
Examination of the available circulation indices and their teleconnection patterns, and comparison to observed January 2019 weekly and monthly temperature, precipitation, and circulation anomaly patterns, suggests the atmospheric drivers behind the Pacific teleconnection patterns (PNA, WP, EP-NP) had the greatest influence on this month's weather, but other drivers may have been influential, including tropical cyclones. The equatorial Pacific was in an ENSO-neutral state and did not have an influence, and the influence of the MJO was muted. The EP-NP had the best overall agreement, both monthly (for circulation) and especially during the last half of the month (for circulation and temperature), followed closely by the PNA. Other drivers may have exerted some influence at various times of the month. For example, NAO and WP during week 1, WP during week 2, PNA during weeks 2 and 4, TNH during week 3, and AO during week 4.
This month illustrates how the atmospheric circulation for the month can reflect the influence of atmospheric drivers (or modes of atmospheric variability) originating in the North Pacific, with a moderating influence of drivers originating in the North Atlantic and Arctic.