Note: This Synoptic Discussion describes recent weather events and climate anomalies in relation to the phenomena that cause the weather. These phenomena include the jet stream, fronts and low pressure systems that bring precipitation, high pressure systems that bring dry weather, and the mechanisms which control these features — such as El Niño, La Niña, and other oceanic and atmospheric drivers (PNA, NAO, AO, and others). The report may contain more technical language than other components of the State of the Climate series.
Summary
The Earth's ocean-atmosphere system was experiencing a weak El Niño during April 2019. The upper-level circulation was quite active this month, with the long-wave pattern shifting from a long-wave trough to a long-wave ridge back and forth. Two storm tracks were evident — short-wave troughs migrated through the jet stream flow along the U.S.-Canadian border, while troughs and upper-level closed lows tracked across the Southwest and southern Plains then northeast toward the Great Lakes. The upper-level troughs and their associated fronts and surface lows brought rain and snow along their paths, with above-normal precipitation especially notable in the Pacific Northwest and Deep South. In between these storm tracks, precipitation was below normal across much of California to Arizona and in the central Plains. The troughs and closed lows, and their surface fronts and lows, triggered outbreaks of severe weather from the Plains to East Coast, with the preliminary tornado count for April well above average. Some of the air masses were below freezing in the northern CONUS, which helped create an expansion of snow cover there at mid-month, but seasonal increases in sunshine and temperatures contributed to an otherwise steadily decreasing snow cover area as the month progressed. The frequent long-wave ridging, and protrusion of the North Atlantic High into the eastern CONUS, brought warmer-than-normal temperatures. But troughing in the north, and cloudiness and rain associated with the southern closed lows and their surface systems, squeezed the warm anomalies in the north and south, resulting in a monthly temperature anomaly pattern that was warmer than normal in the east and west, and near to colder than normal in the north and south. The precipitation this month gave the CONUS the twelfth wettest April in the 125-year historical record, and much of the precipitation fell on drought areas, contracting the national drought footprint to about 2.6 percent of the U.S. The upper-level circulation, temperature, and precipitation anomaly patterns suggest that the weather during March reflected the combined influence of atmospheric drivers originating in the North Pacific Ocean, Arctic, and North Atlantic Ocean. See below for details.
Synoptic Discussion
 Animation of daily upper-level circulation for the month.
|
 Animation of daily surface fronts and pressure systems for the month.
|
In the Northern Hemisphere, April marks the middle of climatological spring which is the time of year when solar heating increases with the rising sun angle, arctic air masses are not as cold, the mid-latitude circulation in the Northern Hemisphere begins to slow down, and a contracting circumpolar vortex forces the jet stream northward. Polar air masses influence the weather over the contiguous U.S. (CONUS) less, and the warm, dry subtropical high pressure belts influence the weather more.
 500-mb mean circulation for North America for April 1-3, 2019.
|
 500-mb mean circulation for North America for April 4-10, 2019.
|
 500-mb mean circulation for North America for April 11-17, 2019.
|
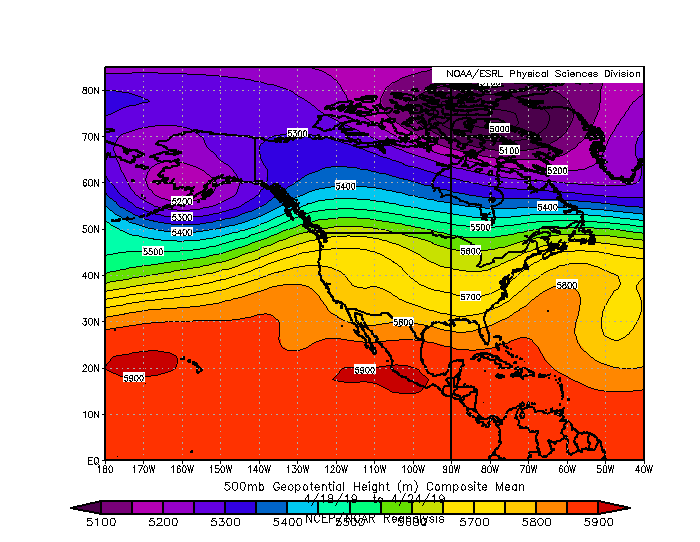 500-mb mean circulation for North America for April 18-24, 2019.
|
 500-mb mean circulation for North America for April 25-30, 2019.
|
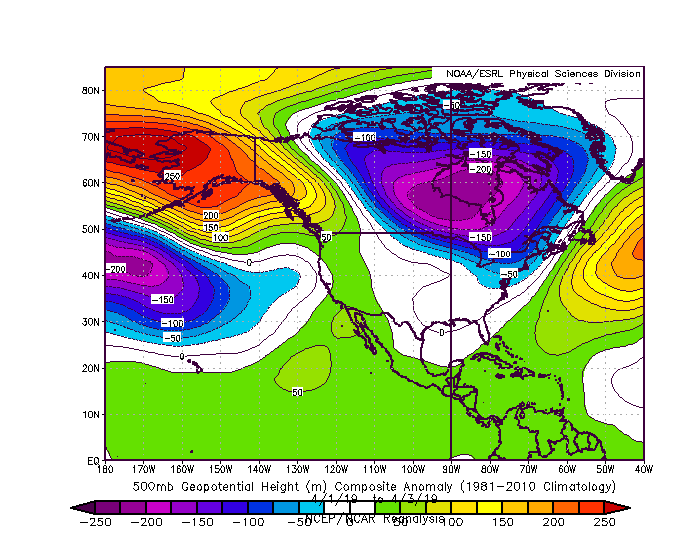 500-mb circulation anomalies for North America for April 1-3, 2019.
|
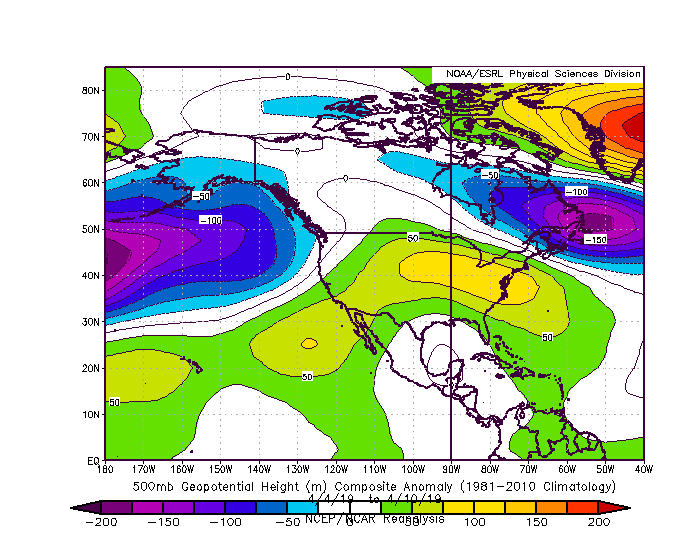 500-mb circulation anomalies for North America for April 4-10, 2019.
|
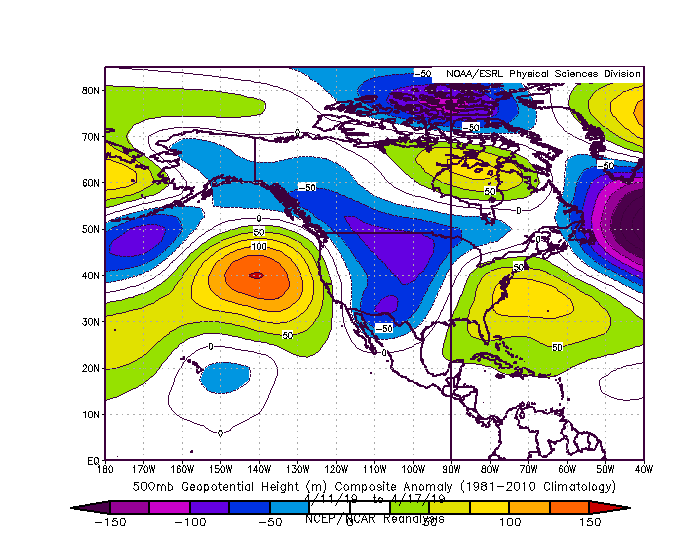 500-mb circulation anomalies for North America for April 11-17, 2019.
|
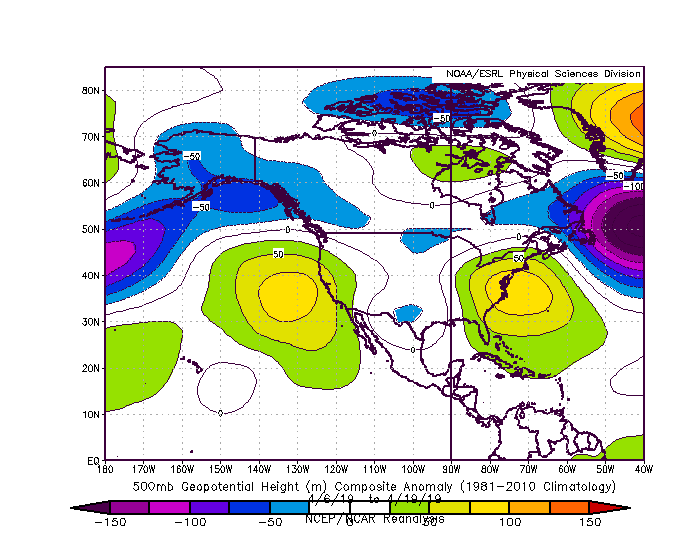
 500-mb circulation anomalies for North America for April 18-24, 2019.
|
 500-mb circulation anomalies for North America for April 25-30, 2019.
|
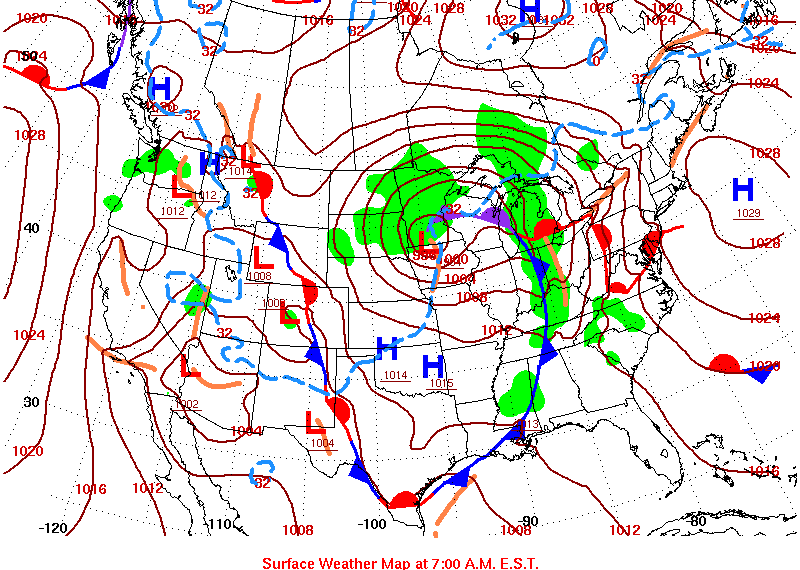
During April 2019, the circumpolar vortex and main storm track did contract northward, but the circulation remained vigorous with a strong meridional component. The meridional component was characterized by several deep troughs and closed lows that moved across the CONUS, especially across the southern states. These two features — the seasonal contraction and continued vigorous meridional component — opposed each other in the monthly aggregate. The long-wave pattern shifted back and forth in a complex interaction between the broad atmospheric drivers and the local influence of short-term weather systems. There are many ways the long-wave pattern can be sectionalized throughout the month. The following discussion breaks the pattern into five sections or time periods:
500-mb mean circulation for North America for April 1-3, 2019.
|
500-mb circulation anomalies for North America for April 1-3, 2019.
|
 Temperature anomalies (departure from normal) for the CONUS for April 1-3, 2019.
|
 Precipitation anomalies (percent of normal) for the CONUS for April 1-3, 2019.
|
April 1-3: The month began with a long-wave trough over eastern North America and ridge over western North America. A storm system was moving up the U.S. East Coast with another one from the Pacific undercutting the western ridge.
500-mb mean circulation for North America for April 4-10, 2019.
|
500-mb circulation anomalies for North America for April 4-10, 2019.
|
 Temperature anomalies (departure from normal) for the CONUS for April 4-10, 2019.
|
 Precipitation anomalies (percent of normal) for the CONUS for April 4-10, 2019.
|
April 4-10: A generally westerly flow characterized the following week. Short-wave troughs migrated through the flow with their accompanying surface lows and fronts. Some brought Pacific moisture to the Pacific Northwest and northern Rockies, while others pulled in Gulf of Mexico moisture to give the southern Plains to Southeast a wetter-than-normal week. One of the systems spawned a tornado outbreak in the South on April 7th. The contracted circumpolar vortex and ridging across the central CONUS resulted in above-normal temperatures across most of the country during this period. A deep trough began moving into the West at the end of this period, with the southerly flow of warm air ahead of it contributing to the above-normal temperatures in the Plains.
500-mb mean circulation for North America for April 11-17, 2019.
|
500-mb circulation anomalies for North America for April 11-17, 2019.
|
 Temperature anomalies (departure from normal) for the CONUS for April 11-17, 2019.
|
 Precipitation anomalies (percent of normal) for the CONUS for April 11-17, 2019.
|
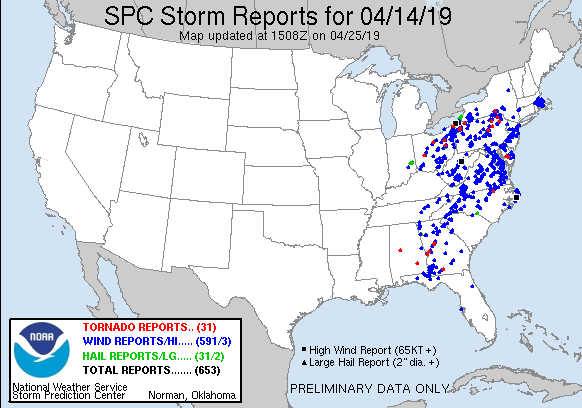
April 11-17: The circulation pattern became extremely meridional during April 11-17 with several strong deep troughs and closed lows moving across the CONUS. They plunged into the Southwest, then tracked across the Plains toward the Great Lakes and eastern Canada. These were powerful storm systems, with their fronts and northerly flow pulling in Canadian air, their surface lows drawing Gulf of Mexico moisture northward, and their dynamics generating rounds of severe weather in the South and East (severe weather maps for April 13th, 14th, 17th). Pacific moisture contributed to above-normal precipitation across parts of the West, while Gulf of Mexico and Atlantic moisture fed above-normal precipitation in many areas from the Plains to East Coast. The combination of moisture and below-freezing Canadian air resulted in a deep snow cover across the central Plains to western Great Lakes. The Canadian air masses, clouds, and snow kept temperatures below normal for this period across much of the country. Upper-level ridging and a southerly flow ahead of the strong surface lows kept the East warmer than normal for the week.
500-mb mean circulation for North America for April 18-24, 2019.
|
500-mb circulation anomalies for North America for April 18-24, 2019.
|
 Temperature anomalies (departure from normal) for the CONUS for April 18-24, 2019.
|
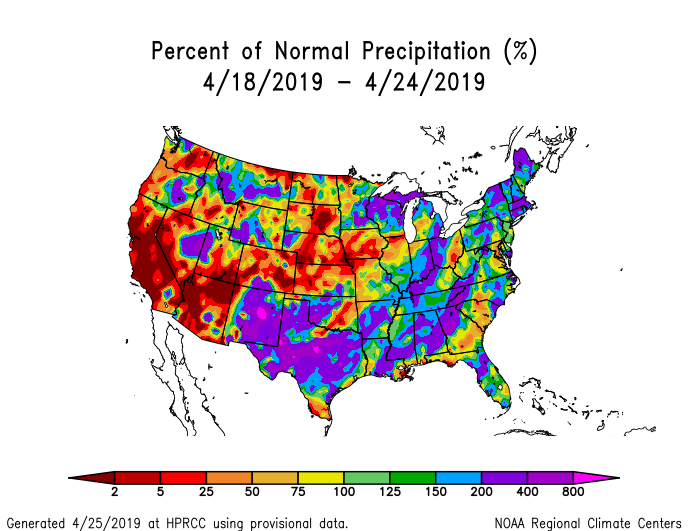 Precipitation anomalies (percent of normal) for the CONUS for April 18-24, 2019.
|
April 18-24: April 18-24 was dominated by two slow-moving closed lows, one which lingered over the eastern CONUS and another which moseyed onto the Southwest. These systems and their surface lows and fronts spread Gulf of Mexico moisture across the southern Plains to Midwest and parts of the East Coast. Their dynamics also triggered rounds of severe weather, with about a hundred tornadoes spawned from the Plains to East Coast at the beginning of the period (severe weather maps for April 17th, 18th, 19th, 24th). Some of the Pacific fronts gave parts of the West above-normal precipitation for the week, but with most of the action in the South and East, much of the West to central and northern Plains was drier than normal. The clouds and rain associated with the eastern low kept temperatures below normal along the Gulf Coast states to Southeast, but ridging in the West and Northeast, along with the seasonal contraction of the circumpolar vortex, gave much of the rest of the country warmer-than-normal temperatures for this period.
500-mb mean circulation for North America for April 25-30, 2019.
|
500-mb circulation anomalies for North America for April 25-30, 2019.
|
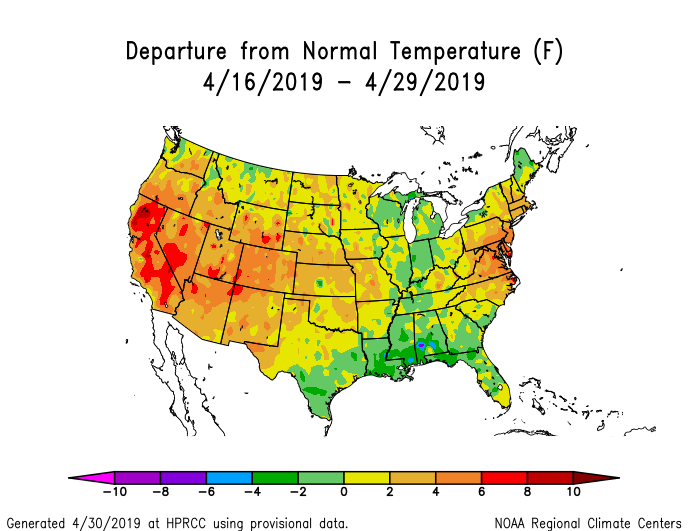
 Temperature anomalies (departure from normal) for the CONUS for April 23-29, 2019.
|
 Precipitation anomalies (percent of normal) for the CONUS for April 23-29, 2019.
|
April 25-30: In the waning days of the month, closed lows and troughs, with their surface lows and fronts, traversed the CONUS in the westerly flow, spreading above-normal precipitation across parts of the South, northern Plains, Midwest, and Northeast. Some triggered severe weather, especially on the 30th in the southern Plains. By the end of the month, the circulation pattern shifted into a long-wave trough which deepened over Canada and sagged a bit into the northern states. This contributed to below-normal temperatures across the northern CONUS. It also forced an upper-level ridge to develop over the Pacific Ocean which created a northerly flow across western North America, and this contributed to a drier-than-normal period over the West. The lack of deep troughing over California to the Four Corners States during much of this period helped keep temperatures warmer than normal in this region.
 500-mb mean circulation for North America for April 6-19, 2019.
|
 500-mb circulation anomalies for North America for April 6-19, 2019.
|
 Temperature anomalies (departure from normal) for the CONUS for April 6-19, 2019.
|
 500-mb mean circulation for North America for April 16-29, 2019.
|
 500-mb circulation anomalies for North America for April 16-29, 2019.
|
 Temperature anomalies (departure from normal) for the CONUS for April 16-29, 2019.
|
Two-week slices: If the atmospheric circulation and temperature anomaly fields are sliced into 2-week periods, an interesting east-west pattern can be seen. The preference of short-wave troughs and closed lows to deepen over the Southwest then move across the Plains towards the Great Lakes, beginning on April 10 and lasting through about April 27, resulted in a circulation anomaly field with above-normal heights (or ridging) along or just off the West and East Coasts with near-normal heights over the interior CONUS, for both April 6-19 and April 16-29. Ridging with above-normal temperatures dominated the East Coast during April 6-19, while they dominated the West Coast during April 16-29. This shows up in the monthly field as well.
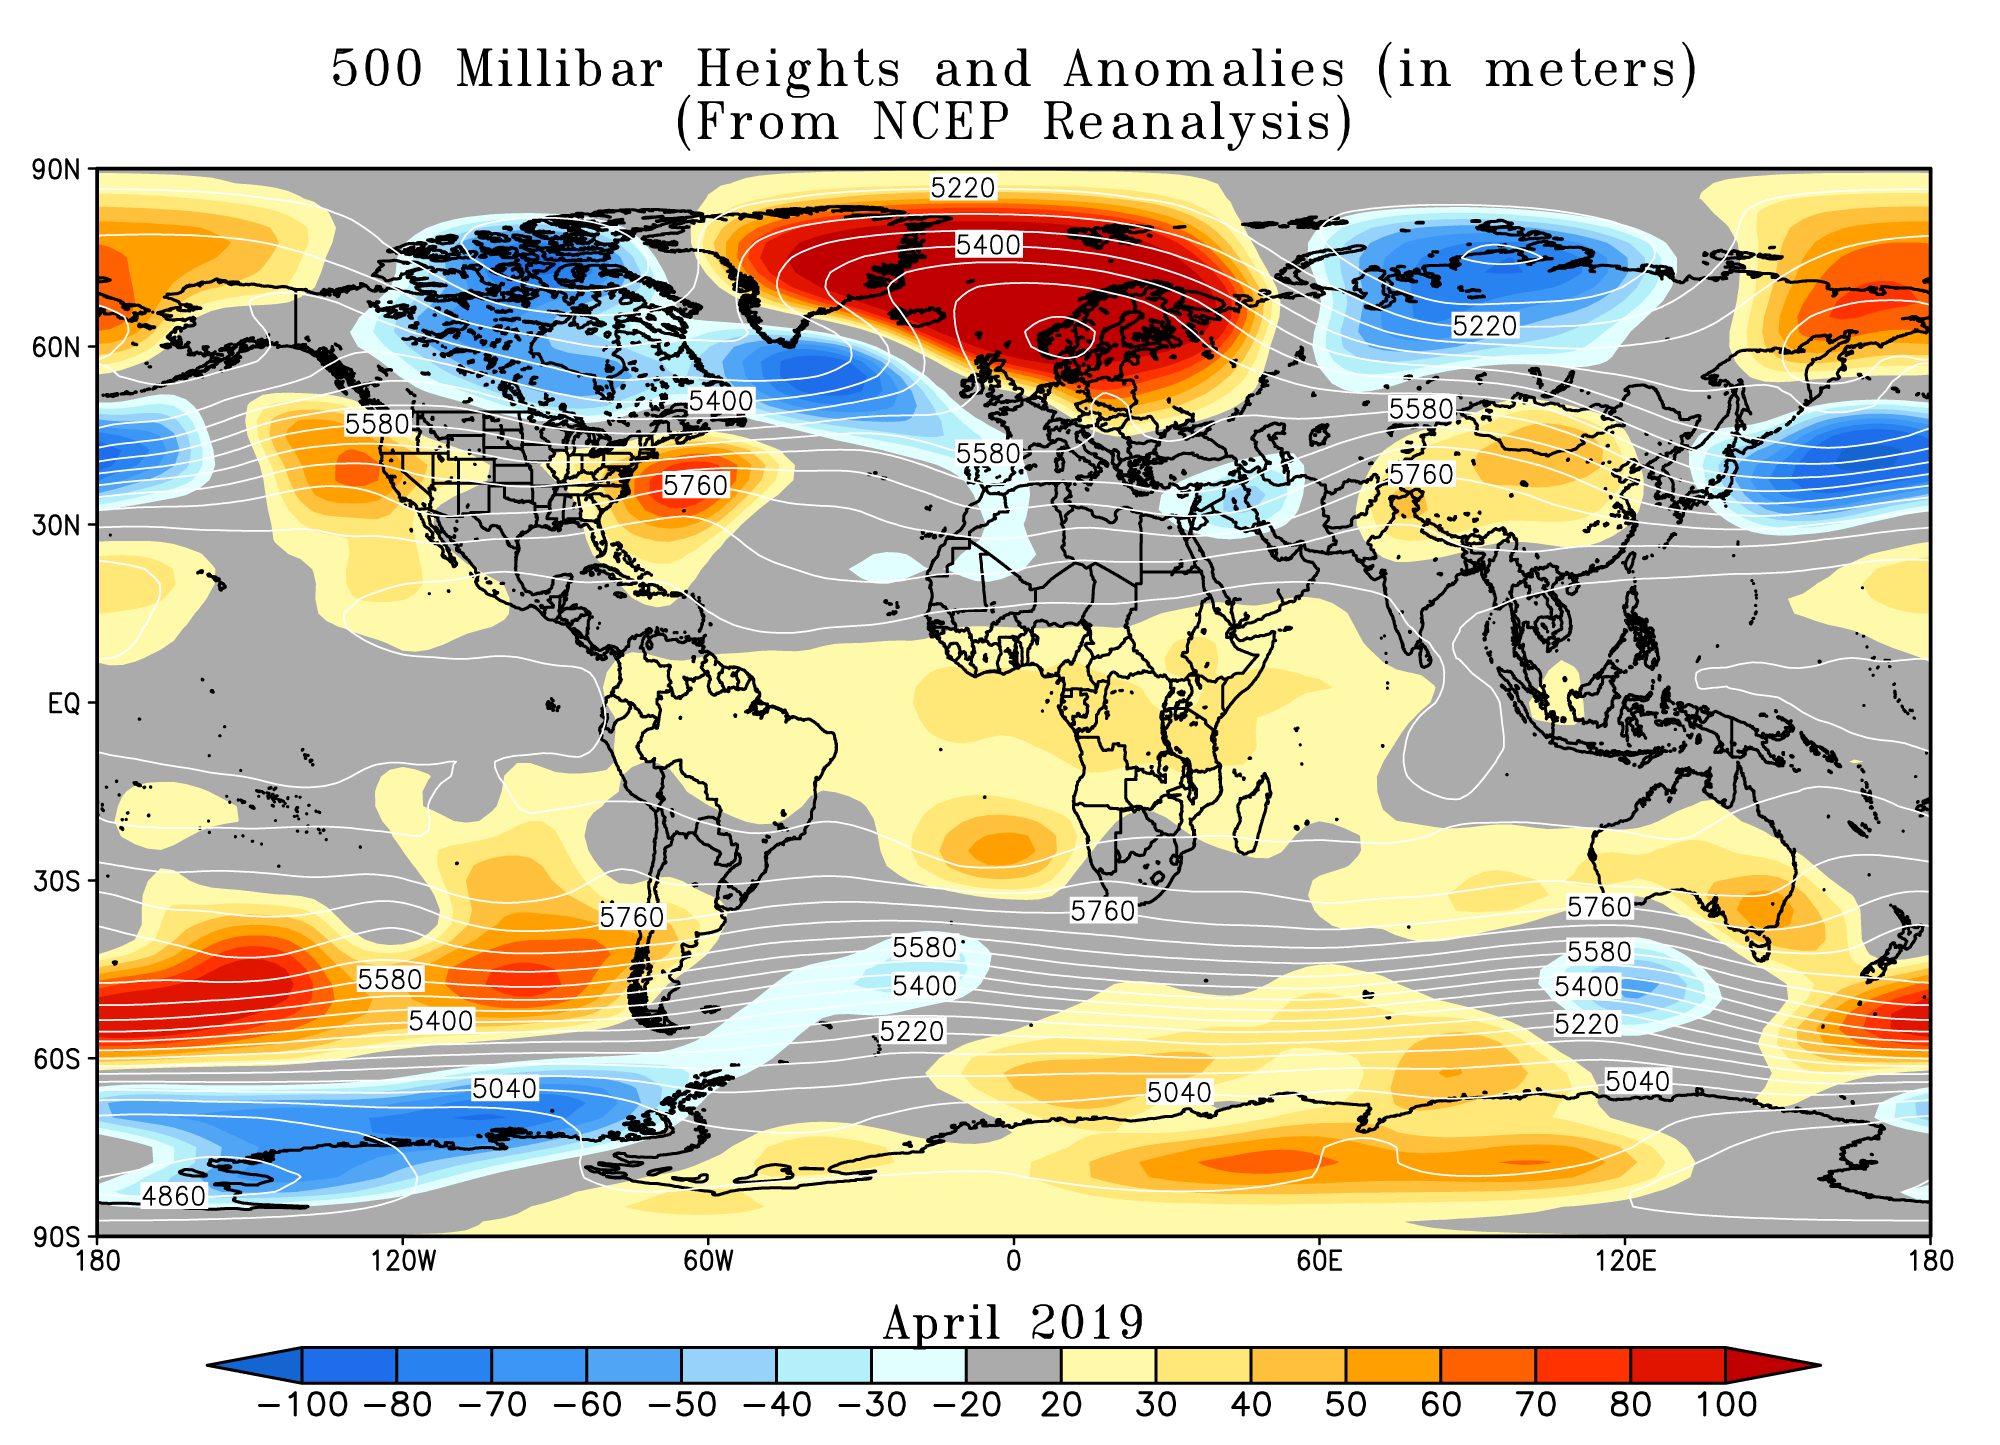
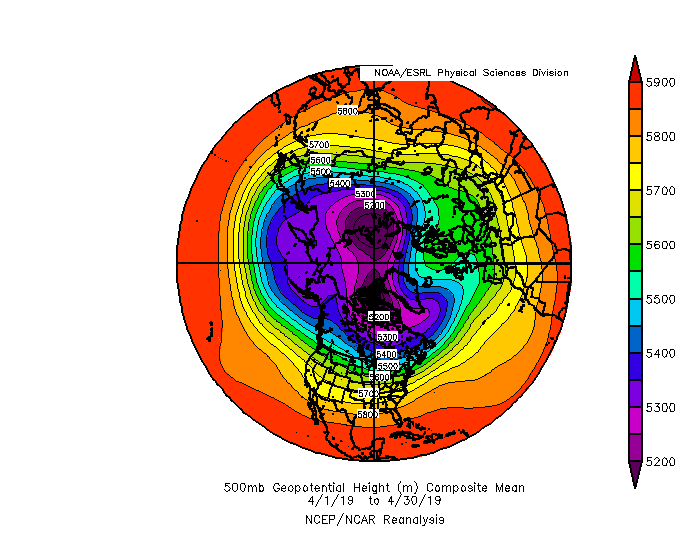
 500-mb mean circulation for North America for April 2019.
|
 500-mb circulation anomalies for North America for April 2019.
|
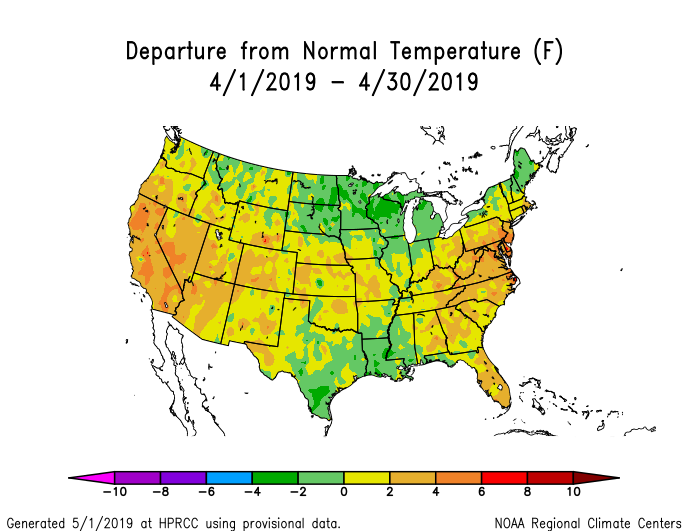 Temperature anomalies (departure from normal) for the CONUS for April 2019.
|
 Precipitation anomalies (percent of normal) for the CONUS for April 2019.
|
The full monthly circulation pattern reflected the combined effect of ridging along and off the West and East Coasts, the undercutting of the western ridge by strong troughs and closed lows which tracked across the Southwest, Plains, and Great Lakes, and the dominance of a long-wave trough with its below-normal height anomalies across Canada and extending a bit into the central CONUS. The surface temperature anomaly pattern matched the circulation anomaly pattern quite well, with above-normal temperatures in the West and along the East Coast, and near- to below-normal temperatures in the southern Plains to Lower Mississippi Valley and along the northern tier states. The precipitation anomaly pattern for the month (the wet areas) represented an additive result of precipitation from the individual frontal passages and low pressure systems. The dry areas resulted from the areas being missed by the storm track, which were mainly parts of California-Nevada, the Southwest, and the central Plains. The circulation during this month was also reflected in severe weather, drought, and regional records.
- When daily temperature records are examined, the extreme warmth outweighed the extreme cold. Integrated across the month, there were 2,753 record warm daily high (734) and low (2,019) temperature records (as of May 8). This was almost 1.7 times the 1,663 record cold daily high (1,075) and low (588) temperature records.
- Five states (California and four along the Mid-Atlantic Coast) ranked in the top ten warmest category. It was wet in the Pacific Northwest, New England, and Lower Mississippi Valley, where eight states ranked in the top ten wettest category.
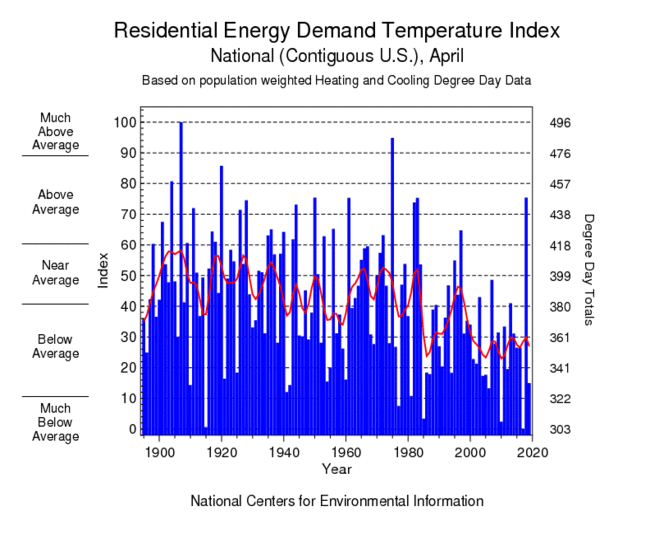
- Temperatures averaged across the country gave the CONUS the 23rd warmest April in the 1895-2019 record. The coldest air (temperature anomalies) was centered in the northern Plains to Great Lakes, and some from eastern Texas to the Lower Mississippi Valley; these include rural as well as urban areas. The warmest air (temperature anomalies) was located in the West (mostly California and Nevada) and the coastal Northeast to Mid-Atlantic (both heavily urban areas). With more population experiencing warmer-than-normal temperatures, reducing heating demand during this transitional time of year, than cooler-than-normal temperatures, the national REDTI (Residential Energy Demand Temperature Index) value for April 2019 ranked as the eleventh lowest April REDTI in the 125-year record.
- April continued a wetter-than-normal pattern over areas in the West and South that were in drought or abnormally dry at the end of March, resulting in another month of welcome drought improvement. Some areas in the Southeast and Plains that missed out on the above-normal precipitation and had continued dryness this month, as well as parts of Hawaii, Puerto Rico, and the U.S.-Affiliated Pacific Islands where below-normal precipitation dominated, experienced expansion or intensification of drought or abnormal dryness. With contraction exceeding expansion this month, the national level drought area fell from 5.7 percent of the CONUS at the end of March to 2.3 percent of the CONUS at the end of April (from 5.4 percent to 2.6 percent for all of the U.S.).
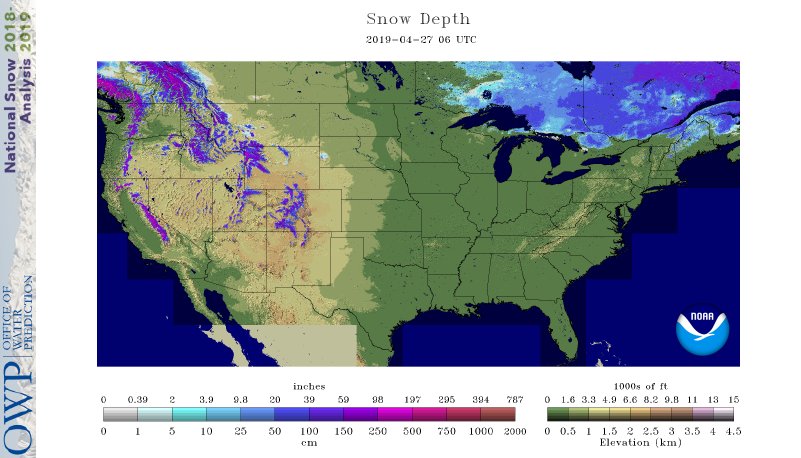
- This is the time of year when the steadily rising sun angle results in climatologically warming temperatures and a seasonally contracting snow cover. April 2019 began with about 21 percent of the CONUS covered in snow, mostly in the high western mountains and along the Canadian border from Minnesota to New England. With a couple exceptions, the snow coverage followed the seasonal script and steadily declined throughout the month. The first exception occurred near mid-month when a powerful low pressure system crossed the center of the country, pulling in Gulf of Mexico moisture from the south and below-freezing Canadian air from the north to create an extensive blanket of deep snow from the central Plains to western Great Lakes. Snow coverage peaked on April 12th at 26.6 percent of the CONUS, then rapidly declined in the following days as the low moved out into Canada, to bottom out at about 5 percent on the 27th. The second exception occurred at the end of the month when a low pressure system tracked along the Canadian border and dropped a snow cover from northern Montana to northern Minnesota, raising the CONUS snow cover area to 12.1 percent on the 30th. Based on satellite observations, the monthly snow coverage across the CONUS was 303 thousand sq. mi. (784 thousand sq. km.), 21 thousand sq. mi. (54 thousand sq. km.) above average, and ranked as the 22nd biggest snow cover area in the 53-year record for April. Integrated across the month, snow cover was above average across parts of the Upper Midwest into southeastern Canada and New England, but below average in parts of the High Plains to West and across much of the Canadian Prairies.
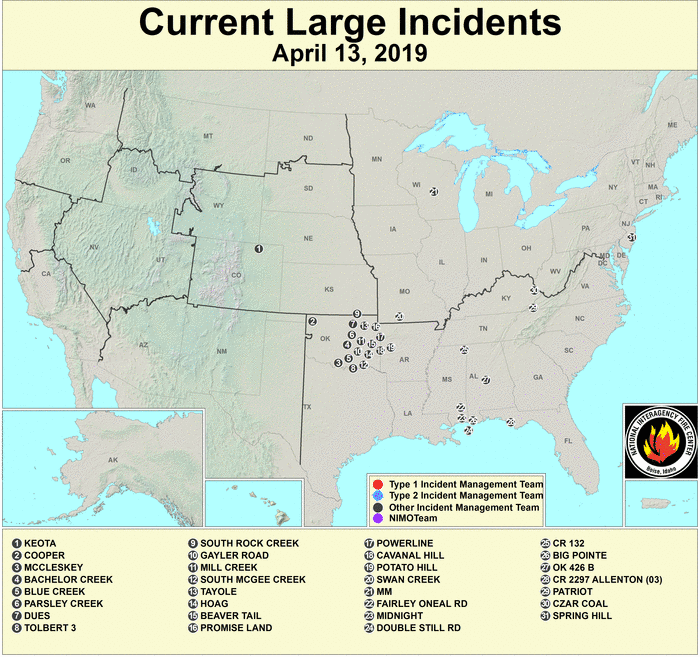
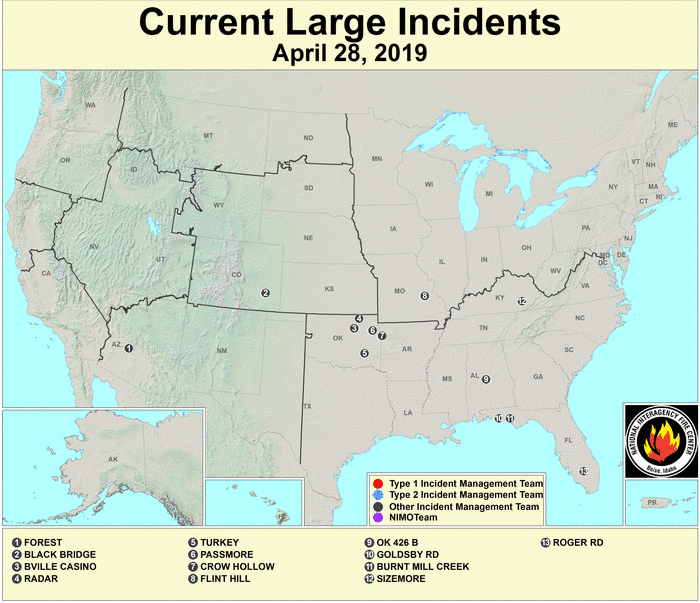
- A few large wildfires occurred during April, generally in the southern Plains to Southeast and mostly in Oklahoma (wildfire maps for April 13, 21, 28).
- The atmospheric circulation needed to create the instability and dynamics favorable for severe weather consists largely of a southwesterly flow across the central part of the CONUS, which funnels moist Gulf of Mexico air and its latent heat energy into the mix. Surface fronts push the air upwards, and surface lows create convergence of air at the surface which also forces air upwards and enhances instability, which provide additional atmospheric lifting. As the air spreads out horizontally in the upper atmosphere ahead of short-wave troughs and closed lows, divergence aloft creates additional lift. The changing direction of the circulation around surface lows and the upper-level troughs and lows above them adds spin to the rising air, which enhances the formation of tornadoes. During the warm season, solar heating of the ground creates convective currents which add to the instability of the air. As discussed in earlier sections, these conditions occurred repeatedly during April. Notable tornado outbreaks occurred on April 13-14 and April 17-19 as weather systems migrated across the South then along the East Coast, with lesser outbreaks on the 7th and 24th in the South and on the 30th in the central to southern Plains. Based on preliminary data, there were 299 tornadoes in April 2019, which is well above the long-term average for April of 155.
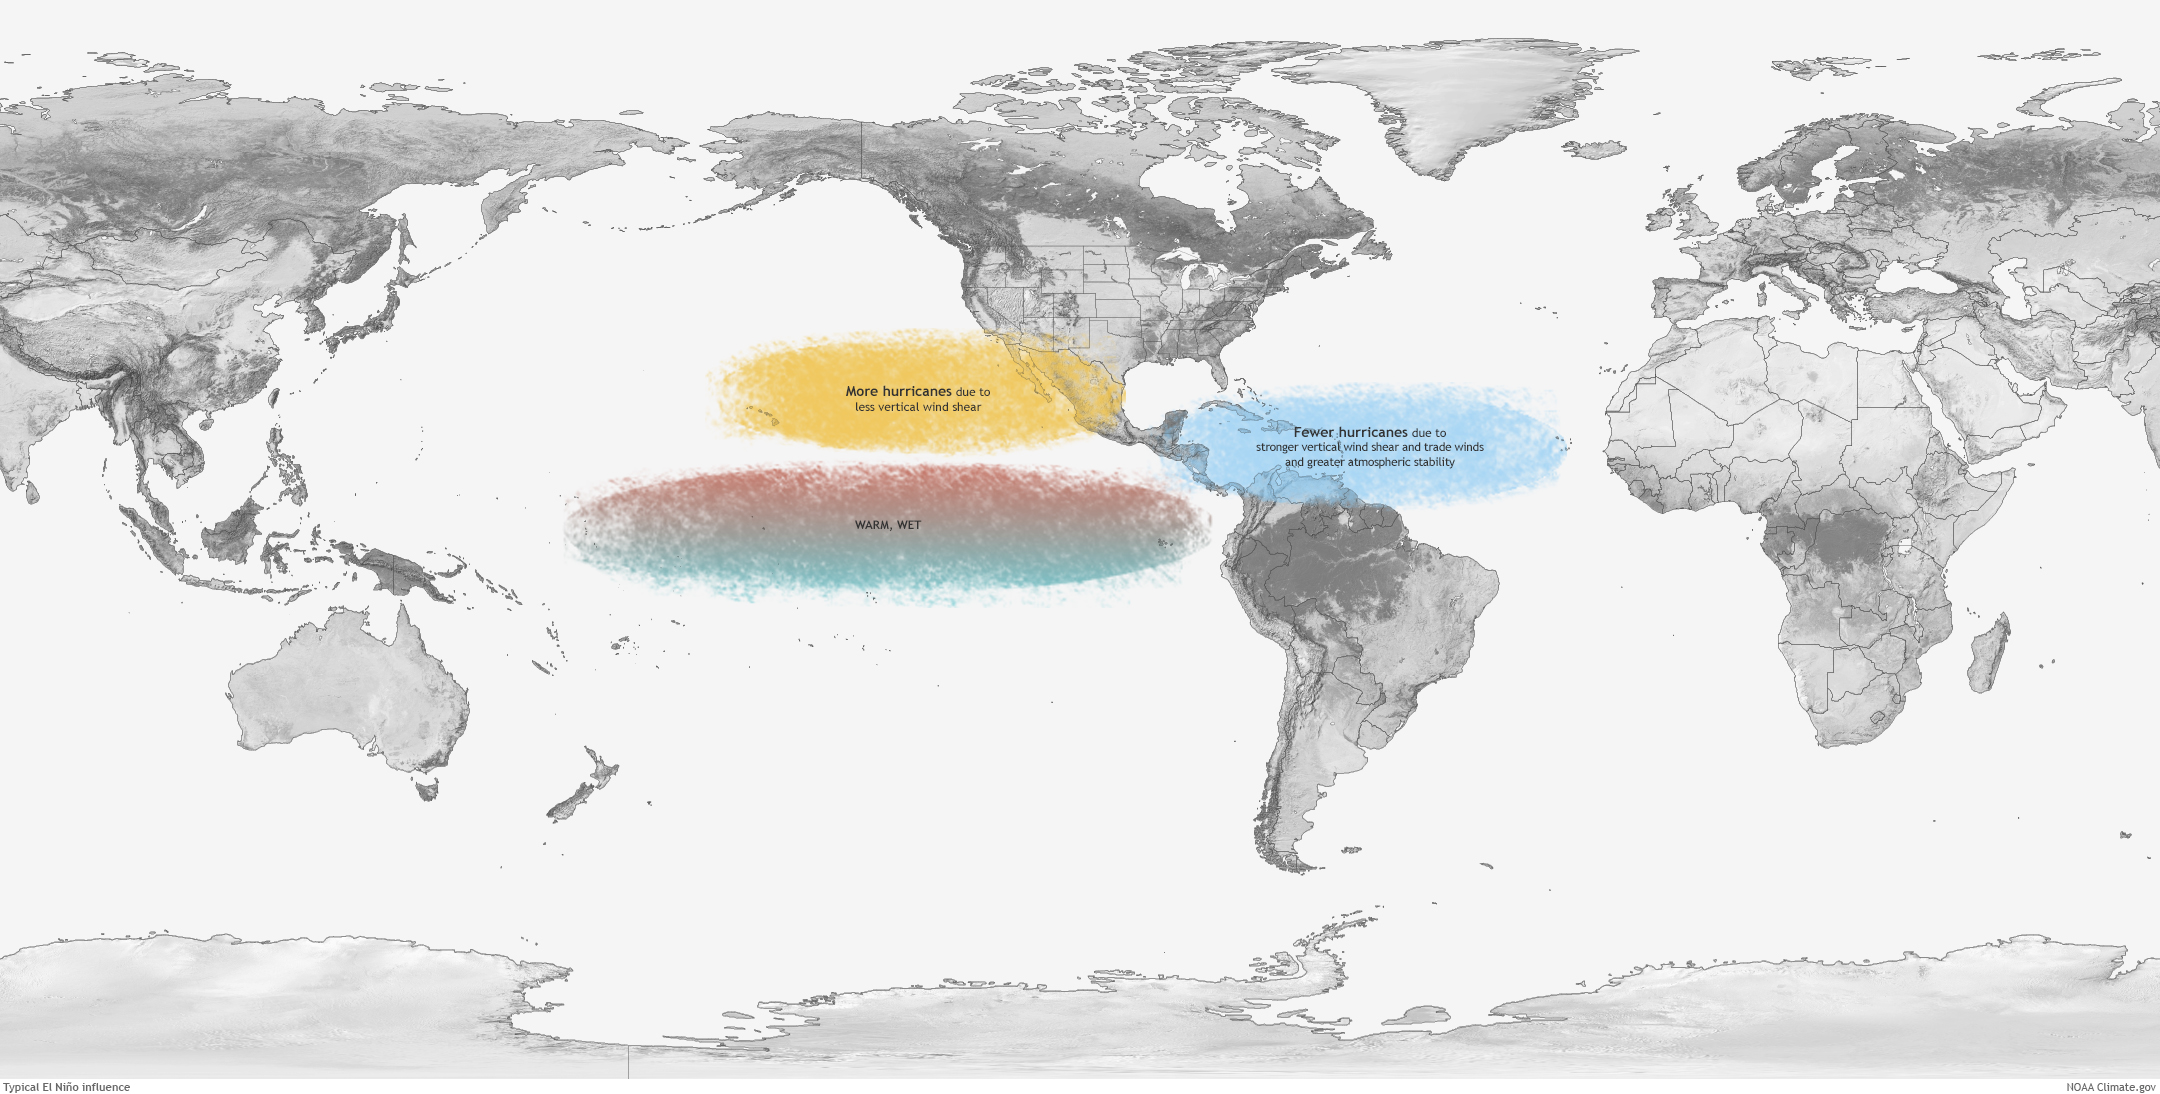
Typically tropical cyclone activity is enhanced in the Eastern North Pacific and inhibited in the North Atlantic during El Niños, and inhibited in the Eastern North Pacific and enhanced in the North Atlantic during La Niñas, due mostly to changes in vertical wind shear during the two extreme events. The relationship is unclear during ENSO-neutral events. Warm sea surface temperatures (SSTs) fuel tropical cyclones while vertical wind shear tears them apart. The tropical Pacific Ocean was in a weak El Niño state during April 2019.
- The Atlantic hurricane season runs from June 1st through November 30th and the Eastern North Pacific (ENP) hurricane season runs from May 15th through November 30th.
- No tropical systems developed in the North Atlantic, Eastern North Pacific, or Central North Pacific during April 2019.
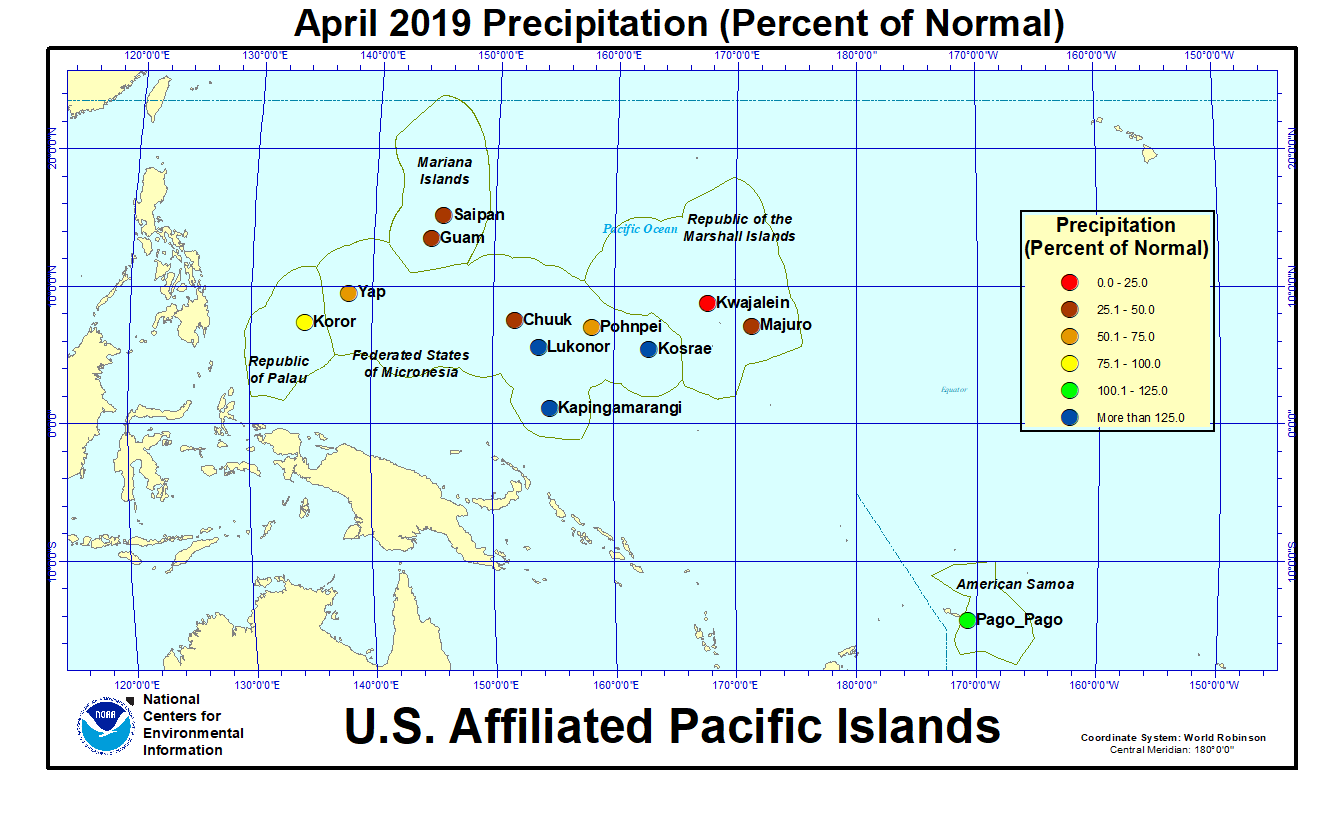
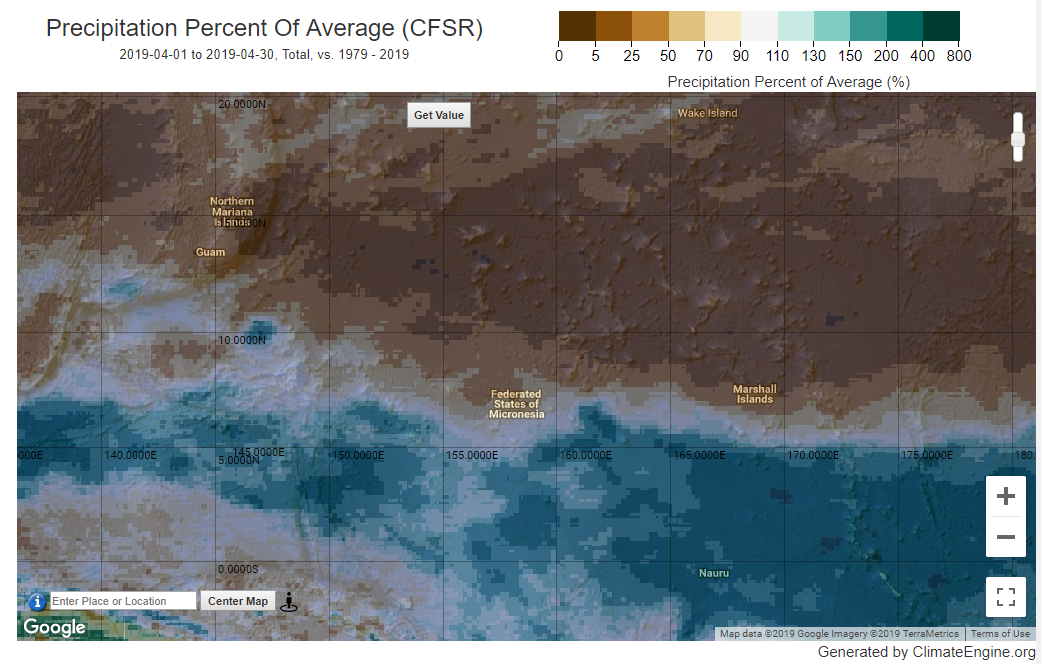
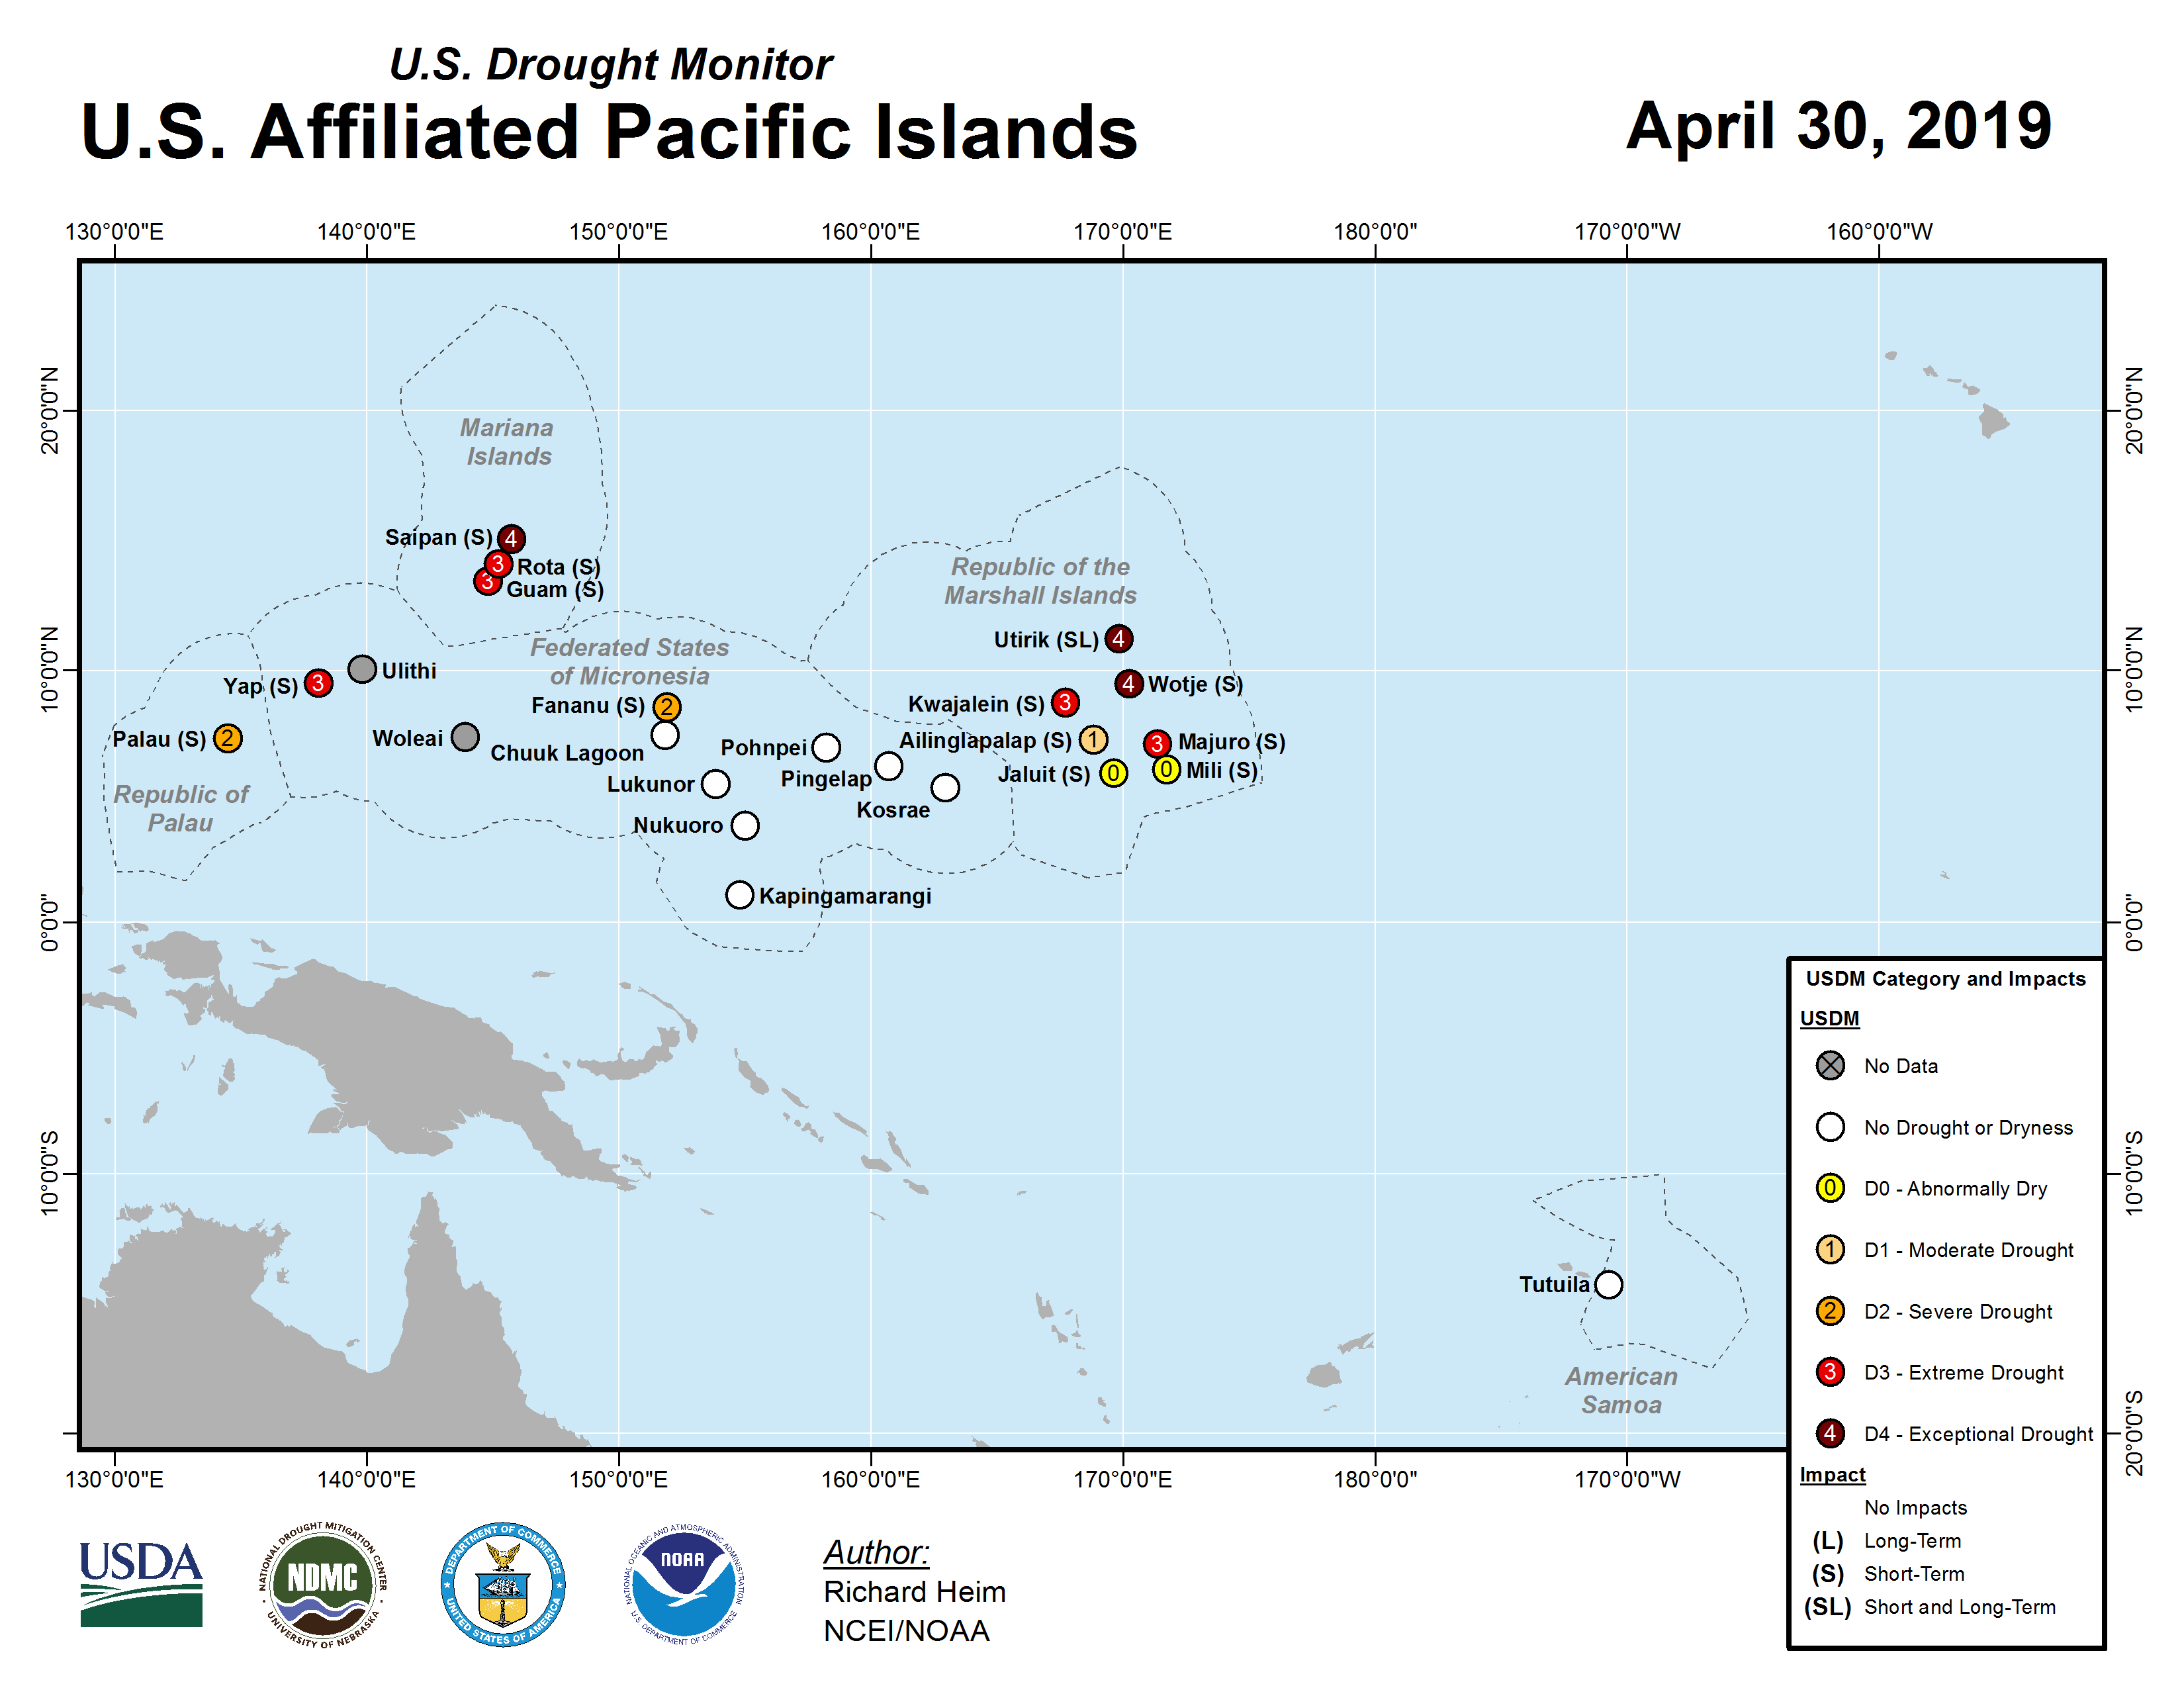
- In the U.S.-Affiliated Pacific Islands (USAPI) (Micronesia) portion of the Western North Pacific, an area of convection developed to the point of being noticed (Invest 99W) early in the month. It did not develop further, lasting only a couple days before dissipating by April 3. Post El Niño-like weather dominated this region of the Pacific during April. Dry trade winds blowing from the North Pacific subtropical ridge (North Pacific High) kept northern portions of the USAPI in drought. When these faster-moving trade winds encountered slower winds near the equator, the resulting convergence generated rainfall throughout the month in the southern portions of Micronesia. The convergence was frequently accompanied by near-equatorial troughs and weak tropical disturbances, and the combination of these features comprised the Inter-Tropical Convergence Zone.
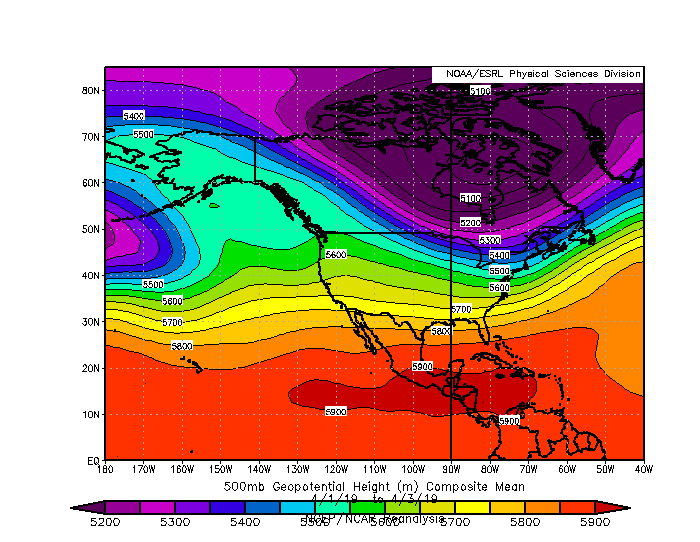
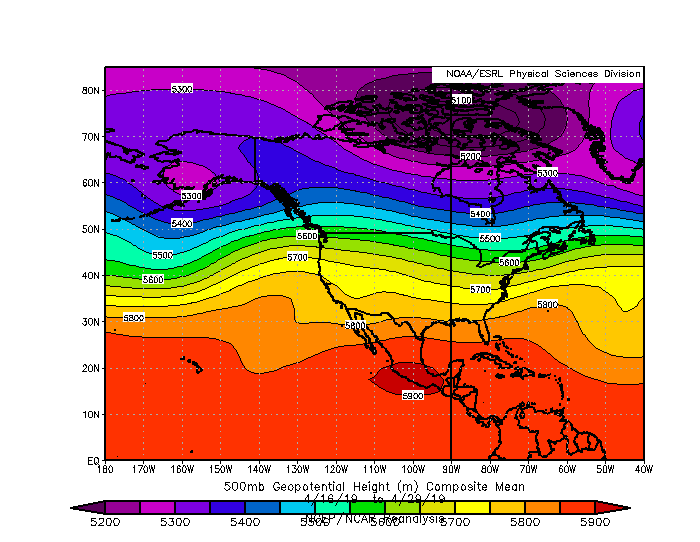
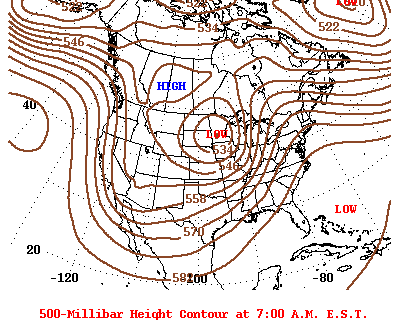
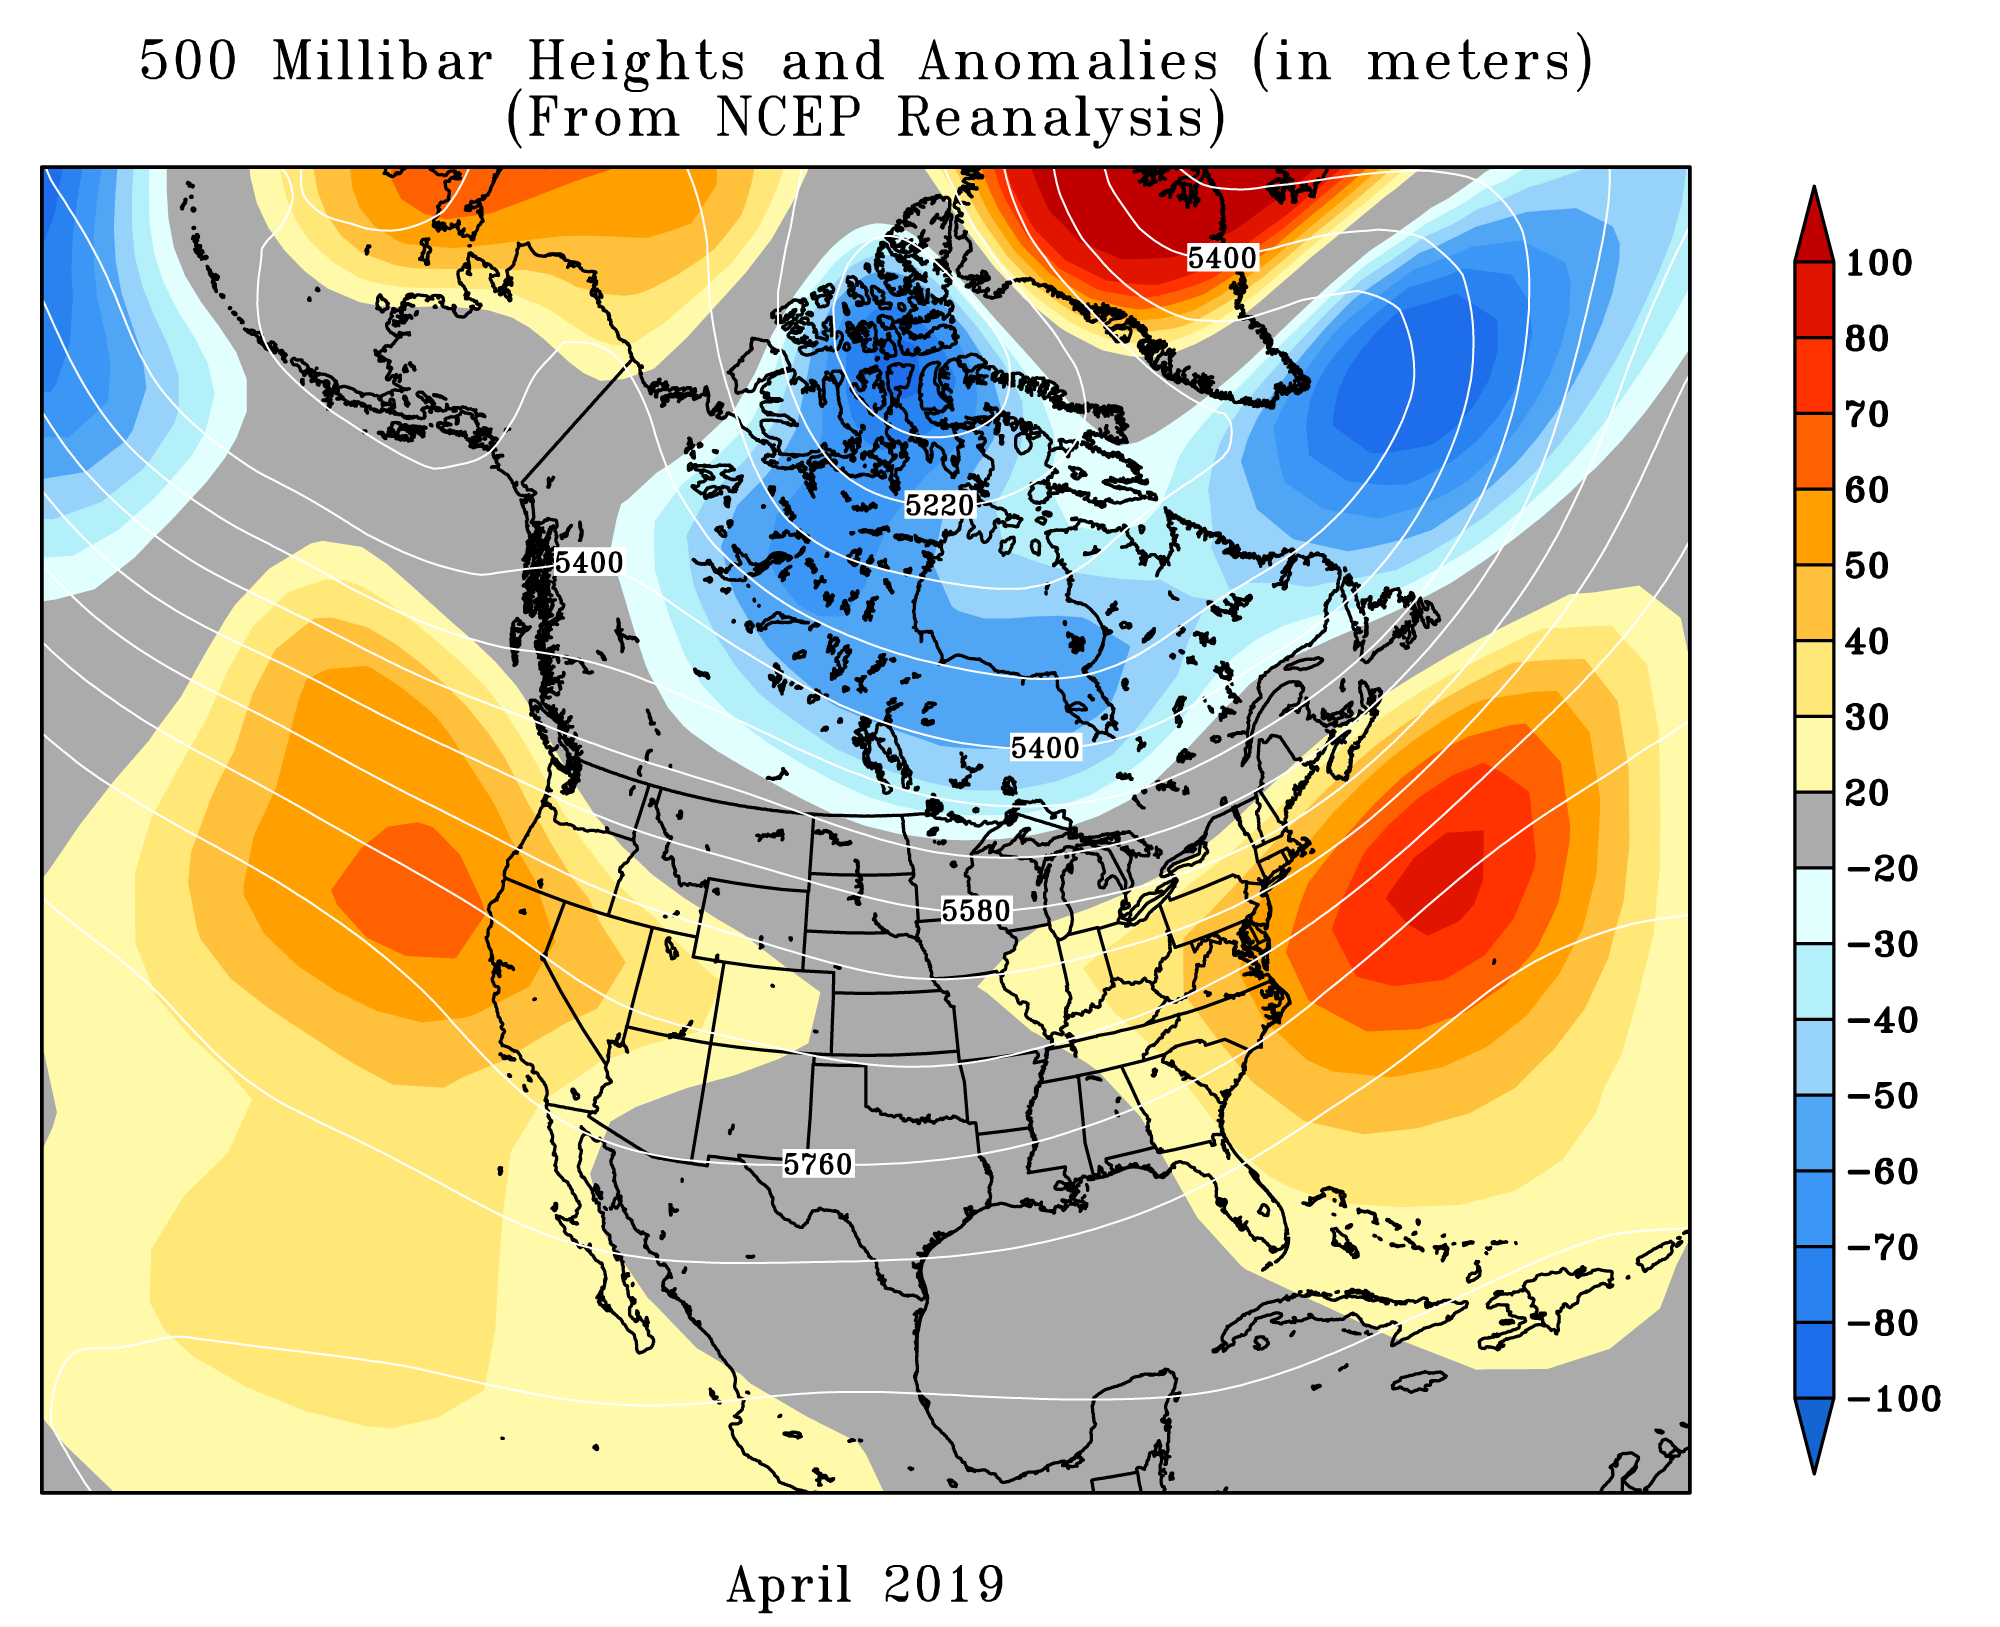 North America monthly upper-level circulation pattern and anomalies. The upper-level circulation pattern during April, when averaged for the month, consisted of ridges, with above-normal height anomalies, along the West Coast into the eastern Pacific, and in the western Atlantic off the East Coast. A slight trough was evident over the Southwest, with the Hudson Bay Low extending a trough across Canada and into the U.S. Midwest. |
|
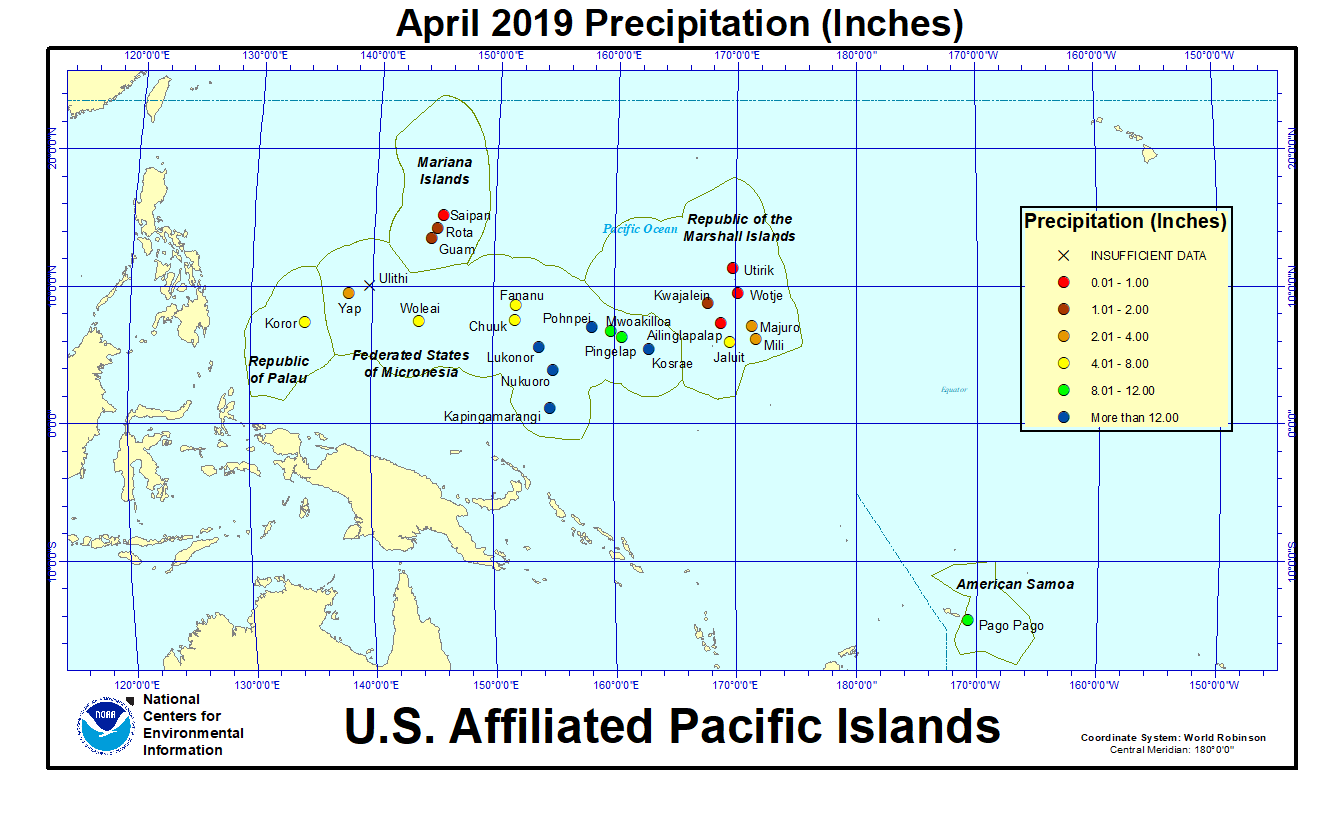
Map of monthly precipitation anomalies. April 2019 ended up drier than normal across the northern portions of the USAPI, much of Hawaii, and parts of California to Nevada, Arizona to Colorado, the central Plains, Alaska, and Puerto Rico and the U.S. Virgin Islands. The month was wetter than normal in the Pacific Northwest to interior West, the southern Plains to Southeast, the southern portions of the USAPI, eastern to southeastern Alaska, and parts of Puerto Rico and the northern Plains to Northeast. |
|
Map of monthly temperature anomalies. The northern tier states had a near- to cooler-than-normal April, as did the southern Plains to Lower Mississippi Valley. April was warmer than normal in much of the West and along parts of the East. Alaska was mostly warmer than normal. |
 Northern Hemisphere monthly upper-level circulation pattern and anomalies (cylindrical projection).
|
 Northern Hemisphere monthly upper-level circulation anomalies (polar stereographic projection).
|
|
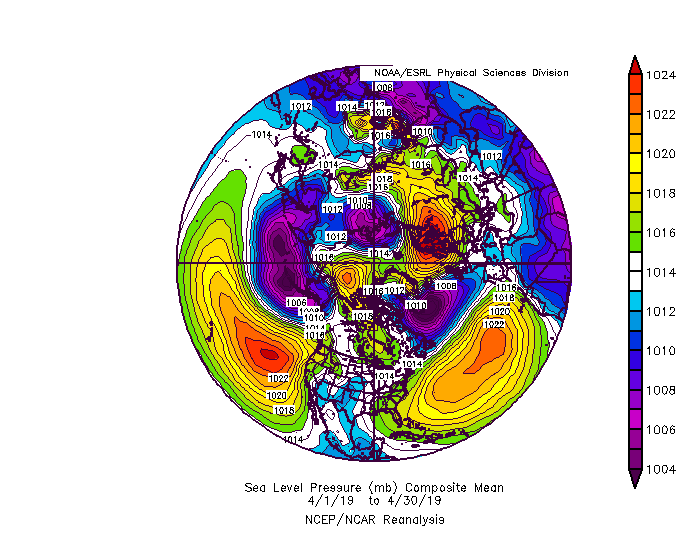
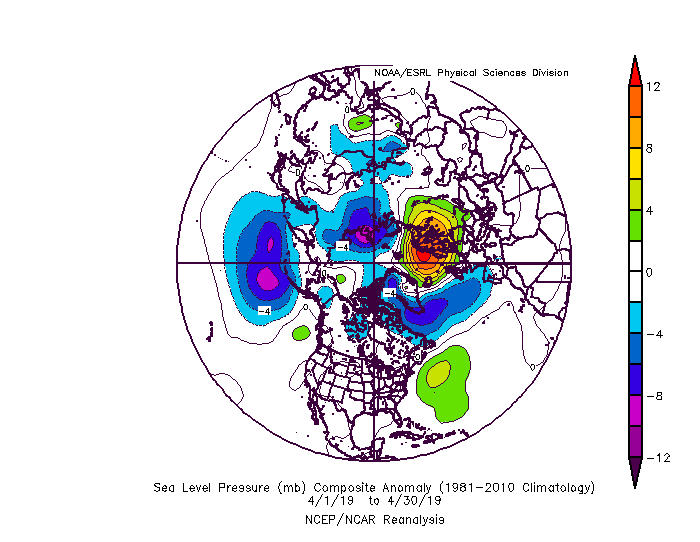
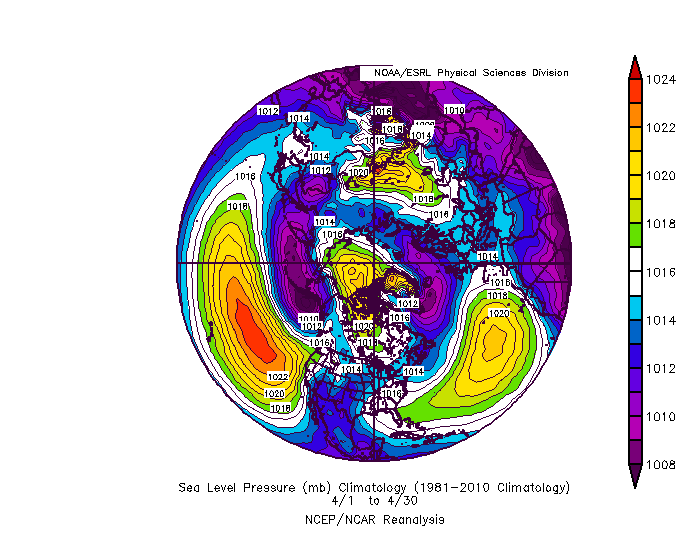
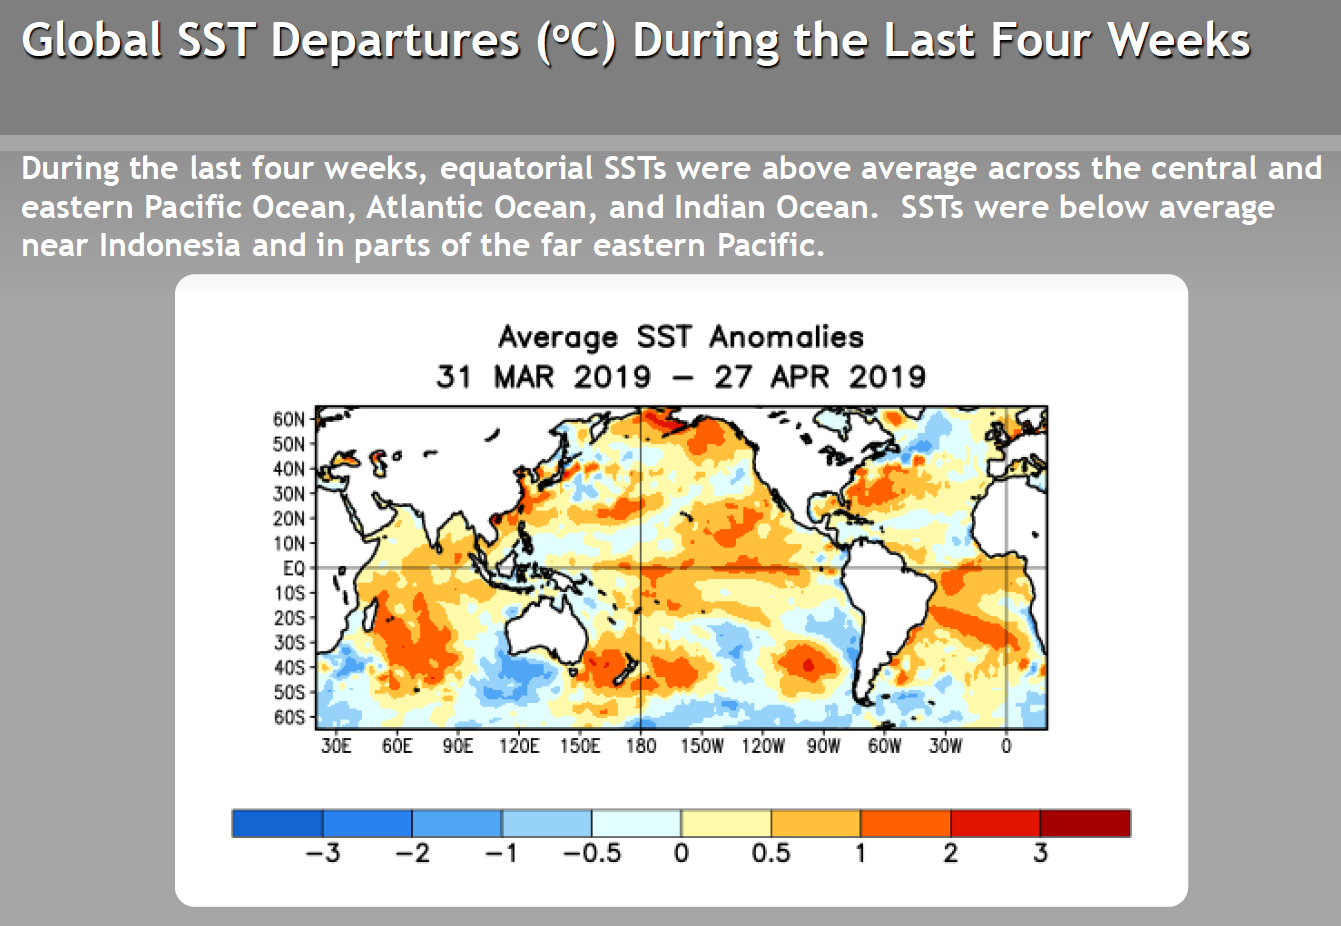
Global Linkages: The upper-level (500-mb) circulation anomaly pattern over North America was part of a complex long-wave pattern that stretched across the Northern Hemisphere. The sinusoidal nature of the jet stream was evident in east to west couplings of ridges and troughs. There seemed to be two sets of couplings — a high latitude set and a mid-latitude set — as well as north-south couplings. A two-wave pattern at the high latitudes was comprised of a trough over Canada with ridge over northern Europe to Greenland, and a trough over north central Russia coupled with a ridge over eastern Siberia. A two-wave mid-latitude pattern could be said to consist of a broken ridge over the CONUS and adjacent Pacific and Atlantic Oceans coupled with a trough over the Mediterranean and northern Africa, and a ridge over China coupled with a trough over the western North Pacific. Geographically, these two sets of anomalies might be coupled north-south — ridge over CONUS with trough over Canada, ridge over China with trough over north central Russia, etc. The upper-level circulation and its anomalies are associated with the Sea Level Pressure (SLP) pattern and its anomalies which reflect the semi-permanent centers of action of SLP. The above- and below-normal upper-level height anomalies appear to be associated with above- and below-normal SLP anomalies. During this time of year, storm systems usually congregate in certain favored areas, creating (on average) low pressure centers over the North Pacific (Aleutian Low) and North Atlantic (Icelandic Low). The North Pacific High and North Atlantic (Bermuda) High, which are normally weak and shifted further south during winter, are beginning to strengthen during spring. The location of the April 2019 SLP anomalies with respect to the long-term climatology suggests that the North Atlantic High was stronger and shifted further west (toward the U.S. East Coast) compared to climatology. (This could account for the warm temperature anomalies across the East Coast.) At the same time, both the Icelandic and Aleutian Lows appeared to be stronger compared to climatology (which could be associated with the more active storm pattern). During April 2019, above-average sea surface temperature (SST) anomalies continued to dominate the North Pacific, much of the Atlantic, and most of the Indian Ocean. The map of the change in SST anomalies from the end of March to the end of April showed cooling off the coast of California, off the coast of Japan, in the Gulf of Mexico, and in parts of the North Atlantic. The above-normal 500-mb heights were associated with upper-level ridging, or with weakened troughs, at the mid- and high latitudes; below-normal precipitation (over northern Europe); below-normal snow cover (over northern China and Mongolia); above-normal surface temperatures (over the eastern and western CONUS, Greenland to northern Europe, eastern Siberia, and China); and warm SST anomalies (over the eastern North Pacific and western North Atlantic). The areas of below-normal 500-mb heights were associated with upper-level troughing, or with weakened ridges; near- to below-normal surface temperatures (over Canada and north central Russia); cool SST anomalies (in the northern North Atlantic south of Greenland); above-normal precipitation (over north central Russia); and above-normal snow cover (over southeast Canada to north central CONUS, and along the southern periphery of the north central Russia below-normal heights region). Parts of North America and Asia were near to cooler than normal, and southern parts of the Southern Hemisphere oceans had cooler-than-normal SST anomalies. But with all of South America, most of Australia and Africa, and much of Eurasia having warmer- to much-warmer-than-normal temperatures, and large portions of the Atlantic, Pacific, and Indian Oceans having warmer-than-normal sea surface temperatures, the April 2019 global temperature was still well above normal. |
Atmospheric Drivers
Subtropical highs, and fronts and low pressure systems moving in the mid-latitude storm track flow, are influenced by the broadscale atmospheric circulation. The circulation of the atmosphere can be analyzed and categorized into specific patterns. The Tropics, especially the equatorial Pacific Ocean, provides abundant heat energy which largely drives the world's atmospheric and oceanic circulation. The following describes several of these modes or patterns of the atmospheric circulation, their drivers, the temperature and precipitation patterns (or teleconnections) associated with them, and their index values this month:
-
El Niño Southern Oscillation (ENSO)
- Description: Oceanic and atmospheric conditions in the tropical Pacific Ocean can influence weather across the globe. ENSO is characterized by two extreme modes: El Niño (warmer-than-normal sea surface temperature [SST] anomalies in the tropical Pacific) and La Niña (cooler-than-normal SST anomalies), with the absence of either of these modes termed "ENSO-neutral" conditions.
- Status: The ocean and atmosphere system reflected a weak El Niño state during April 2019. SSTs were warmer than average across most of the equatorial Pacific Ocean.
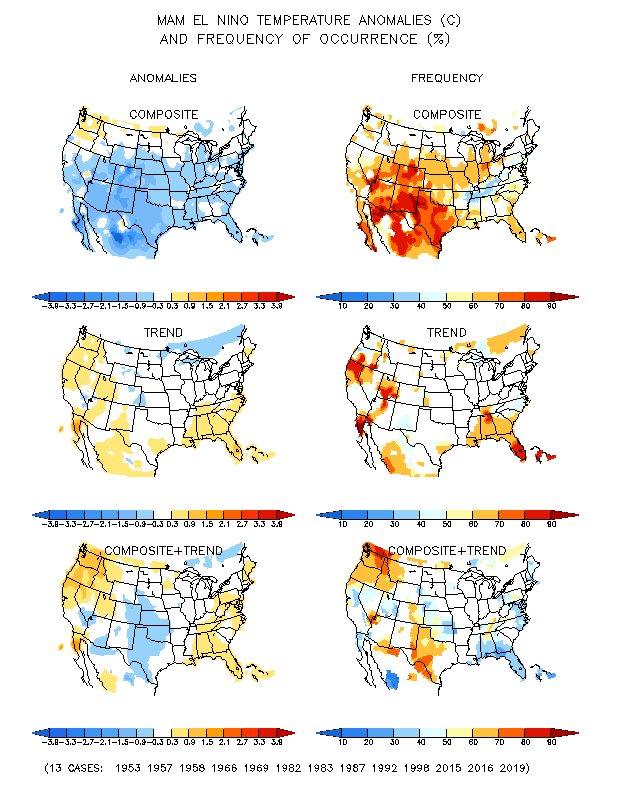
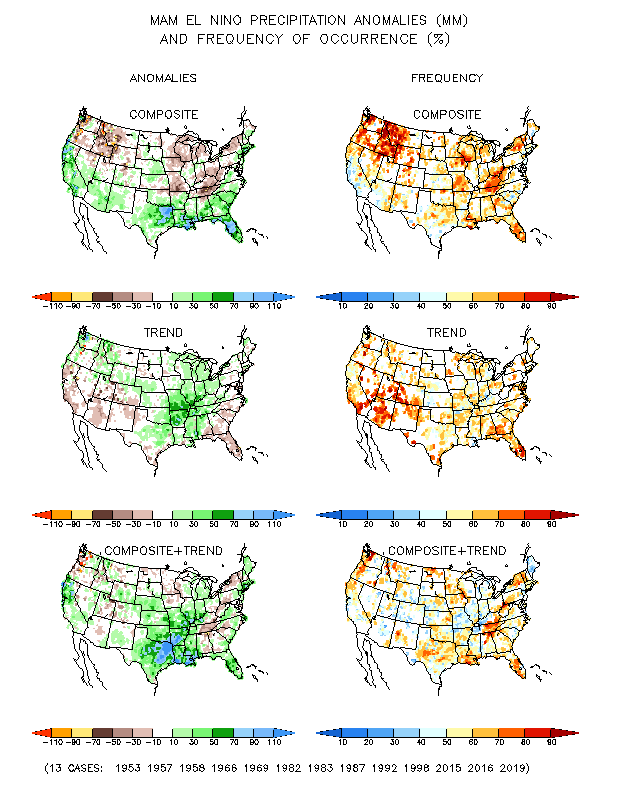
- Teleconnections (influence on weather): To the extent teleconnections are known, the typical temperature and precipitation patterns associated with El Niño during April include above-normal temperatures in the Pacific Northwest; below-normal temperatures across the Southwest, southern to central Plains, and parts of the Midwest; near-normal temperatures in the South and East; above-normal precipitation from the southern Plains to Southeast, in California, and parts of the Southwest; and below-normal precipitation in parts of the Pacific Northwest and Great Basin to Upper Mississippi Valley and eastern Great Lakes.
- Comparison to Observed: The April 2019 precipitation anomaly pattern agrees in some areas (especially the southern Plains to Southeast) but not others (is opposite in the West), but the temperature anomaly pattern is not a match.
-
Madden-Julian Oscillation (MJO)
- Description: The MJO is a tropical disturbance or "wave" that propagates eastward around the global tropics with a cycle on the order of 30-60 days. It is characterized by regions of enhanced and suppressed tropical rainfall. One of its indices is a phase diagram which illustrates the phase (1-8) and amplitude of the MJO on a daily basis. The MJO is categorized into eight "phases" depending on the pattern of the location and intensity of the regions of enhanced and suppressed tropical rainfall. The MJO can enter periods of little or no activity, when it becomes neutral or incoherent and has little influence on the weather. Overall, the MJO tends to be most active during ENSO-neutral years, and is often absent during moderate-to-strong El Niño and La Niña episodes.
- Status: The MJO Wheeler-Hendon index indicated that the MJO was incoherent the first two-thirds of the month, then transitioned through phases 2 to 4 during the last third. Other aspects of the tropical ocean-atmosphere system (referred to in the CPC reports as the background or low frequency (or base) [e.g., La Niña or El Niño] state, and Kelvin and Rossby waves, and tropical cyclone activity) also appeared to play a role in influencing the month's climate (especially Rossby waves, tropical cyclones, and Kelvin waves) (MJO updates for April 8, 15, 22, and 29).
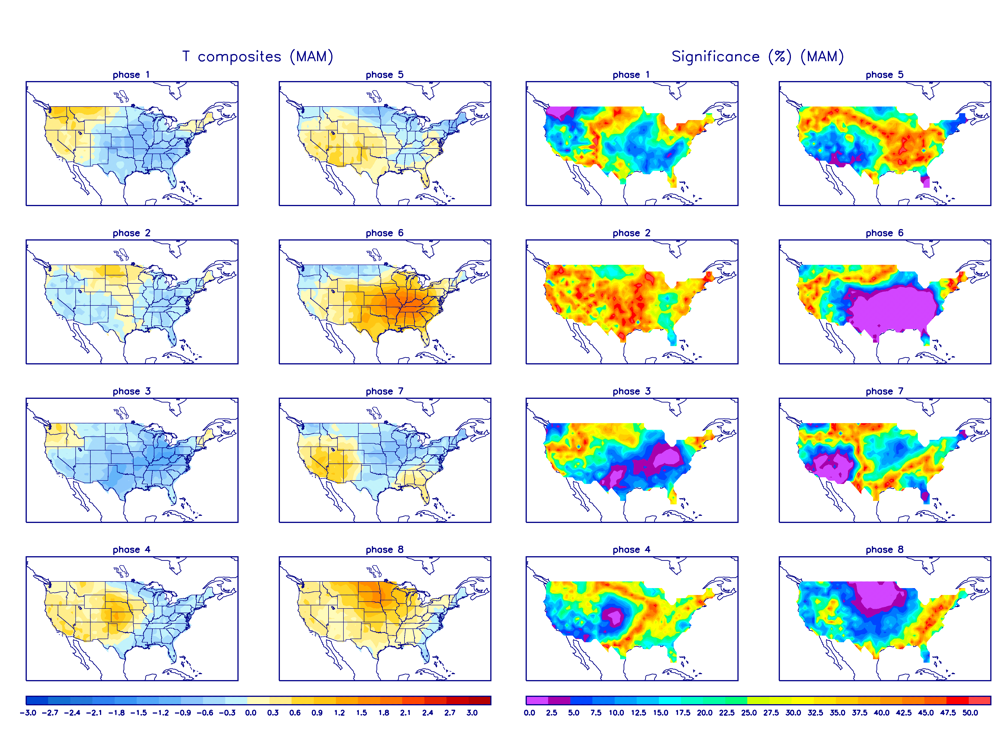
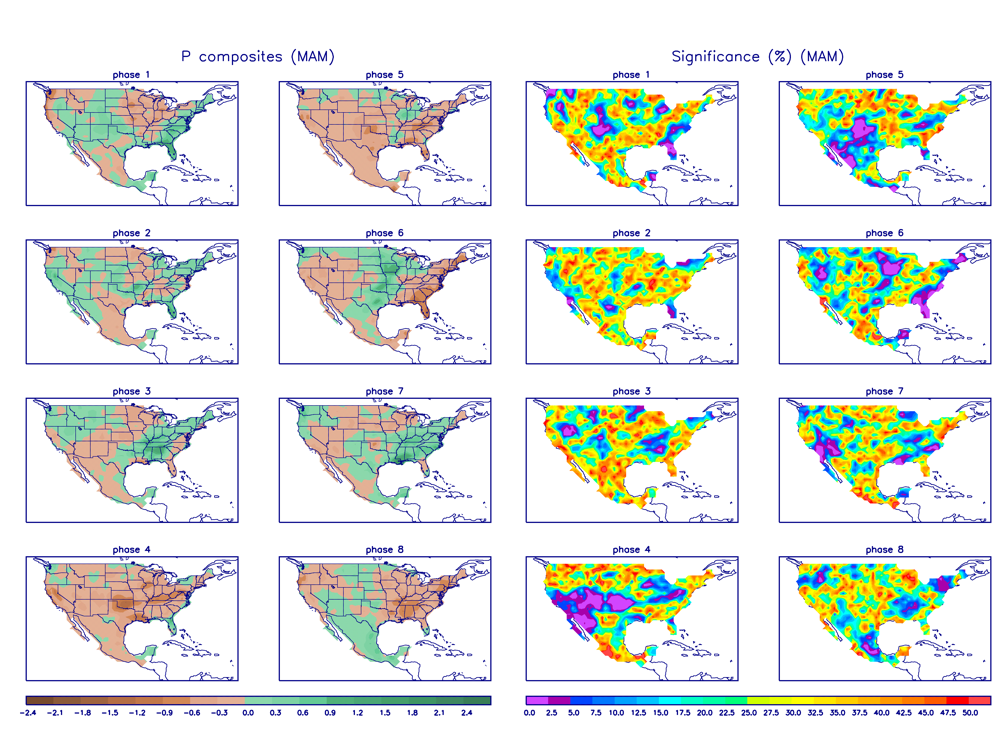
- Teleconnections (influence on weather): The MJO's temperature and precipitation teleconnections to U.S. weather depend on time of year and MJO phase; there is also a lagged component associated with the teleconnections. To the extent teleconnections are known, the April (March-May) teleconnections for temperature are shown here and for precipitation are shown here.
- Comparison to Observed: The MJO is transitory and can change phases (modes) within a month, so it is usually more closely related to weekly weather patterns than monthly. In the case of April 2019, the monthly temperature anomaly pattern generally does not match the teleconnections for phases 2-4, but it has half of a resemblance (for the Mississippi River and westward) to the teleconnection pattern for phase 4. The sub-monthly temperature anomaly patterns do not match the teleconnection patterns for the phases that existed during those periods. The monthly precipitation anomaly pattern has some resemblance to the teleconnections for phase 3. But the precipitation anomaly pattern for April 23-29, which was when the MJO was mostly in phase 3, does not match.
- The Pacific/North American (PNA) pattern
- Description: The PNA teleconnection pattern is associated with strong fluctuations in the strength and location of the East Asian jet stream. PNA-related blocking of the jet stream flow in the Pacific can affect weather downstream over North America, especially the West and especially in the winter half of the year.
- Status: The daily PNA index oscillated around zero for most of the month, ending the month slightly negative and averaging negative for the month as a whole.
- Teleconnections (influence on weather): To the extent teleconnections are known, a negative PNA for this time of year (April on the quarterly teleconnection maps) is associated with above-normal upper-level circulation anomalies over the northern North Pacific and southern and central Plains to U.S. East Coast; below-normal circulation anomalies over western Canada into the Pacific Northwest; cold temperature anomalies over Alaska, Canada, and the Pacific Northwest; warm temperature anomalies over the southern and central Plains to U.S. East Coast; and below-normal precipitation in Colorado and Kansas, with above-normal precipitation in the Upper Mississippi Valley, although the precipitation teleconnections are few and weak.
- Comparison to Observed: The April 2019 monthly upper-level circulation anomaly pattern agrees with the teleconnections over Canada, but not elsewhere. The monthly temperature and precipitation anomaly patterns do not match the teleconnections for a negative PNA. The daily oscillations around zero do not lend themselves to comparisons with observed anomalies on a sub-monthly basis.
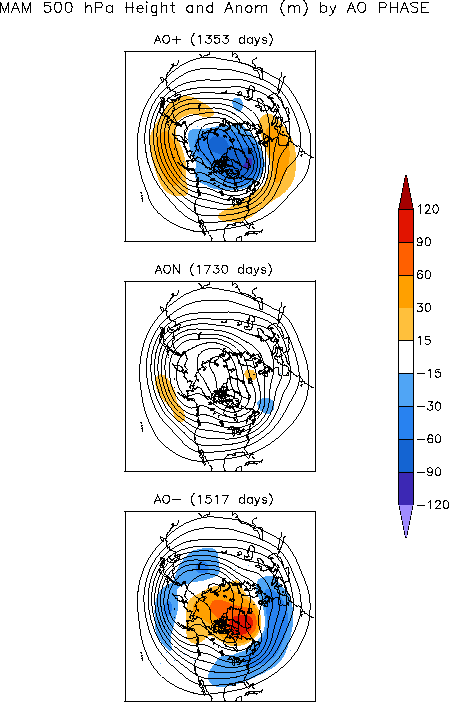
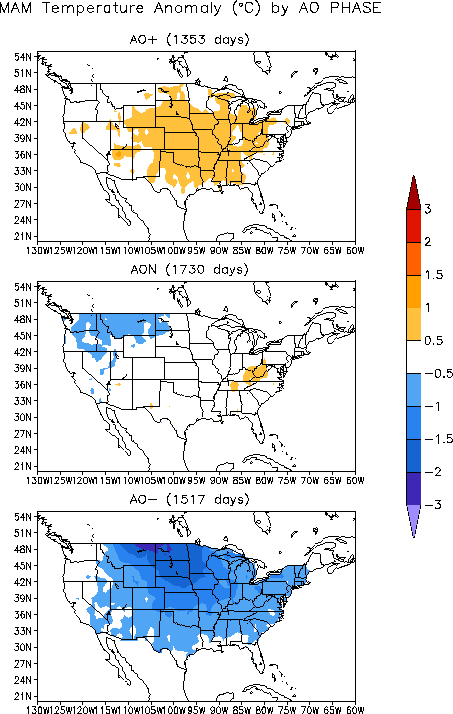
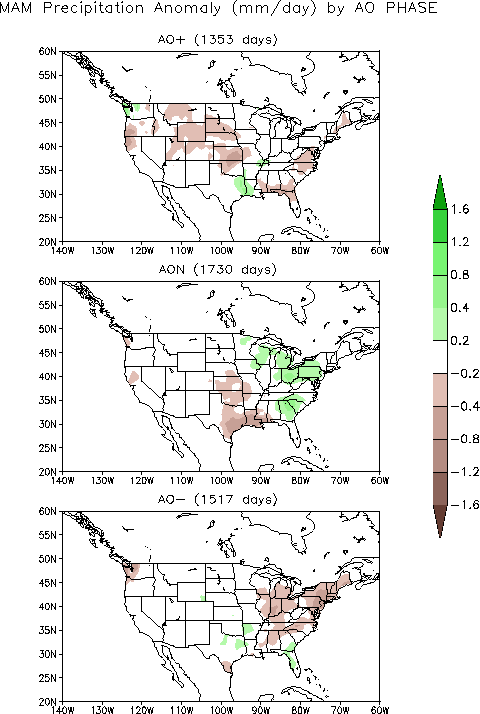
- The Arctic Oscillation (AO) pattern
- Description: The AO teleconnection pattern relates upper-level circulation over the Arctic to circulation features over the Northern Hemisphere mid-latitudes and is most active during the cold season.
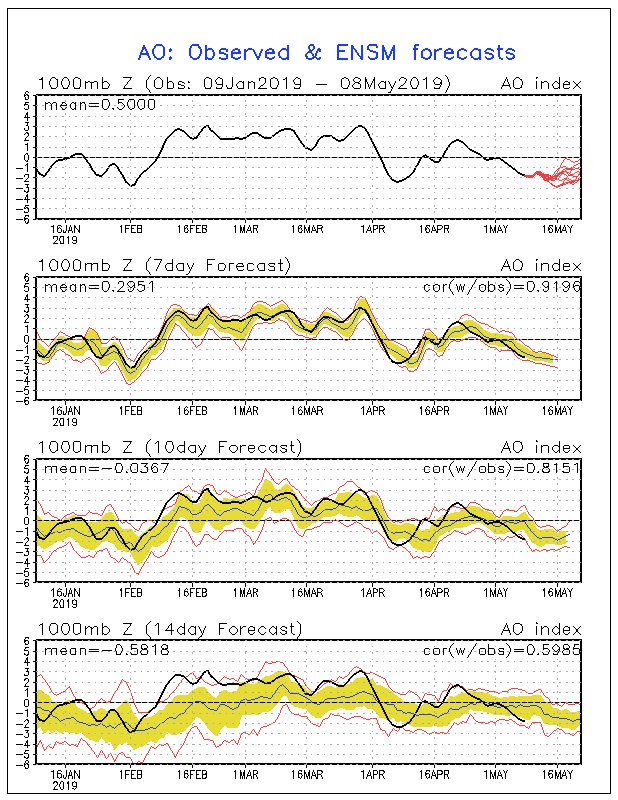
- Status: The daily AO index was negative during the first half of the month and positive during the second half, averaging negative for the month. The 3-month-averaged index was positive.
- Teleconnections (influence on weather): To the extent teleconnections are known, a negative AO in April (March-May in the AO Quarterly Composites table) is typically associated with above-normal upper-level circulation anomalies over the Arctic Ocean and Alaska; negative upper-level circulation anomalies over the eastern CONUS extending across the North Atlantic to Europe, and much of the North Pacific; below-normal temperatures across most of the CONUS from the Rockies to East Coast; drier-than-normal conditions from the interior Southeast and Ohio Valley to the Northeast, and across western Washington; and wetter-than-normal conditions in spots across parts of Texas, Arkansas, Florida, and southern Georgia.
- Comparison to Observed: The April 2019 monthly upper-level circulation, temperature, and precipitation anomaly patterns do not match the teleconnections for a negative AO. However, although not a perfect match, the weekly temperature anomaly patterns do show some similarity during the first half of the month (April 8-14 to 11-17, although there seems to be some lag) when the AO was negative, and during the second half of the month (April 18-24) when the AO was positive.
- The North Atlantic Oscillation (NAO) pattern
- Description: The NAO teleconnection pattern relates upper-level circulation over the North Atlantic Ocean to circulation features over the Northern Hemisphere mid-latitudes.
- Status: The daily NAO index began the month positive, then oscillated to negative then back to positive, ending the month negative, averaging positive for the month. The 3-month-averaged index was positive.
- Teleconnections (influence on weather): To the extent teleconnections are known, a positive NAO during this time of year (April on the quarterly teleconnection maps) is associated with above-normal upper-level circulation anomalies across the CONUS, then across the Atlantic to Europe; below-normal circulation anomalies over northern Canada to Greenland; above-normal temperatures across the CONUS, except Texas to the Mid-Atlantic Coast where there is no correlation; and below-normal precipitation in the Southeast and parts of the central Plains and West.
- Comparison to Observed: The April 2019 monthly upper-level circulation anomaly pattern agrees with the teleconnections for a positive NAO over North America, but appears shifted. The monthly temperature anomaly pattern agrees well over the West. The monthly precipitation anomaly pattern agrees in the central Plains, but not elsewhere. On a sub-monthly scale, the upper-level circulation anomaly patterns during April 1-3, 18-24, and 16-29, and the temperature anomaly pattern during 16-29, generally agree with the teleconnections when the NAO was positive.
- The West Pacific (WP) pattern
- Description: The WP teleconnection pattern is a primary mode of low-frequency variability over the North Pacific and reflects zonal and meridional variations in the location and intensity of the (East Asian) jet stream in the western Pacific.
- Status: The monthly WP index was negative (daily index values are not available).
- Teleconnections (influence on weather): To the extent teleconnections are known, a negative WP during this time of year (April on the quarterly teleconnection maps) is typically associated with above-normal circulation anomalies over the western CONUS extending into the eastern North Pacific, and over eastern Siberia; below-normal circulation anomalies over the western North Pacific; slightly below-normal circulation anomalies over southwestern Canada and across the Gulf of Mexico; below-normal temperatures across southwestern Canada, across the northern Plains and Great Lakes, to the Ohio and Mid-Mississippi Valleys; above-normal temperatures over the southwestern CONUS; and above-normal precipitation in Washington State (but otherwise little correlation).
- Comparison to Observed: The April 2019 monthly upper-level circulation and temperature anomaly patterns are a good match for the teleconnections for a negative WP, where the teleconnections exist, and the monthly precipitation anomaly pattern agrees where teleconnections exist (in Washington State), but otherwise there are few precipitation correlations to compare to. The upper-level circulation anomaly map for April 16-29 also matches well where the teleconnections exist.
- The East Pacific-North Pacific (EP-NP) pattern
- Description: The EP-NP teleconnection pattern relates SST and upper-level circulation patterns (geopotential height anomalies) over the eastern and northern Pacific to temperature, precipitation, and circulation anomalies downstream over North America. Its influence during the winter is not as strong as during the other three seasons.
- Status: The April 2019 monthly EP-NP index was positive (daily index values are not available).
- Teleconnections (influence on weather): To the extent teleconnections are known, a positive EP-NP index this time of year (April on the quarterly teleconnection maps) is typically associated with below-normal upper-level circulation anomalies over eastern Canada extending into the adjacent northern CONUS, and over the North Pacific; above-normal upper-level circulation anomalies across Alaska, extending down the Canadian west coast to the western CONUS; warmer-than-normal temperatures across western Alaska and the U.S. West Coast; below-normal temperatures across eastern Canada and the CONUS east of the Rockies (except for the Southeast); above-normal precipitation over Wyoming and part of the Ohio Valley (but the teleconnections are few and very weak).
- Comparison to Observed: The April 2019 monthly upper-level circulation anomaly pattern is a good match for the teleconnections for a positive EP-NP where teleconnections exist. The beginning (April 1-3) and ending (April 25-30) weeks also match quite well. The monthly temperature anomaly pattern agrees over Alaska, and the overall pattern agrees over the CONUS except the observed cold anomalies were not as extensive. There are few precipitation teleconnections, but the monthly precipitation anomaly pattern generally agrees where they exist.
| Time Period | Circulation | Temperature | Precipitation |
| Month | NAO, WP, EP-NP |
NAO, WP, EP-NP |
WP, EP-NP |
| April 1-3 | NAO, EP-NP |
— | — |
| April 8-17 | — | AO | — |
| April 18-24 | NAO | AO | — |
| April 16-29 | WP, NAO | NAO | — |
| April 25-30 | EP-NP | — | — |
Examination of the available circulation indices and their teleconnection patterns, and comparison to observed April 2019 weekly and monthly temperature, precipitation, and circulation anomaly patterns, suggests that the weather during this month was influenced, in whole or in part, by atmospheric drivers originating over the North Pacific, North Atlantic, and Arctic Oceans. The equatorial Pacific was in a weak El Niño state. The MJO was incoherent for much of the month, emerging late in the month. The observed anomaly patterns were not consistent with what would be expected if the MJO or El Niño were controlling factors for CONUS weather (except the El Niño may have contributed to the southern Plains and Southeast wet conditions). The circulation and temperature anomaly patterns appeared to be an amalgamation of the teleconnections associated with the NAO, WP, EP-NP, and AO. None of them matched perfectly, but elements of each could be seen in the observed patterns. A complicating factor was the frequent passage of closed upper-level lows across the Southwest to southern Plains, whose influence were not obvious from the teleconnection patterns and which tended to detract from correlations. Precipitation is the most difficult climate variable to match to atmospheric drivers, as indicated by the frequent weak to no teleconnections; this is likely caused by the many ways precipitation can be triggered (frontal systems, short-wave troughs, etc.) and by a random factor (e.g., convective instability). But the drivers originating in the North Pacific Ocean seemed to have the greatest influence, which one would expect from the frequent passage of closed upper-level lows originating from the Pacific.
This month illustrates how the atmospheric circulation for the month can reflect the combined influence of the mid-latitude atmospheric drivers (or modes of atmospheric variability) as opposed to those originating in the equatorial Pacific.