Note: This Synoptic Discussion describes recent weather events and climate anomalies in relation to the phenomena that cause the weather. These phenomena include the jet stream, fronts and low pressure systems that bring precipitation, high pressure systems that bring dry weather, and the mechanisms which control these features — such as El Niño, La Niña, and other oceanic and atmospheric drivers (PNA, NAO, AO, and others). The report may contain more technical language than other components of the State of the Climate series.
Summary
The strong El Niño continued during January 2016 and contributed to a stronger-than-normal Aleutian Low which energized the upper-level circulation pattern over the contiguous United States (CONUS). Several troughs and ridges migrated through the jet stream flow, some trailing strong low pressure systems which laid down expansive snow covers. Fronts and weather systems moving in the jet stream flow brought above-normal precipitation to much of the West, southern Texas, and Florida. Near- to below-normal temperatures and beneficial snow accompanied the Pacific weather systems in the West, while a westerly to northwesterly flow pattern east of the Rockies blocked Gulf of Mexico moisture, funneled cold Canadian air masses into the southern CONUS, and inhibited the development of severe weather. The above-normal precipitation and building snow pack contracted drought in the West. The upper-level circulation, temperature, and precipitation anomaly patterns suggest that the weather and climate of January 2016 were the combined result of atmospheric drivers originating over the Pacific and Arctic Oceans. See below for details.
Synoptic Discussion
 |
 |
In the Northern Hemisphere, January marks the middle of climatological winter which is the time of year when solar heating reaches a minimum with the low sun angle, arctic air masses are much colder, and an expanded circumpolar vortex forces the jet stream southward. Polar air masses influence the weather over the contiguous U.S. (CONUS) more, and the warm, dry subtropical high pressure belts influence the weather less.
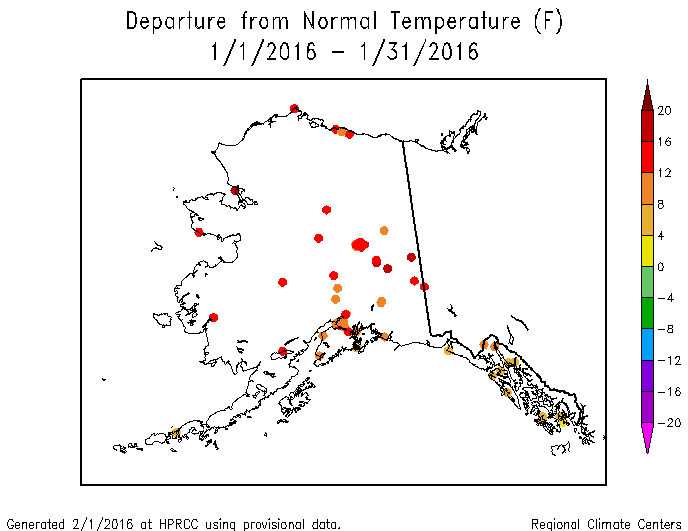
That was the case during January 2016. The strong El Niño energized the atmosphere and produced a stronger-than-normal Aleutian Low. The Aleutian Low fed an atmospheric circulation that was very active with several upper-level troughs and low pressure systems which moved across the CONUS. At the surface, this circulation pattern pushed a stream of Pacific weather systems into the western U.S., bringing above-normal precipitation to many areas. The troughs were strong and deep enough to keep temperatures below freezing, which allowed the precipitation to fall as snow and build up the much-needed mountain snow pack. The above-normal precipitation and building snow pack helped contract drought in parts of the West. The strong Aleutian Low contributed to a warm southerly flow over Alaska which resulted in a warmer-than-normal month, wetter-than-normal conditions for some southern coastal locations, and drier-than-normal conditions for much of the rest of the state.
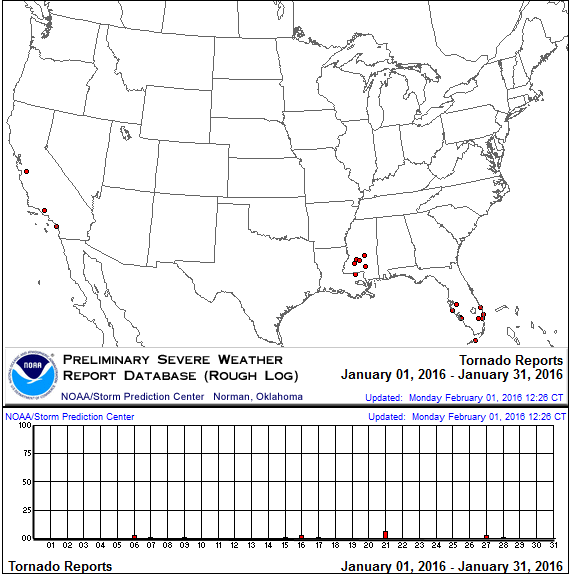
By the time the weather systems crossed the Rockies, they were moving in a predominantly westerly to northwesterly flow pattern which funneled cold Canadian air masses into the southern U.S. and frequently blocked Gulf of Mexico moisture. This resulted in a drier-than-normal month from the Plains to Midwest, and colder-than-normal month across much of the Southeast to Mid-Atlantic region, in addition to the Southwest. It also inhibited the development of severe weather. There were 20 tornadoes nationwide during January (according to preliminary reports), which is below the January average of 35. Most of the tornadoes occurred along the Gulf of Mexico coast or coastal California with closed lows and strong troughs.
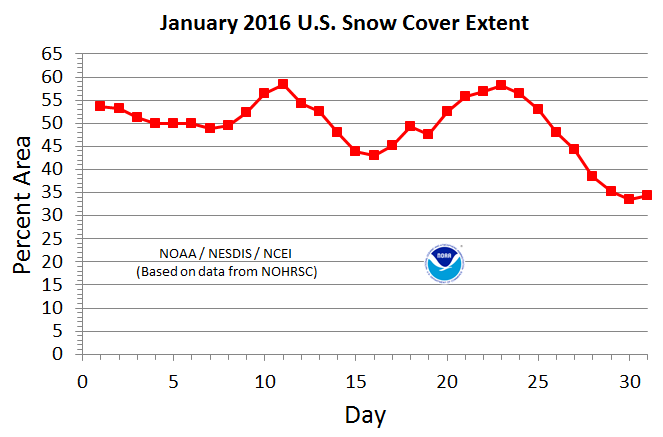
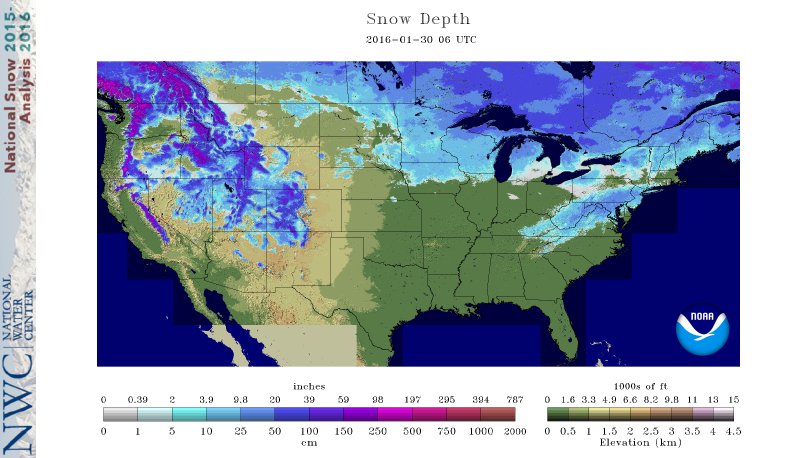
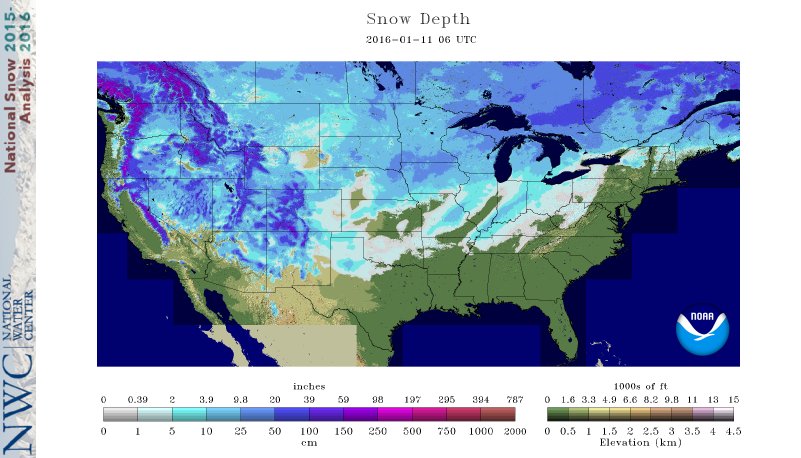
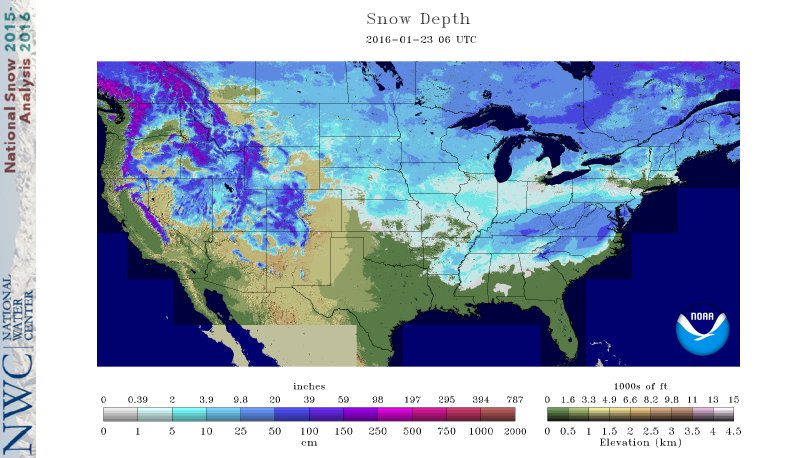
Some of the weather systems were able to tap enough moisture east of the Rockies to lay down an extensive snow cover. About half of the CONUS was snow-covered for much of the month, except the snow cover retreated to about a third of the CONUS during the last week of the month. Snow cover peaked at around 58% of the country on the 11th, when a weather system expanded snow cover across the central CONUS, and again on the 23rd when another strong weather system, drawing in Gulf of Mexico moisture, dumped heavy snow across the Southeast to Mid-Atlantic region. The combination of northwesterly flow aloft and colder-than-normal temperatures resulted in the interesting pattern in many places east of the Rockies of above-average snow cover coinciding with below-average total (rain and snow) precipitation.
The parade of troughs and ridges moving in the jet stream flow resulted in several cold and warm air masses alternating with one another in their trek across the CONUS. This resulted in weekly temperature anomalies that swung from warm to cold to warm (weeks 1, 2, 3, 4). By the end of the month, there were 1,544 record warm daily high (646) and low (898) temperature records, which is about 3 and a half times the 442 record cold daily high (286) and low (156) temperature records, with the CONUS ranking 34th warmest nationally. The REDTI (Residential Energy Demand Temperature Index) for January 2016 ranked 41st lowest in the 1895-2015 record for January, illustrating how the unusually warm temperatures in the Northeast and lack of extreme cold over the major metropolitan areas reduced heating demands.
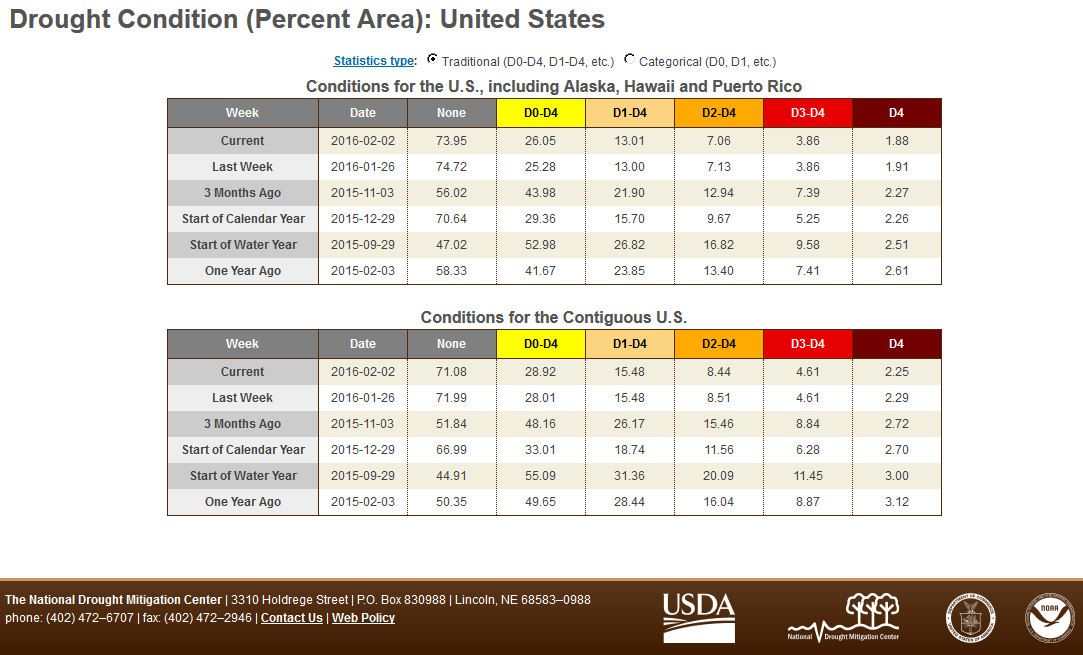
Nationally, January 2016 ranked as the 36th driest January on record. This resulted from the unusually low precipitation in many areas east of the Rockies. But the El Niño-enhanced wet conditions across much of the West helped to contract drought and abnormal dryness. Areas from Wyoming to North Dakota missed out on the precipitation, so drought and abnormal dryness expanded there. Overall, the national moderate-to-exceptional drought footprint shrank to 13.0 percent of the U.S. as a whole, and 15.5 percent of the CONUS.
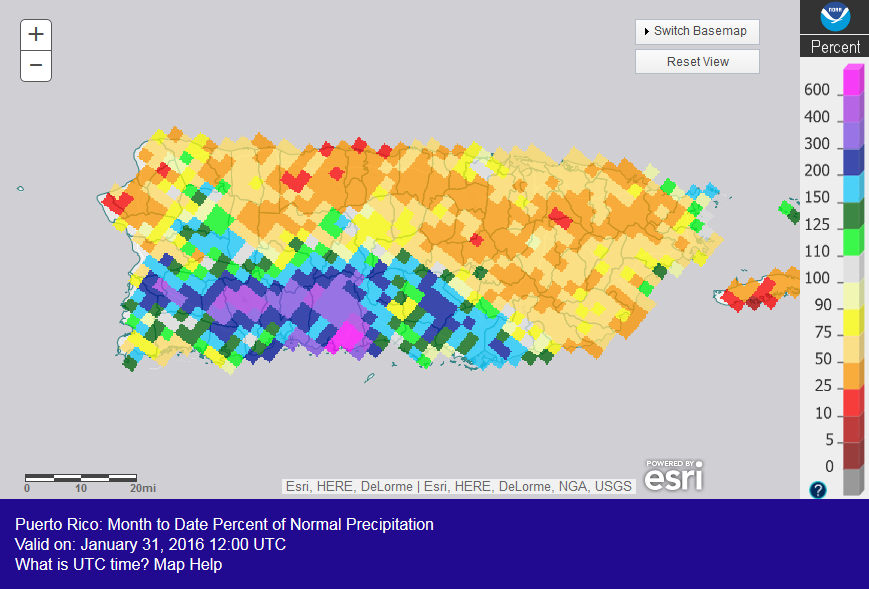
The oceanic and atmospheric conditions associated with El Niño normally enhance tropical cyclone activity in the eastern and central equatorial Pacific Ocean and inhibit tropical cyclone activity in the Atlantic. The North Pacific and Atlantic hurricane seasons usually run from May or June through November. Tropical cyclones can occur in the South Pacific throughout the year, but the usual tropical cyclone season for this basin runs from November through April. Even though this is the "dry season" for hurricanes in the Northern Hemisphere, the ongoing El Niño continued a drier-than-normal pattern across Hawaii and Puerto Rico. In January 2016, a rare hurricane (Alex) developed in the North Atlantic and Hurricane Pali occurred in the central North Pacific. Three tropical cyclones occurred in the South Pacific in January: Ula, which developed in December, continued into early January; Victor occurred near American Samoa in mid-January; and Stan developed along the northwest Australian coast near the end of the month.
 North America monthly upper-level circulation pattern and anomalies. As the troughs and ridges migrated through the jet stream flow across North America, the storm track favored troughing over the eastern CONUS, especially over the Southern Plains to Southeast, and ridging over the West. Enough troughs and lows moved across the western CONUS to counteract the ridging, but in the eastern CONUS a below-normal 500-mb height monthly anomaly pattern dominated. An above-normal 500-mb height anomaly pattern prevailed across much of Canada and Alaska, which is somewhat characteristic of a negative AO index pattern. |
 Map of monthly precipitation anomalies. January 2016 was drier than normal over Hawaii, most of Alaska and Puerto Rico, and much of the Great Plains to east coast. It was wetter than normal across much of the West, southern Texas, and much of Florida. |
 Map of monthly temperature anomalies. January 2016 was warmer than normal across Alaska, New England, and parts of the Central to Northern Plains and Great Lakes, and cooler than normal across the Southwest, Southern Plains, and Southeast to Mid-Atlantic states. |
Northern Hemisphere monthly upper-level circulation pattern and anomalies.
Atmospheric Drivers
Subtropical highs, and fronts and low pressure systems moving in the mid-latitude storm track flow, are influenced by the broadscale atmospheric circulation. The circulation of the atmosphere can be analyzed and categorized into specific patterns. The Tropics, especially the equatorial Pacific Ocean, provides abundant heat energy which largely drives the world's atmospheric and oceanic circulation. The following describes several of these modes or patterns of the atmospheric circulation, their drivers, the temperature and precipitation patterns (or teleconnections) associated with them, and their index values this month:
-
El Niño Southern Oscillation (ENSO)
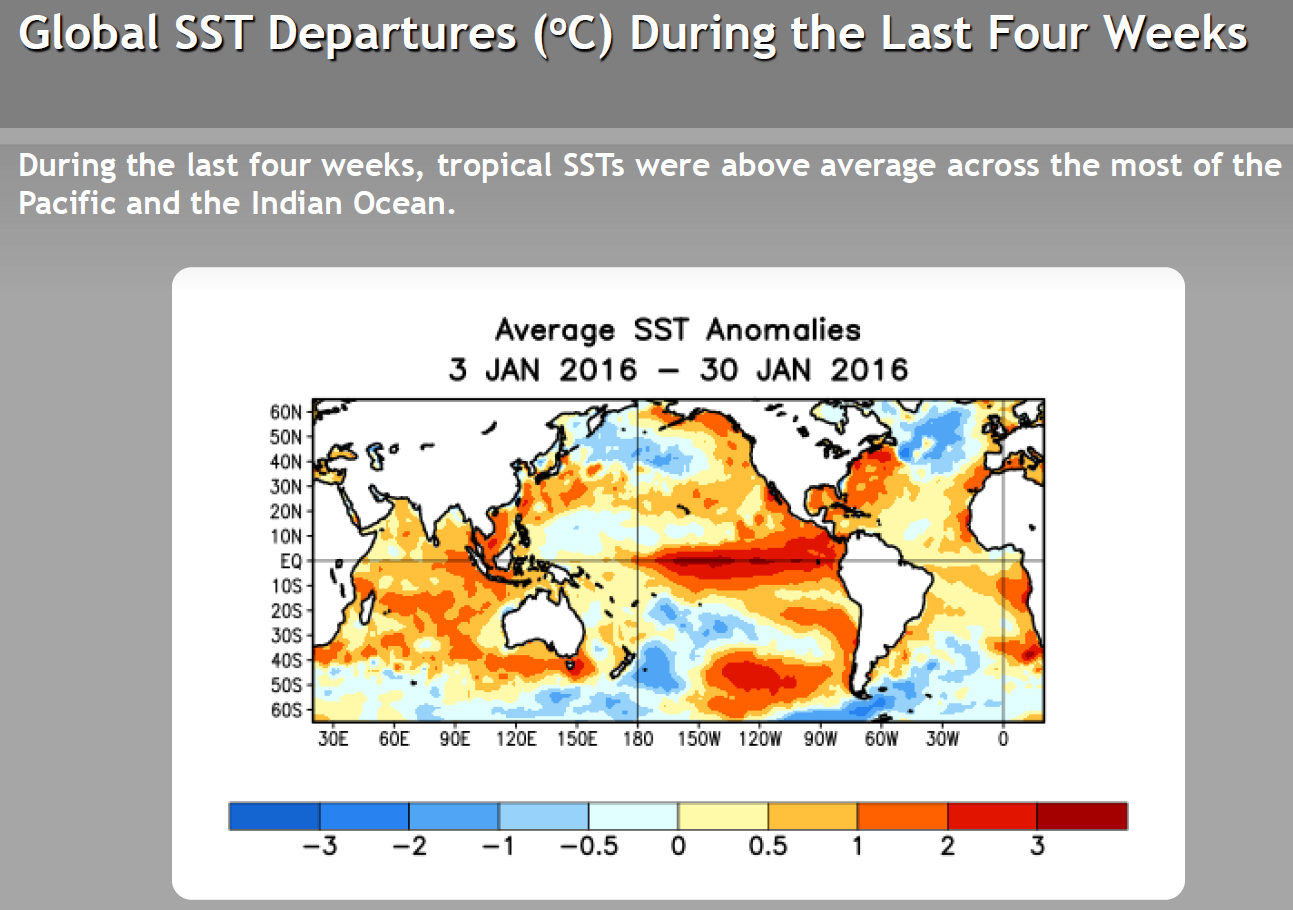
- Description: Oceanic and atmospheric conditions in the tropical Pacific Ocean can influence weather across the globe. ENSO is characterized by two extreme modes: El Niño (warmer-than-normal sea surface temperature [SST] anomalies in the tropical Pacific) and La Niña (cooler-than-normal SST anomalies), with the absence of either of these modes termed "ENSO-neutral" conditions.
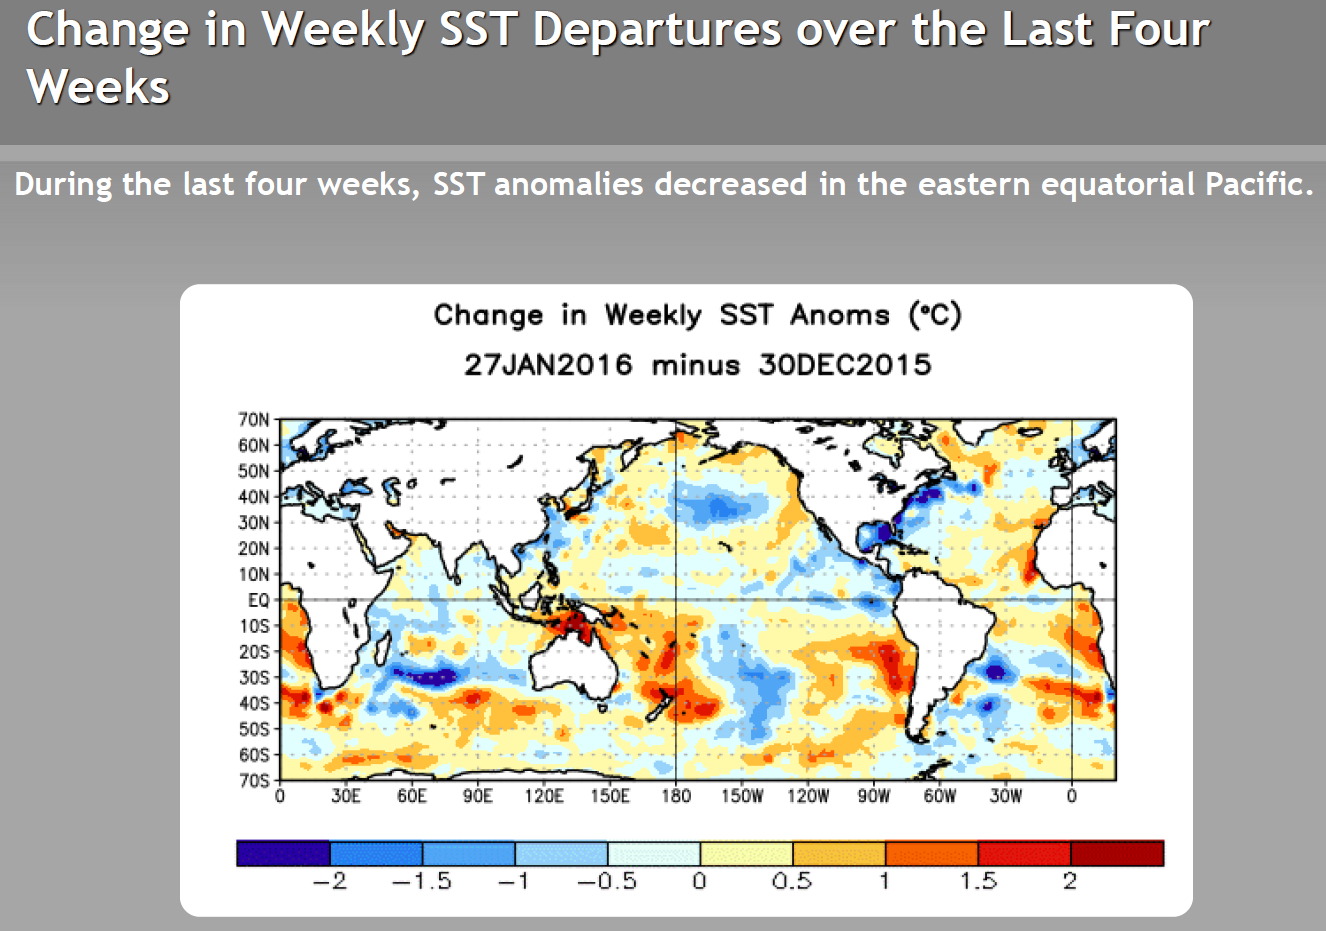
- Status: During January 2016, El Niño conditions were observed as above-average SSTs continued across the western and central equatorial Pacific and continued to be coupled to the tropical atmosphere. Collectively, the atmospheric and oceanic features reflected strong El Niño.
- Teleconnections (influence on weather): To the extent teleconnections are known, the typical temperature and precipitation patterns associated with El Niño during January include above-normal precipitation along the West Coast, Gulf of Mexico Coast, and East Coast; below-normal precipitation in parts of the interior West and Central Plains to Midwest; below-normal temperatures in the southern tier states and Mid-Atlantic to parts of the Northeast; and above-normal temperatures in the interior Northwest.
- Comparison to Observed: The January 2016 temperature anomaly pattern is a good match with that expected historically with an El Niño in most areas. The precipitation anomaly pattern agrees along the West Coast, South Texas, Florida, and the Central Plains to Mid-Mississippi Valley, but does not agree along the East Coast.
-
Madden-Julian Oscillation (MJO)
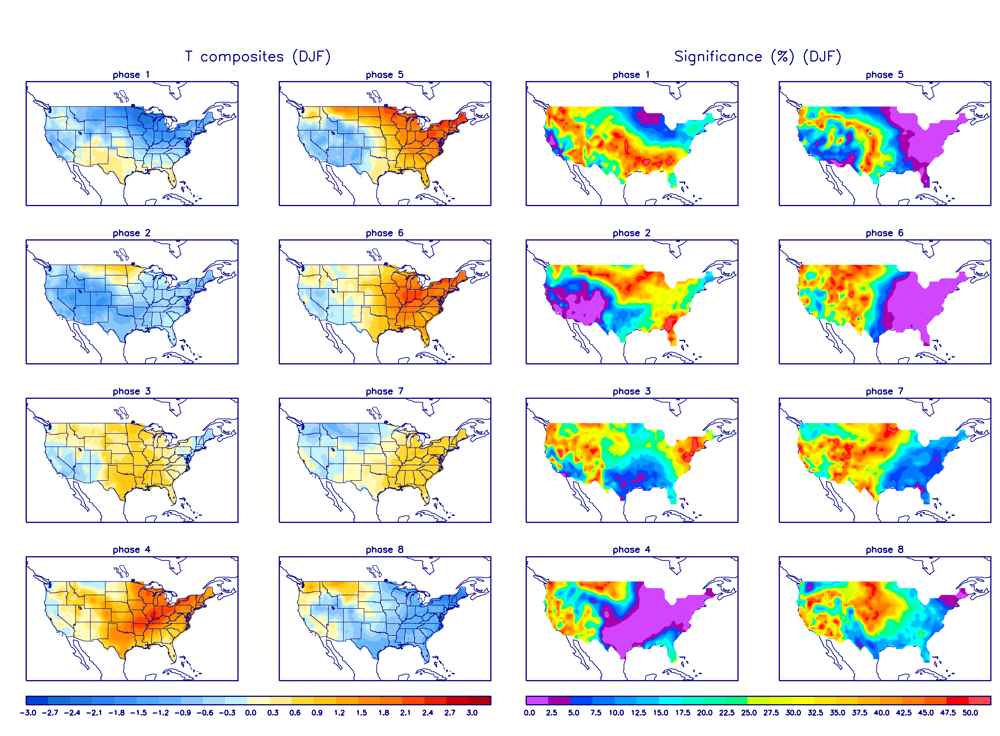
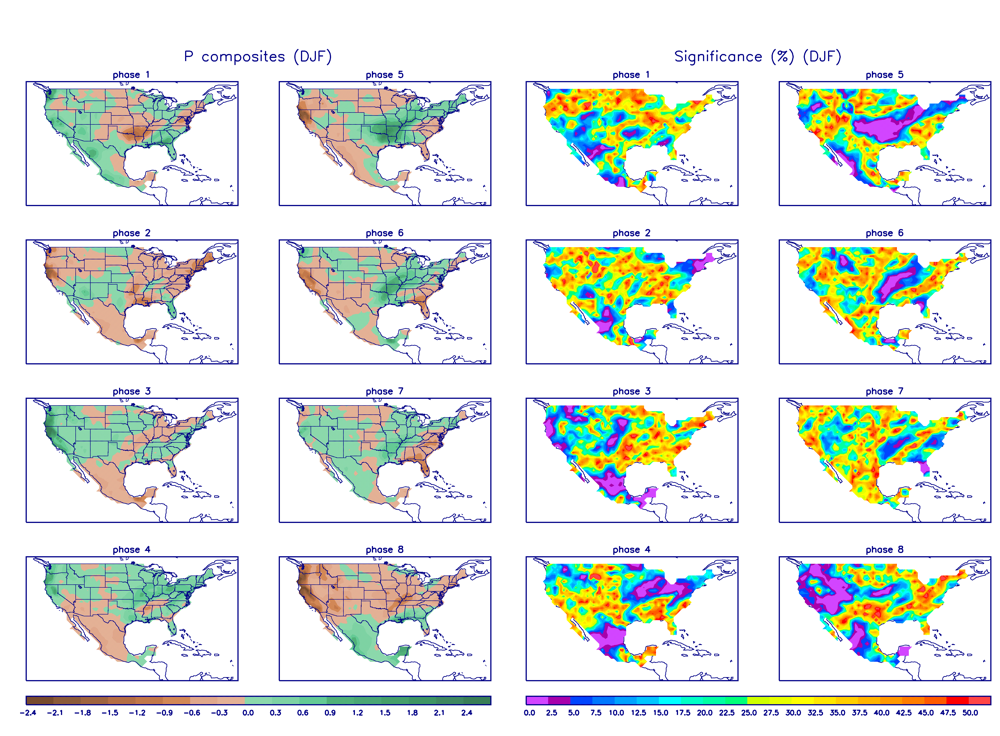
- Description: The MJO is a tropical disturbance or "wave" that propagates eastward around the global tropics with a cycle on the order of 30-60 days. It is characterized by regions of enhanced and suppressed tropical rainfall. One of its indices is a phase diagram which illustrates the phase (1-8) and amplitude of the MJO on a daily basis. The MJO is categorized into eight "phases" depending on the pattern of the location and intensity of the regions of enhanced and suppressed tropical rainfall. The MJO can enter periods of little or no activity, when it becomes neutral or incoherent and has little influence on the weather. Overall, the MJO tends to be most active during ENSO-neutral years, and is often absent during moderate-to-strong El Niño and La Niña episodes.
- Status: The MJO index started the month in phase 7, progressed into phase 8 then weakly through phases 1 and 2, ending the month incoherent. Early in the month, the MJO constructively interfered with the El Niño, enhancing precipitation over the equatorial central Pacific. Later in the month, the MJO destructively interfered with the El Niño, which may have contributed to it becoming incoherent. Other modes of coherent subseasonal tropical variability, including the background El Niño state and Kelvin wave activity, also influenced the tropical Pacific and global climate (MJO updates for January 4, 11, 18, 25, and February 1).
- Teleconnections (influence on weather): The MJO's temperature and precipitation teleconnections to U.S. weather depend on time of year and MJO phase. To the extent teleconnections are known, the December-February teleconnections for temperature are shown here and for precipitation are shown here.
- Comparison to Observed: The MJO is transitory and can change phases (modes) within a month, so it is more closely related to weekly weather patterns than monthly. In the case of January 2016, the monthly temperature temperature anomaly pattern matches that expected with MJO phase 8, except from the Northern Plains to New England, but the weekly temperature anomaly maps do not match the patterns expected with phases 7, 8, 1, or 2. The teleconnection anomaly patterns vary significantly for phases 7, 8, 1, and 2, which makes it difficult to determine agreement with the weekly or monthly precipitation anomaly patterns.
- The Pacific/North American (PNA) pattern
- Description: The PNA teleconnection pattern is associated with strong fluctuations in the strength and location of the East Asian jet stream. PNA-related blocking of the jet stream flow in the Pacific can affect weather downstream over North America, especially the West and especially in the winter half of the year.
- Status: The daily PNA index was positive, averaging positive for the month as a whole. The 3-month-averaged index was also positive.
- Teleconnections (influence on weather): To the extent teleconnections are known, a positive PNA for this time of year (January on the teleconnection maps) is correlated with below-normal temperatures over the Southern Plains to East Coast; above-normal temperature anomalies along the West Coast and across western Canada and Alaska; below-normal precipitation in the Pacific Northwest and much of the CONUS from the Mississippi River to East Coast; above-normal upper-level circulation anomalies over western North America; and below-normal circulation anomalies over the Southern Plains to East Coast and over the North Pacific.
- Comparison to Observed: The January 2016 temperature anomaly pattern agrees with that expected with a positive PNA across Alaska and most of the CONUS (except New England). The upper-level circulation anomaly pattern agrees over the North Pacific and southeastern CONUS, but appears shifted to the north over the western CONUS. The precipitation anomaly pattern agrees for the eastern CONUS, but not in the Pacific Northwest.
- The Arctic Oscillation (AO) pattern
- Description: The AO teleconnection pattern relates upper-level circulation over the Arctic to circulation features over the Northern Hemisphere mid-latitudes and is most active during the cold season.
- Status: The daily AO index was negative for most of the month, ending the month positive, but averaged negative for the month. The 3-month-averaged index was still positive.
- Teleconnections (influence on weather): To the extent teleconnections are known, a negative AO this time of year (December-February) is typically associated with dry conditions from the Southern Plains to Ohio Valley and part of the Southwest; wet conditions in northern California and part of New England; below-normal temperatures for most of the country east of the Rockies; and upper-level circulation anomalies which are below normal in the North Central Pacific, central to eastern CONUS, Western Europe, and across the North Atlantic, and above normal over the Arctic Ocean, Greenland, and northern Alaska.
- Comparison to Observed: The January 2016 monthly temperature anomaly pattern matches the teleconnections with a negative AO in the Southeast, but not in the northern tier states. The upper-level circulation anomaly pattern is a good match, but appears shifted in places. The monthly precipitation anomaly pattern agrees in northern California and the Southern Great Plains to Ohio Valley, but not in the Southwest or New England.
- The North Atlantic Oscillation (NAO) pattern
- Description: The NAO teleconnection pattern relates upper-level circulation over the North Atlantic Ocean to circulation features over the Northern Hemisphere mid-latitudes.
- Status: The daily NAO index was positive then negative then positive, averaging near zero for the month. The 3-month-averaged index was positive.
- Teleconnections (influence on weather): There are no teleconnections for a neutral NAO.
- Comparison to Observed: The January 2016 temperature and upper-level circulation anomaly patterns do not match those expected for either a positive or negative NAO. There are few to no teleconnections for the January 2016 precipitation anomaly pattern to compare to.
- The West Pacific (WP) pattern
- Description: The WP teleconnection pattern is a primary mode of low-frequency variability over the North Pacific and reflects zonal and meridional variations in the location and intensity of the (East Asian) jet stream in the western Pacific.
- Status: The monthly WP index and three-month average WP index were both positive.
- Teleconnections (influence on weather): To the extent teleconnections are known, a positive WP during this time of year (January on the maps) is typically associated with above-normal temperatures in the Midwest to Northeast and southeastern Canada; below-normal temperatures in the Southwest; above-normal precipitation from Oklahoma to the Ohio Valley; above-normal circulation anomalies over the eastern CONUS and eastern Canada; and below-normal circulation anomalies over the western CONUS.
- Comparison to Observed: The January 2016 monthly temperature anomaly pattern is a good match with that expected with a positive WP, except it seems shifted a little. The precipitation and upper-level circulation anomaly patterns do not agree with those expected with a positive WP.
- The Tropical/Northern Hemisphere (TNH) pattern
- Description: The TNH teleconnection pattern reflects large-scale changes in both the location and eastward extent of the Pacific jet stream, and also in the strength and position of the climatological mean Hudson Bay Low, and is dominant in the winter months. The pattern significantly modulates the flow of marine air into North America, as well as the southward transport of cold Canadian air into the north-central United States.
- Status: The TNH index was slightly negative during January.
- Teleconnections (influence on weather): To the extent teleconnections are known, a negative TNH is typically associated with warmer-than-normal temperatures for much of the country, wetter-than-normal conditions in the West, and slightly drier-than-normal conditions in the Tennessee Valley. The upper-level circulation anomalies for a negative TNH are above-normal 500-mb geopotential heights over the eastern two-thirds of Canada and the north central U.S., and below-normal heights over the northeastern Pacific and Gulf of Mexico into the western North Atlantic.
- Observed: The January 2016 monthly upper-level circulation anomaly pattern has good agreement with that expected with a negative TNH, and the precipitation anomaly pattern agrees where teleconnections exist, but the temperature anomaly pattern shows no agreement.
- The East Pacific-North Pacific (EP-NP) pattern
- Description: The EP-NP teleconnection pattern relates SST and upper-level circulation patterns (geopotential height anomalies) over the eastern and northern Pacific to temperature, precipitation, and circulation anomalies downstream over North America. Its influence during the winter is not as strong as during the other three seasons.
- Status: The January SSTs showed a continued cooling trend in the central North Pacific just east of the International Dateline, but warmed slightly along the North American coast. The resulting SST anomaly pattern was cooler than normal in the central North Pacific, roughly located beneath the stronger-than-normal Aleutian Low, and continued warmer than normal along the North American coast and across the North Pacific at approximately 20 to 30 degrees North latitude. The January monthly EP-NP index and 3-month running mean were both slightly negative.
- Teleconnections (influence on weather): To the extent teleconnections are known, a negative EP-NP index during this time of year (between October and April on the maps) is typically associated with warmer-than-normal temperatures across central to eastern Canada and across the CONUS east of the Rockies (except for the Southeast), and cooler-than-normal temperatures across Alaska and the extreme West Coast of the CONUS; below-normal upper-level circulation anomalies (weaker upper-level ridge) over Alaska and western Canada, and above-normal upper-level circulation anomalies (weaker upper-level trough) over the CONUS east of the Rockies, eastern Canada, and the central North Pacific. The precipitation teleconnections are too weak to be mapped in any detail.
- Comparison to Observed: The January 2016 temperature and upper-level circulation anomaly patterns do not agree with the teleconnections for a negative EP-NP over the CONUS. The precipitation anomaly pattern has very few teleconnections to compare to.
Examination of the available circulation indices and their teleconnection patterns, and comparison to observed January 2016 temperature, precipitation, and circulation anomaly patterns, suggest that the weather over the CONUS in January reflected influences from Arctic and Pacific atmospheric drivers. The El Niño is pumping energy and moisture from the tropical Pacific into the mid-latitudes, priming the atmosphere for action. This energy was reflected in an intense Aleutian Low over the north central North Pacific, as well as in positive values for the PNA and WP indices. The January 2016 temperature anomaly pattern is a generally good match for the temperature teleconnections associated with El Niño, PNA, and WP, suggesting that the Pacific drivers played an important role in January's weather. The January precipitation anomaly pattern shows good agreement with that expected during an El Niño, but it also showed some agreement with that expected during a negative AO, and the upper-level circulation anomaly pattern had general agreement with those expected with a positive PNA and a negative AO, suggesting the importance of the Pacific and Arctic drivers. The weak or near-zero values for the NAO and EP-NP indices, and the lack of agreement with the teleconnections, indicate that their drivers did not play an important role in January's weather. The lack of agreement between the January anomaly patterns and the teleconnections suggests that the MJO also did not play an important role. The TNH index value was weak, but the good agreement between the circulation anomaly pattern and the teleconnections suggests its drivers were important, or maybe the agreement just reflected the combined influence of the Pacific and Arctic drivers.
This month illustrates how the weather and climate anomaly patterns can reflect the influence of several atmospheric drivers (or modes of atmospheric variability), especially when they appear to be in sync with each other.