National Overview

August Highlights


August Temperature
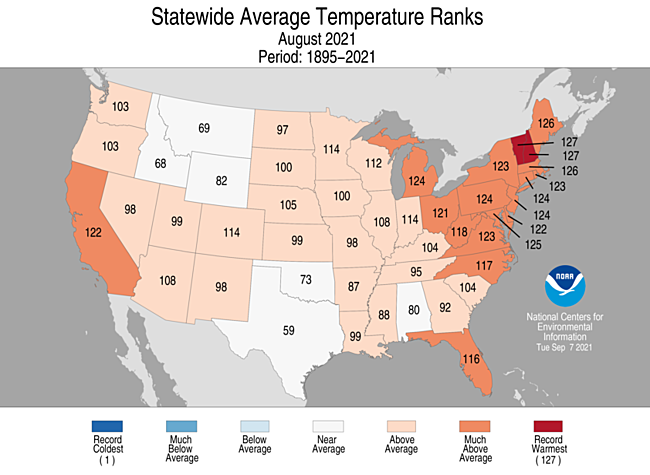
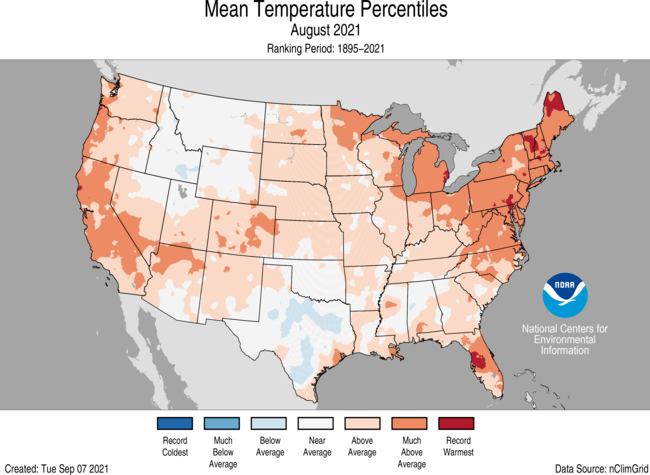
- The August contiguous U.S. temperature was 74.0°F, 1.9°F above the 20th century average and ranked as the 14th-warmest August on record.
- August temperatures were above average across the West Coast, Southwest and from the Plains to the East Coast. Vermont and New Hampshire both had their warmest August on record while Maine and Massachusetts ranked second warmest. Much of the above-average warmth can be attributed to warm overnight temperatures. Temperatures were near to below average across much of the northern Rockies and the southern Plains.
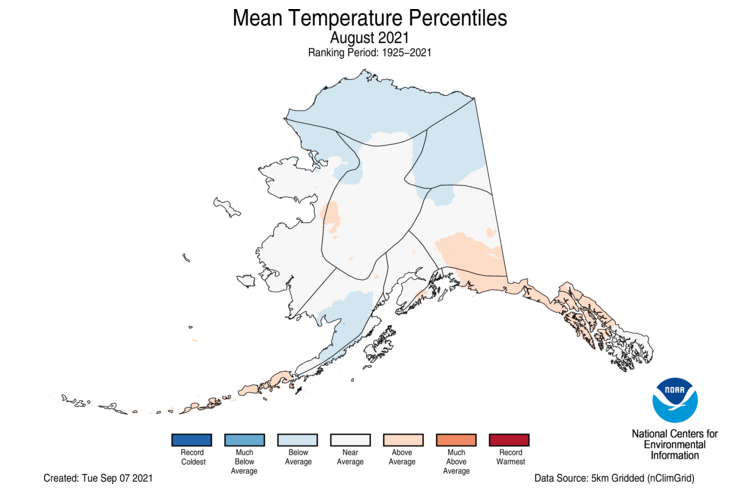
- The Alaska average August temperature was 49.4°F, 0.1°F above the long-term mean, ranking in the middle third of the 97-year period of record for the state. Temperatures were above average across portions of the Southeast Interior, Panhandle and Aleutian regions. Temperatures were cooler than average across the North Slope, Northeast Interior, northern West Coast and parts of Bristol Bay. A persistent cold low-pressure system over the northern Chukchi-Beaufort Seas during August contributed to the cooler-than-average temperatures and the largest observed sea ice extent over the Chukchi Sea since 2006.
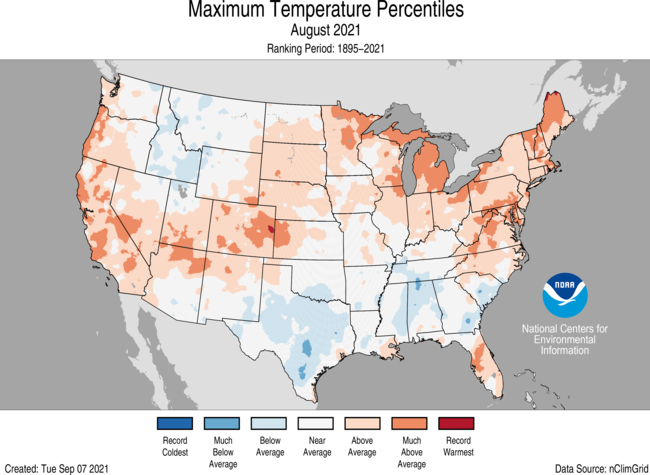
- The nationally averaged maximum (daytime) temperature was warmer than average during August at 86.3°F, 1.2°F above average, ranking in the warmest third of the 127-year record. Daytime temperatures were above average along the West Coast and from the Four Corners to the Great Lakes and into the Northeast. Portions of the Mid-Atlantic and Gulf Coast also experienced warm daytime high temperatures during August. Temperatures were below-average across portions of the northern Rockies, Deep South and Southeast.
- The nationally averaged minimum (nighttime) temperature during August was 61.7°F, 2.6°F above average, ranking fourth warmest in the 127-year record. Maryland, Vermont, New Hampshire and Maine ranked warmest on record while six additional East Coast states ranked second warmest for overnight temperatures during August. Portions of the Rocky Mountains, Plains and Midwest experienced near-average overnight temperatures.
- As of September 7, there were 6,303 warm daily high (1,789) and low (4,514) temperature records tied or broken during August. This was roughly 2.5 times the 2,525 daily cold high (1,769) and low (756) temperature records set during the month.
- Based on NOAA's Residential Energy Demand Temperature Index (REDTI), the contiguous U.S. temperature-related energy demand during August was 204 percent of average and ranked fourth highest in the 127-year period of record.
August Precipitation
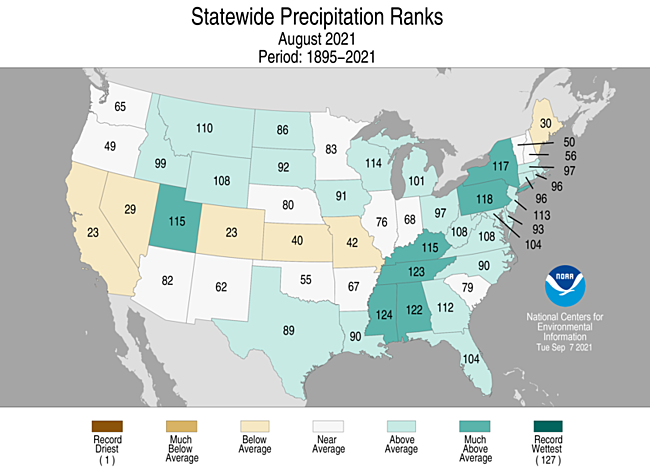
- The August precipitation total for the contiguous U.S. was 3.09 inches, 0.47 inch above average ranking 14th wettest in the 127-year period of record.
- Precipitation was above average across portions of the central and northern Rockies, the northern Plains, Great Lakes and from the Deep South to southern New England. Mississippi ranked fourth wettest while Tennessee had its fifth-wettest August on record. The Southwest monsoon continued to be active in August, eliminating much of the year-to-date precipitation deficit across the region. Tucson, Arizona, had its wettest August and second-wettest summer on record. Precipitation was below average across portions of the West, southern Rockies, central Plains, Midwest, northern Great Lakes and northern New England.
- Statewide precipitation for Alaska was above average for August, but varied by region. Precipitation was below average across the Aleutians, Bristol Bay and Northwest Gulf regions while the interior regions, Northeast Gulf and Panhandle regions experienced above-average precipitation for the month.
- According to the August 31 U.S. Drought Monitor report, approximately 46.6 percent of the contiguous U.S. was in drought, slightly more than the coverage at the beginning of August. Drought conditions expanded or intensified across the Northern Tier, the Pacific Northwest and portions of California. Drought coverage and/or intensity lessened across parts of the Four Corners region, the Midwest, Hawaii and Puerto Rico and was eliminated in Alaska.
Extremes
- Tropical Storm Fred made landfall near Cape San Blas, Florida, on August 16. Fred brought torrential flooding to the southern Appalachian Mountains with more than a foot of rainfall reported in some locations of western North Carolina. At least 5 fatalities were associated with this event. Fred also spawned nearly a dozen tornadoes across the Northeast as it moved its way up the East Coast.
- On August 21, a complex of heavy storms trained over one another across middle Tennessee and brought torrential rainfall to Dickson, Hickman, Houston and Humphrey counties. Reports of more than 17 inches of rain fell in a 24-hour period. If verified by the State Climate Extremes Committee, this would be the largest known 24-hour rainfall event in Tennessee history.
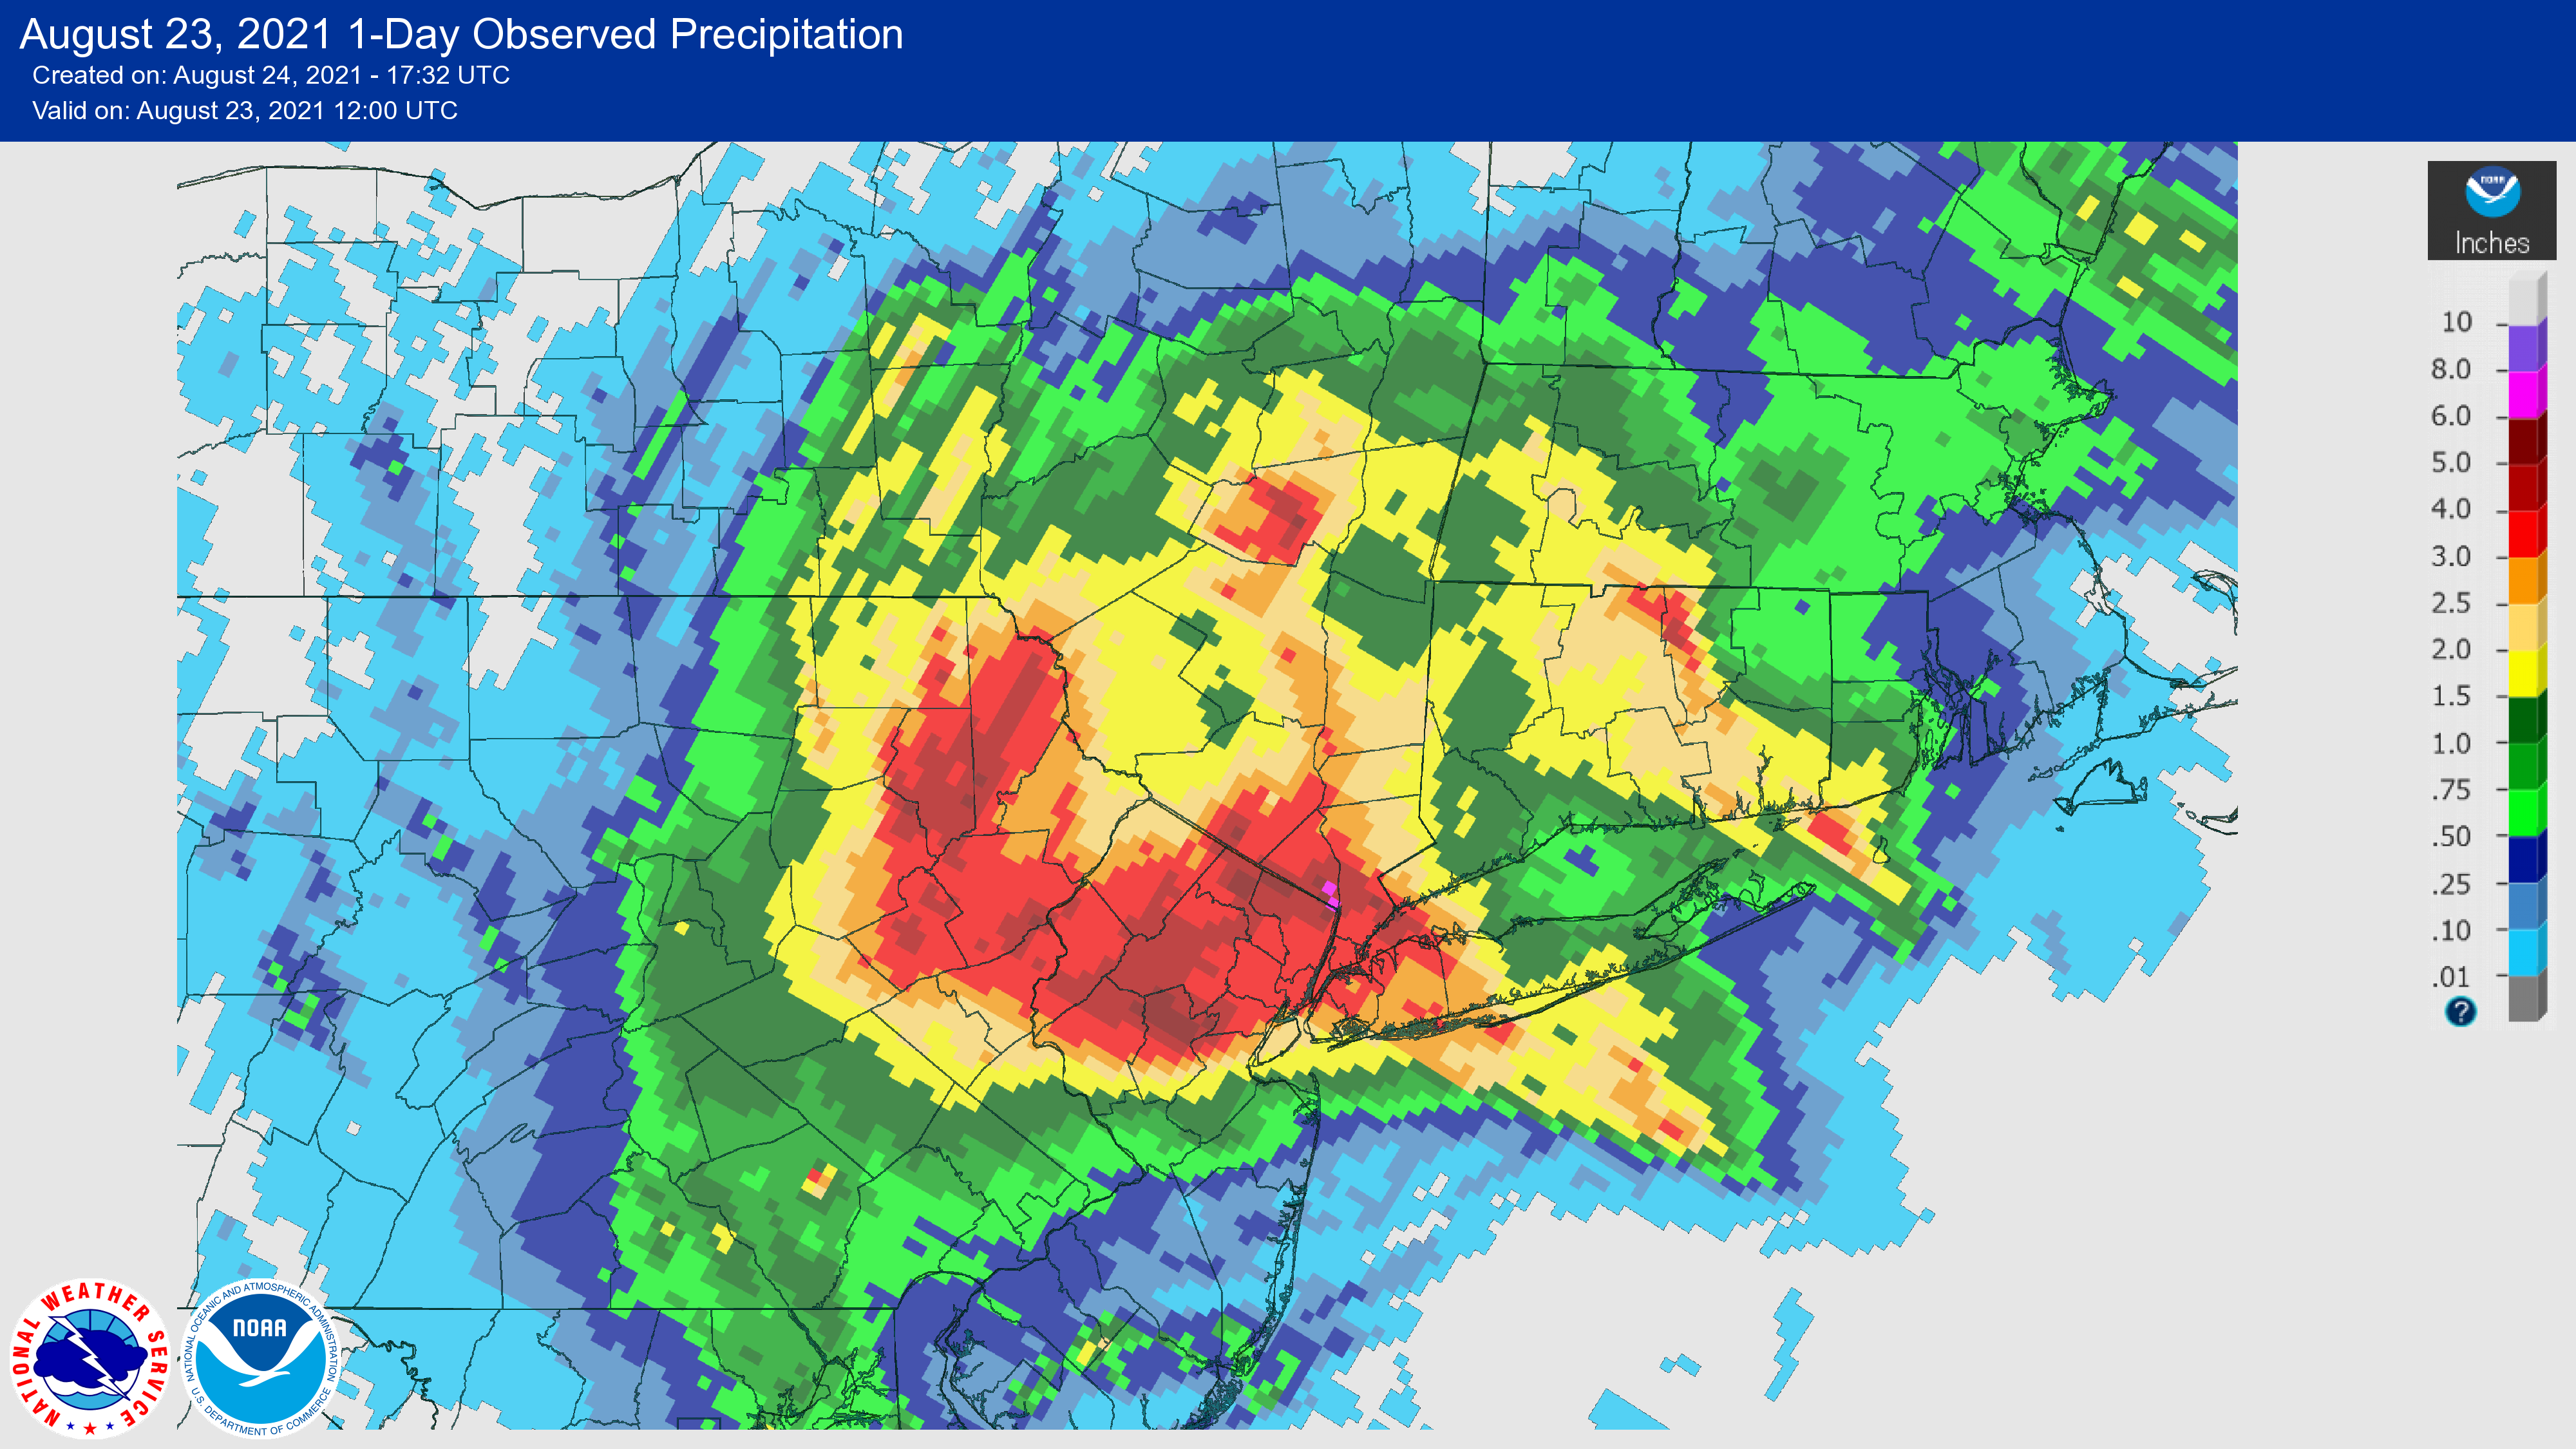
- On August 22, Hurricane Henri made landfall near Westerly, Rhode Island, as a strong tropical storm and brought widespread 5 to 9 inch rainfall totals to portions of New York, New Jersey and Pennsylvania as it meandered for several days before moving off the East Coast. Many locations across the region experienced flash flooding, evacuations, road closures and water rescues.
- The water shortage in the Colorado River Basin is apparent from the record low water level on Lake Mead, triggering the Bureau of Reclamation to enact a Level 1 water shortage for Arizona, Nevada and New Mexico. Several other large lakes and reservoirs in the West are at record low levels including Lake Oroville, in northern California (since 1977), the Great Salt Lake in Utah and Lake Powell (since the 1960s).
- On August 29, Category 4 Hurricane Ida made landfall near Port Fourchon, Louisiana with 150-mph sustained winds. This ties for the fifth-strongest landfalling hurricane to hit the contiguous U.S. and the second year in a row that a Category 4 hurricane hit Louisiana. More than 1 million residents, and all of New Orleans, were without power. Some communities were told power would likely not be restored for many days.
- Grand Isle took a direct hit with 100% of homes damaged and nearly 40% of homes nearly-to-completely destroyed. Many people across coastal Louisiana were trapped in their homes as storm surge rose 6 feet or more in some communities.
- As the remnants of Ida moved northeast, impacts, including heavy rainfall, wind damage and flooding, were felt from the Gulf Coast to the Northeast by month’s end.
- As September began, a frontal system merged with the remnants of Ida creating severe weather and flash flooding across a wide swath of the region from eastern Pennsylvania to New York. For the first time on record, flash flood emergencies were declared in New Jersey and New York. Large areas of 6 to 8 inches of rain fell across portions of Pennsylvania and New Jersey. Additional impacts from the remnants of Hurricane Ida will be summarized in the September 2021 national climate report.
Summer Highlights

June-August Temperature
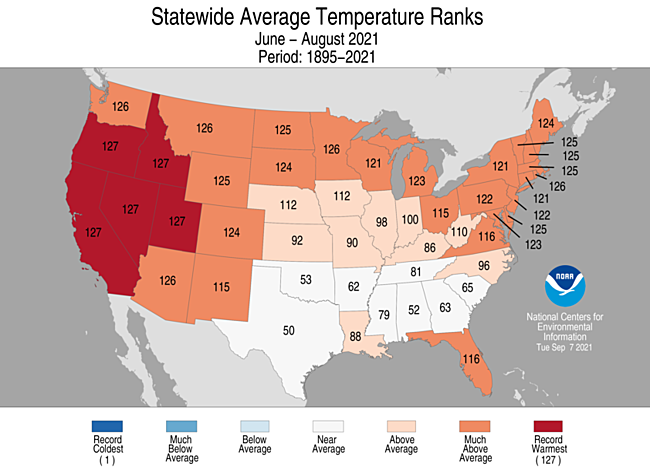
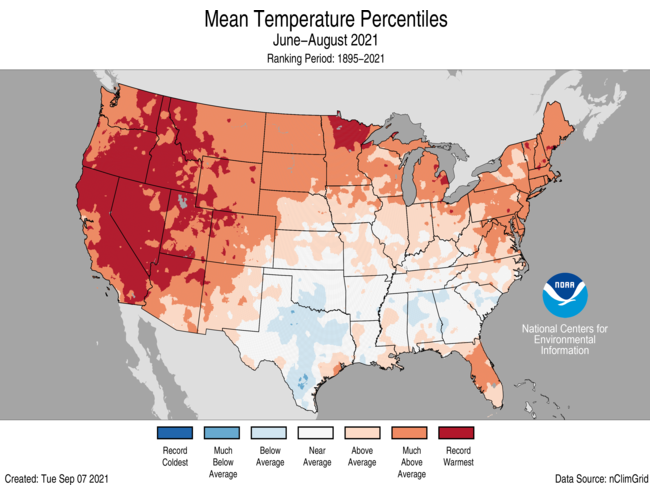
- During meteorological summer (June-August), the average temperature for the Lower 48 was 74.0°F, 2.6°F above average. This technically exceeds the extreme heat of the Dust Bowl summer of 1936, but the difference is extremely small (less than 0.01°F), suggesting that 2021 essentially ties for the warmest summer on record. A record 18.4 percent of the contiguous U.S. experienced record-warm temperatures for the season.
- Summer temperatures were above average to record warmest from the West Coast to the Great Lakes and into the Northeast as well as across portions of the Mid-Atlantic and Gulf Coast. Temperatures were below average across portions of the southern Plains and Southeast. California, Nevada, Utah, Oregon and Idaho each reported their warmest June-August on record. Sixteen additional states had a top-five warmest summer on record. No state ranked below average for the summer season.
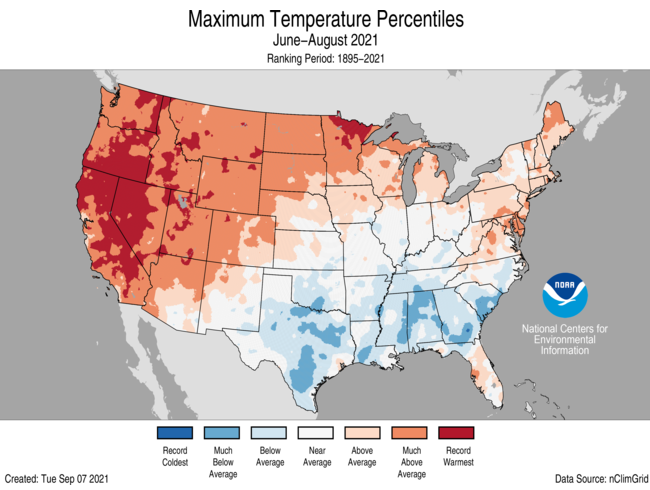
- The contiguous U.S. average maximum (daytime) temperature during June-August was 86.5°F, 2.2°F above the 20th century average, ranking eighth warmest on record. California, Nevada, Utah, Oregon and Idaho each experienced their warmest summer for daytime temperatures. Above-average to record-warm maximum temperatures were observed from the West to the Great Lakes and from the Mid-Atlantic region to New England as well as across portions of Florida. Temperatures were below average across much of the Deep South and Southeast.
- The contiguous U.S. June-August minimum (nighttime) temperature was 61.5°F, 3.1°F above average, and ranked warmest on record. Above-average to record warm minimum temperatures were observed across nearly all of the Lower 48 states. Nine states across the West and Northeast each had their warmest summer for minimum temperatures. Warm overnight temperatures heavily influenced the warm summer temperatures, especially across portions of the Southeast, where daytime temperatures were below average for the season.
- The Alaska statewide average temperature for the summer was 51.4°F, 1.0°F above average and ranked in the warmest one-third of the 97-year record. Temperatures were warmer than average across much of the eastern half of the state as well as across the Aleutians and near average for much of the rest of the state.
- Based on NOAA's Residential Energy Demand Temperature Index (REDTI), the contiguous U.S. temperature-related energy demand during June-August was 190 percent above average and ranked as the ninth highest value in the 127-year period of record.
June-August Precipitation

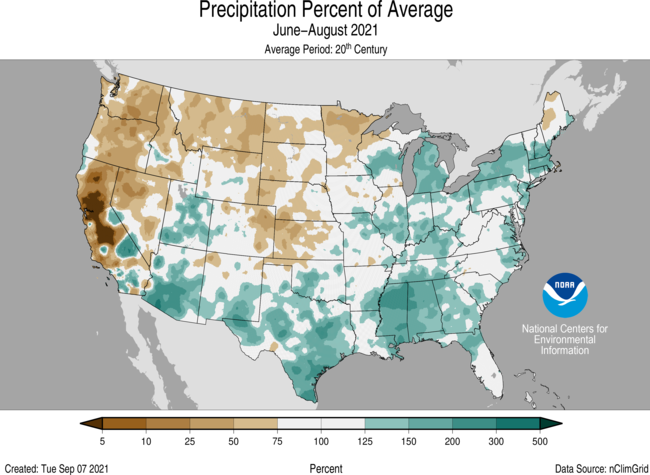
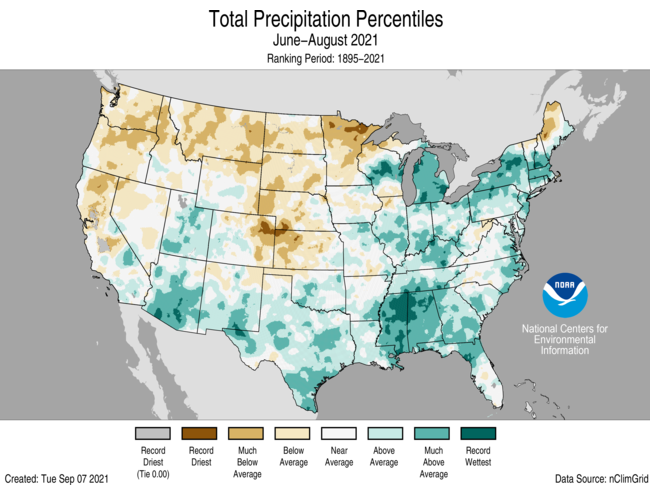
- The summer precipitation total for the CONUS was 9.48 inches, 1.16 inch above average, ranking eighth wettest in the historical record.
- Precipitation was above-average across portions of the Great Basin and Southwest, from the southern Plains to the Great Lakes and across much of the eastern U.S. Mississippi had its wettest summer on record with Alabama, Michigan, New York and Massachusetts ranking among their five wettest summers on record. Precipitation was below average from the Northwest to the western Great Lakes and into the central Plains. Minnesota had its seventh-driest summer on record.
- Precipitation in Alaska was above average across much of the northern half of the state as well as across portions of the Northeast Gulf and Panhandle regions. Precipitation was below average in the southwestern portion of the state. Kotzebue had its wettest summer on record, reporting 9.21 inches and besting the previous record, set in 1963, by nearly an inch. The wildfire season was well-below average with only 254,000 acres consumed — less than half of the median value.
June-August Extremes
- The U.S. Climate Extremes Index (USCEI) for summer was double average and ranked highest in the 112-year period of record. On a national scale, elevated extremes in warm maximum and minimum temperatures as well as dry PDSI were the main contributors to this record value. The USCEI is an index that tracks extremes (falling in the upper or lower 10 percent of the record) in temperature, precipitation and drought across the contiguous United States.
- On the regional scale, extremes across the Northwest and West ranked highest on record and were due primarily to record extent of extremes in warm maximum and minimum temperatures as well as record high dry PDSI for the Northwest. Both the Northeast and the Southwest also experienced a record level of extremes in warm minimum temperatures.
Year-to-Date Highlights
January-August Temperature
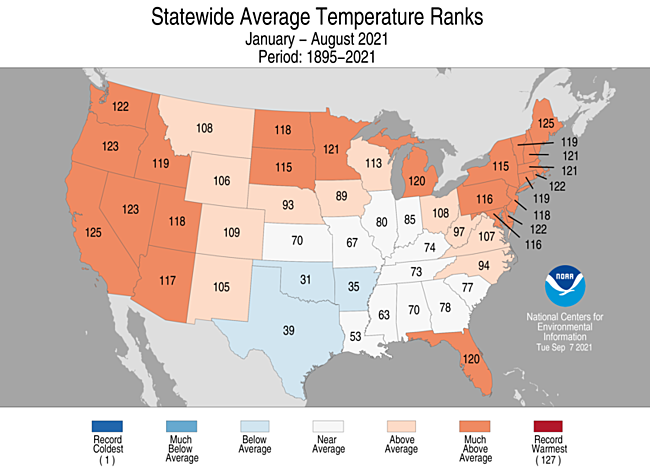
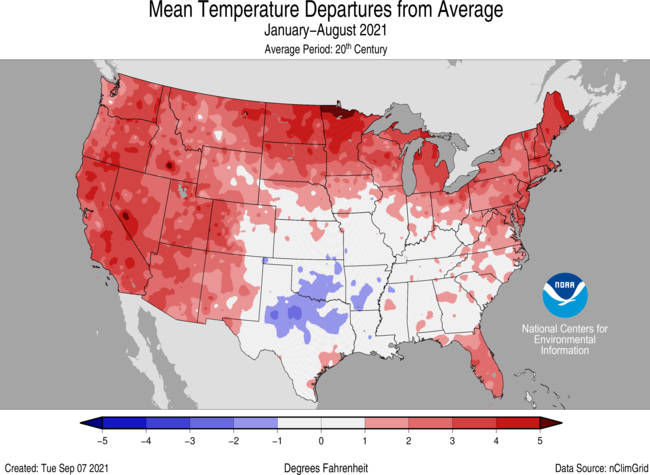
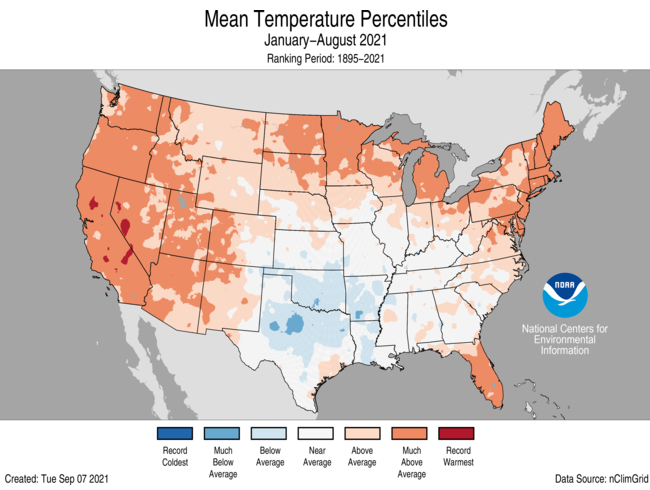
- For the year to date, the national temperature was 55.6°F, 1.8°F above average, ranking 13th warmest in the historical record.
- Year-to-date temperatures were above average from the West Coast to the Great Lakes and into the Northeast as well as across parts of the Mid-Atlantic and Southeast. California and Maine each reported their third-warmest January-August on record. Sixteen additional states had a top-ten warmest year-to-date period. Temperatures were below average across much of the southern Plains and lower Mississippi Valley.
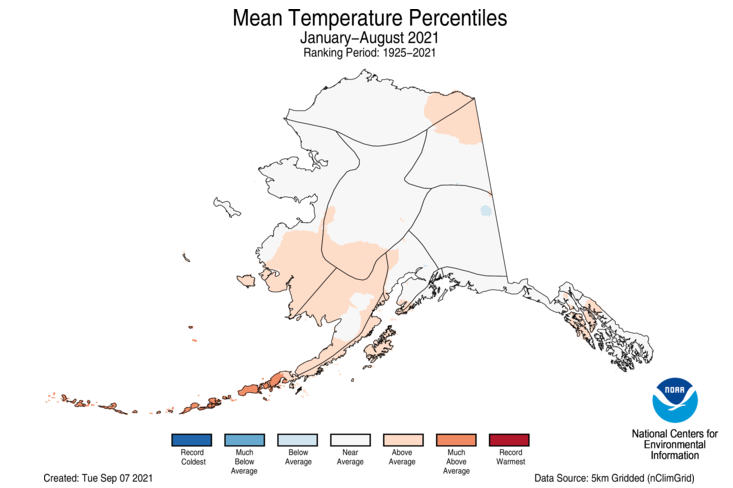
- Year-to-date statewide temperatures for Alaska were near average with above-average temperatures observed across the southwestern portion of the state. Much of the rest of the state experienced near average temperatures for this period.
- The contiguous U.S. average maximum (daytime) temperature during January-August was 67.5°F, 1.5°F above the 20th century average, ranking 17th warmest in the 127-year record. Above- to much-above-average maximum temperatures were observed from the Rocky Mountains to the West Coast, across the northern Plains and from the Great Lakes to the Northeast and across portions of Florida. Daytime temperatures were below average across much of the Deep South, the middle and lower Mississippi Valley as well as portions of the Southeast.
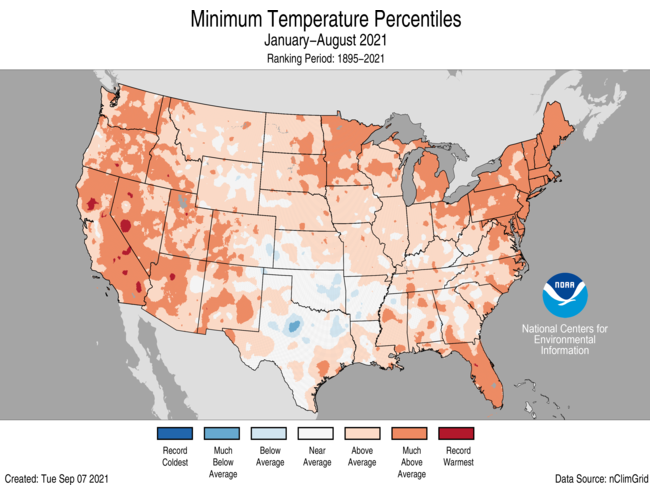
- The contiguous U.S. January-August minimum (nighttime) temperature was 43.7°F, 2.0°F above average, and ranked eighth warmest on record. Above- to much-above-average minimum temperatures were observed across most of the Lower 48. Portions of the southern Plains had below-average nighttime temperatures for this year-to-date period.
- Based on REDTI, the contiguous U.S. temperature-related energy demand during January-August was 76 percent of average and ranked 32nd lowest in the 127-year period of record.
January-August Precipitation

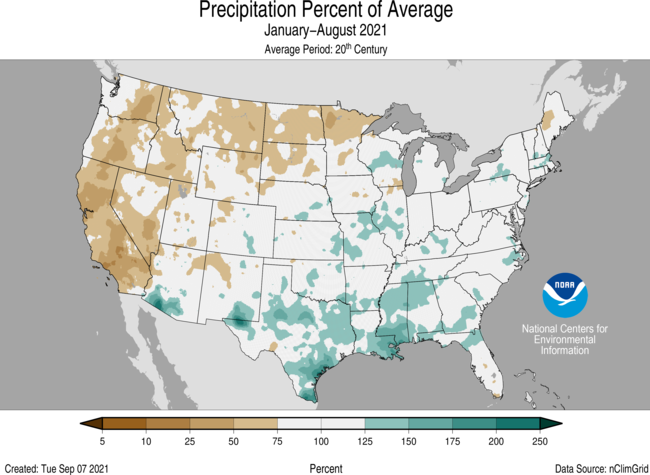
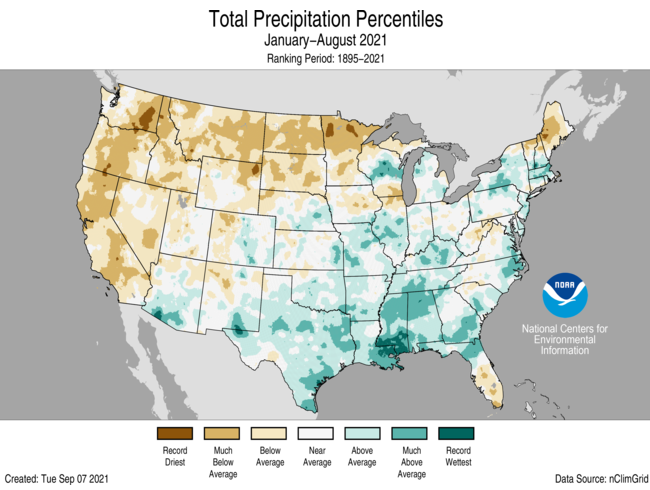
- The year-to-date precipitation total for the Lower 48 was 21.19 inches, 0.48 inch above average, ranking in the middle third of the January-August record.
- January-August precipitation was above average from the Deep South to the Midwest, across the Southeast and portions of the Northeast. Mississippi had its third-wettest such year-to-date period on record. Precipitation was below average from the West Coast to the western Great Lakes and across portions of northern New England. Montana ranked fifth driest while three additional states ranked among the driest 10 January-August periods on record.
- For Alaska, January-August precipitation was above average across the West Coast, North Slope and from the Central Interior to the Panhandle. Precipitation was below average in parts of the Cook Inlet region.
Extremes
- The USCEI for the year-to-date was 52 percent above average and ranked 14th highest in the 112-year period of record. Extremes in warm maximum and minimum temperatures and record dry PDSI contributed to this elevated value.
- On the regional scale, the Northeast ranked second highest on record for the January to August period. This was due to a combination of warm maximum and minimum temperatures, wet PDSI values, extremes in 1-day precipitation and the number of days with precipitation across the region. Record dry PDSI extent for the year-to-date period occurred across the West and Southwest.
Regional Highlights
These regional summaries were provided by the six Regional Climate Centers and reflect conditions in their respective regions. These six regions differ spatially from the nine climatic regions of the National Centers for Environmental Information.
Northeast Region (Information provided by the Northeast Regional Climate Center)
- The Northeast experienced its second hottest August on record with an average temperature of 71.7 degrees F (22.1 degrees C), 3.0 degrees F (1.7 degrees C) above normal. This August was record hot for New Hampshire and Vermont and ranked among the 10 hottest on record for the other 10 Northeast states: Maine and Massachusetts, second hottest; Maryland, third hottest; Connecticut, New Jersey, and Pennsylvania, fourth hottest; New York and Rhode Island, fifth hottest; Delaware, sixth hottest; and West Virginia, 10th hottest. State average temperature departures ranged from 2.2 degrees F (1.2 degrees C) above normal in Connecticut, Delaware, and New Jersey, to 3.8 degrees F (2.1 degrees C) above normal in Vermont. Caribou, Maine, tied its warmest minimum temperature on record for August with a low of 70 degrees F (21 degrees C) on August 12 and 13. Caribou, as well as Buffalo and Syracuse, New York, had their hottest August on record. Summer 2021 ranked as the sixth hottest summer on record for the Northeast. The region’s average temperature of 69.6 degrees F (20.9 degrees C) was 1.5 degrees F (0.8 degrees C) above normal. State average temperature departures ranged from 0.9 degrees F (0.5 degrees C) above normal in West Virginia to 1.9 degrees F (1.1 degrees C) above normal in Vermont. This summer ranked among the eight hottest on record for 11 of the 12 Northeast states: Rhode Island, second hottest; Delaware, Massachusetts, and Vermont, third hottest; Maine and New Hampshire, fourth hottest; Maryland, fifth hottest; New Jersey, sixth hottest; New York and Pennsylvania, seventh hottest; and Connecticut, eighth hottest. In addition, West Virginia had 18th hottest summer. Boston, Massachusetts, had its hottest summer on record with an average temperature of 74.6 degrees F (23.7 degrees C), beating the old record of 74.1 degrees F (23.4 degrees C) from 1983.
- The Northeast received 4.91 inches (124.71 mm) of rain in August, 122 percent of normal, making it the region’s 20th wettest August on record. Nine of the 12 Northeast states were wetter than normal in August, with precipitation ranging from 69 percent of normal in Maine to 150 percent of normal in New Jersey. This August ranked as 10th wettest on record for Pennsylvania, 11th wettest for New York, 15th wettest for New Jersey, and 20th wettest for West Virginia. Summer 2021 was the 10th wettest on record for the Northeast. The region picked up 14.87 inches (377.70 mm) of rain, 116 percent of normal. State precipitation ranged from 84 percent of normal in Maine, the lone drier-than-normal state, to 147 percent of normal in Massachusetts. This summer ranked among the 20 wettest summers on record for seven states: New York, second wettest; Massachusetts, fourth wettest; New Hampshire, eighth wettest; New Jersey and Pennsylvania, 11th wettest; Connecticut, 15th wettest; and Rhode Island, 17th wettest. Huntington, West Virginia, had its wettest summer on record with 22.05 inches (560.07 mm) of precipitation, surpassing the old record of 20.67 inches (525.02 mm) in 1983.
- The U.S. Drought Monitor released on August 5 showed 2 percent of the Northeast in severe drought, 8 percent in moderate drought, and 18 percent as abnormally dry. Drought or abnormal dryness was present in nine of the 12 Northeast states. Severe and moderate drought and abnormal dryness persisted in northeastern New York, northern New England, and Cape Cod, Massachusetts, during the month. In southern parts of the region, including portions of Pennsylvania, Delaware, Maryland, and West Virginia, moderate drought and/or abnormal dryness were introduced/expanded during the first week of August; however, heavy rainfall, particularly from tropical systems Fred and Henri, allowed dryness to ease in parts of those states by month’s end. The U.S. Drought Monitor released on August 26 showed 2 percent of the Northeast in severe drought, 9 percent in moderate drought, and 12 percent as abnormally dry. A few sites in northern New England saw daily record or near-record low streamflow and/or groundwater levels during August. Seventy-five community water systems in New Hampshire had water restrictions in place as of August 18, with 64 of them having mandatory restrictions. Several wells ran dry or experienced water shortages in Maine. As of mid-August, 17 dry wells had been reported in Maine. Due to drought conditions earlier this summer and increased water demand, the Stonington, Maine, municipal water supply, which relies on wells, ran low. The town trucked in water from a nearby town at a cost of around $20,000. According to the Maine Drought Task Force, some trees were experiencing drought stress and “severe drought in northwestern Maine continues to affect the growth of hay and corn.”
- Each day from August 10 to 13 and again from August 25 to 30, the Northeast saw severe thunderstorms or flash flooding. Strong thunderstorm winds blew shingles and siding off of houses, snapped power poles, and downed powerlines and hundreds of trees. A microburst with winds of up to 80 mph (36 m/s) in Sussex County, Delaware, caused significant damage to a commercial building, tearing off the roof and part of the exterior walls. Lightning started several structure fires across the region. Localized flash flooding led to closed roads, submerged vehicles, water rescues, mudslides, evacuations, and high water entering buildings. The severe storms were responsible for at least two deaths and ten injuries, either from fallen trees or lightning. The remnants of Tropical Storm Fred moved through the Northeast from August 18 to 20. The storm spawned 10 weak (EF-0 or EF-1) tornadoes in the region, seven of which touched down in Pennsylvania. Tornado damage included snapped and uprooted trees, some of which fell on homes and cars, as well as siding and roof damage and flattened corn and wheat fields. Fred's remnants, as well as a frontal system, produced heavy rain in several locations, including parts of central/western New York, northern Connecticut, and central Pennsylvania which saw between 4 and 8 inches (102 to 203 mm) of rain. Flash flooding led to impassable roads, flooded basements, stranded vehicles, and water rescues. In addition, a rare Flash Flood Emergency was declared for part of Steuben County, New York, where as many as 100 people were evacuated. A few days later on August 22, Henri made landfall as a tropical storm near Westerly, Rhode Island, the first tropical storm or hurricane to make landfall in the state since Hurricane Bob in August 1991. Henri dropped excessive rainfall amounts of 5 to 9 inches (127 to 229 mm) in portions of southeastern New York, New Jersey, and eastern Pennsylvania. In fact, Central Park recorded its wettest two-day period on record for August, picking up 7.12 inches (180.85 mm) of rain from August 21 to 22. Multiple locations from eastern Pennsylvania through New Jersey and southeastern New York and into southern New England experienced flash flooding, with storm reports noting flooded basements, closed roads, stranded vehicles, and water rescues. Significant flash flooding occurred in Middlesex and Mercer counties and Newark in New Jersey, with at least 150 residents rescued or evacuated. Henri's highest wind gusts reached 70 mph (31 m/s), bringing down trees and power lines and resulting in numerous power outages, particularly in southern New England. In addition, Henri's remnants spawned three short-lived EF-0 tornadoes in Massachusetts, with damage consisting of a few downed trees and branches.
- For more information, please visit the Northeast Regional Climate Center Home Page.
Midwest Region (Information provided by the Midwest Regional Climate Center)
- August temperatures averaged slightly above normal across most of the Midwest. Iowa, Missouri, and Kentucky were mostly within one-degree F (0.6 C) above normal with the remaining Midwestern states being warmer by two to three degrees F (1.1 to 1.7 C) above normal. Only parts of Michigan and a small area in northwestern Ohio was over four degrees F (2.2 C) above normal. Summer (June, July, and August) temperatures showed a similar pattern. The region averaged 73.6 degrees F (23.1 C) in August which was 2.7 degrees F (1.5 C) above normal. Statewide temperatures had the greatest above-normal departures in Minnesota were greater than or equal to two degrees F (1.1 C) in all Midwestern states with the exception of Missouri and Kentucky. There were 129 maximum high temperature records made across the Midwest, with most occurring on August 10th through 12th and August 24th through 26th. With Minnesota (35), Illinois (23), and Indiana (22) experiencing the most records. There were 556 maximum low temperature records during the month with the greatest impacts also felt during the same periods as the maximum high temperatures. Missouri had the most maximum low temperature records (134) followed by Iowa (72) and Michigan (71).
- Precipitation amounts varied from 1.50 inches (38 mm) to over 10.00 inches (254 mm) across the Midwest. The heaviest rainfall amounts occurred in a swath from southern Minnesota / northwest Iowa through central Wisconsin into east-central Michigan. The lowest precipitation amounts were in northern Minnesota, central Missouri, and central Illinois. These patterns translated to over 200 percent of normal in the wettest locations and 50 to 75 percent of normal in the driest regions. Summer (June, July, and August) precipitation was similar except Michigan was overall wetter than normal and most of Minnesota and Iowa were below normal. Regionwide precipitation was 4.33 inches (110 mm) which was 0.66 inches (17 mm) above normal. Statewide totals were below normal in Indiana (-0.06 inches (2 mm)) and Missouri (-0.55 inches (14 mm)) with the remaining states above normal, ranging from 0.20 inches (5 mm) in Illinois to 1.77 inches (45 mm) in Wisconsin. There were 392 precipitation records in August with the 27th having the most at 48.
- The area of Midwest affected by drought slightly increased in August from 34.7 percent to 38.3 percent. Most of Minnesota, Iowa, and the upper peninsula of Michigan were impacted with isolated areas along the Wisconsin-Illinois border and central Indiana. For the first time in the US Drought Monitor’s history (since 2000), Minnesota had areas in the D4-Exceptional Drought category, which is the worst category of drought.
- The Greenwood Lake Fire in Minnesota started on August 15th and continued into September required dozens of residents to evacuate.
- Severe weather was reported on 24 of 31 days in August across the Midwest with all nine states impacted. Reports were double digits on 12 days and reached triple digits on 5 days. The busiest day of the month was on the 11th with most of the reports coming from Ohio (121) and Michigan (113) and were predominantly high wind reports. Tornadoes were reported on 8 days with the most active day being the 9th of August where 22 tornadoes were recorded, 18 of which were in Illinois. Most of the tornado activity in Illinois on that day occurred in Bureau and DeKalb counties. August 28th was the most active hail day across the Midwest (26 reports) where Minnesota (20 reports) had the most hail activity.
- For further details on the weather and climate events in the Midwest, see the weekly and monthly reports at the Midwest Climate Watch page.
Southeast Region (Information provided by the Southeast Regional Climate Center)
- Temperatures were near average across much of the Southeast region for the month of August. Monthly mean temperatures were within 2 degrees F (1.1 degrees C) of normal for over 86 percent of the 153 long-term (i.e., period of record equaling or exceeding 50 years) stations across the region. There were only a handful of stations that observed monthly mean temperatures that were ranked within their five warmest values on record, including Roanoke, VA (1912-2021; 2nd warmest) and Tampa, FL (1890-2021; 3rd warmest). Maximum temperatures ranged from 5.4 degrees F (3 degrees C) above normal in Lynchburg, VA (1893-2021) to 3.5 degrees F (1.9 degrees C) below normal in Huntsville, AL (1894-2021). Daily temperature minimums ranged from 4.5 degrees F (2.5 degrees C) above normal in Clayton, NC (1955-2021) to 0.5 degrees F (0.28 degrees C) below normal in Ft. Lauderdale, FL (1912-2021). High rates of evaporation and the persistent influx of tropical moisture suppressed nighttime cooling during the month. Indeed, there were a few stations that saw minimum temperatures equal to or above 70 degrees F (21 degrees C) for the entire month including, Wilmington, NC (1870-2021) and Gainesville, FL (1890-2021). The warmest weather of the month occurred from the 11th through the 14th, as the Bermuda High, situated off the Atlantic coast, shifted westward over the Southeast region. Daily maximum temperatures exceeded 95 degrees F (35 degrees C) across portions of every state, with a few stations reaching 100 degrees F (38 degrees C), including Washington Dulles (1962-2021; on the 12th), and Raleigh, NC (1887-2021; on the 13th). In contrast, the coldest weather of the month across the Southeast occurred on the 3rd through the 6th, as a continental high pressure system ushered in unseasonably cooler air from the north. Daily minimum temperatures fell below 70 degrees F (21 degrees C) across portions of every state north of Florida, with some locations in the higher elevations of North Carolina and Virginia falling below 60 degrees F (16 degrees C).
- Precipitation varied across the region for August, with the driest locations found across much of the Florida Peninsula, central North Carolina, central Alabama, and Puerto Rico. Monthly precipitation totals ranged from 70 to less than 25 percent of normal across these locations. Indeed, Lakeland, FL (1948-2021; 2nd driest August) only measured 3.97 inches (101 mm) of precipitation, which was more than 5 inches (127 mm) below average. Although Orlando, FL (1892-2021) only observed 6.14 inches (156 mm) of rainfall this month, 1.55 inches (39 mm) below average, a strong thunderstorm on August 6th produced extreme rainfall rates of 3.4 inches (86 mm) per hour, and 4.75 inches (121 mm) in two hours. The wettest locations for the month were located across most of Virginia, western North Carolina, and northern Georgia. Precipitation totals ranged from 150 to 200 percent of normal. Asheville, NC (1869-2021) received 10.95 inches (278 mm) of precipitation, almost 6 inches (152 mm) above normal, making this the 3rd wettest August on record. From the 16th through the 19th, Tropical Storm Fred impacted the region, causing heavy rainfall and strong thunderstorms. Mt. Mitchell, NC (1925-2021) observed 9.20 inches (229 mm) of rain on the 18th, making this the 2nd wettest August day on record and 5th wettest day overall on record. Heavy rainfall in the high elevations of the Balsam Range caused significant flash flooding in the headwaters of the Pigeon River in southern Haywood County, NC and the headwaters of the French Broad River in Transylvania County, NC. A station just north of Lake Toxaway in Transylvania County, NC, measured a total of 23.41 inches (595 mm) of rain for the event. The flooding, along with many landslides, swept multiple recreational vehicles downstream and damaged many homes. As a result, $300 million dollars in damage was estimated in Haywood County and another $11 million dollars in damage was calculated in Transylvania County. There were 7 fatalities in the Southeast from Tropical Storm Fred, 6 due to the flooding in western NC and 1 from a hydroplaning incident in Bay County, FL. From the 29th through 30th, tropical moisture from Hurricane Ida, which made landfall in Louisiana, produced heavy rainfall across southern Alabama and the Florida Panhandle, with 2-day precipitation totals exceeding 5 inches (127 mm) and numerous reports of localized flooding. Mobile, AL (1871-2021) received 4.65 inches (93 mm) of rain on the 30th, making this the 7th wettest August day on record.
- There were 673 reports of severe weather across the Southeast during June, which is 226 percent of the median monthly frequency of 298 reports during 2000-2019. There were 31 confirmed tornadoes reported for the month (17 EF-0, and 14 EF-1), 388 percent of the monthly average of 8. Twenty-one of these tornadoes occurred with Tropical Storm Fred from August 16th – 18th, including an EF-1 tornado in Sumter County, GA, which had a maximum wind speed estimated at 95 mph (42 m/s). This tornado produced significant damage to a residential area. There were numerous trees uprooted or snapped and damage reported to multiple one-story homes. Fortunately, no injuries or fatalities were reported. There were 19 reports of hail for the month, with the largest being golf-ball sized (1.75 inches) in Ashe County, NC on August 12th. There were 619 wind reports for the month, which is 234 percent of the average (265 reports). A gustnado associated with thunderstorms was observed in Grandy, NC on August 4th. Peak winds of 70 mph (31 m/s) caused broken windows and roof damage to a convenience store. Another gustnado that developed on the leading edge of a thunderstorm cluster, was reported on August 18th in Athens, AL, with peak winds of 60 mph (27 m/s), resulting in minor damage. Damaging straight-line winds occurred on August 24th in Seminole County, FL. These winds reached a maximum peak of 65 mph (29 m/s) and uprooted several trees. Unfortunately, strong gusty thunderstorm winds caused a fatality to a kite surfer at Ft. Lauderdale Beach, FL on August 25th. There were nine people struck by lightning during the month; 2 people were struck in Pinellas County, FL on August 12th, and 7 people were struck in Avery County, NC on August 13th. No fatalities were reported.
- Drought conditions changed very little across the Southeast region for August. Abnormally dry conditions (D0) were confined to western North Carolina and the western part of Virginia, with a small pocket of moderate drought (D1) in western Virginia. Drought remained the same across Puerto Rico, with an area of moderate drought (D1) in the southern part of the island ringed by an area of abnormally dry conditions (D0). The citrus growing region in Florida experienced a decrease in precipitation for the month forcing farmers to irrigate in several areas. Rains from Tropical Storm Fred in the Florida Panhandle caused disease pressure on field crops and increased pod rot in peanuts. Frequent rainfall events in northern Georgia increased pest pressures. Kudzu bugs were noted as issues in soybeans and army worms, and maggots were observed in pastures. Rust was also noted as an issue for late-planted corn. Drier weather in Alabama allowed for herbicide and fungal applications to field cops. Weevils and mold were noted in southern Alabama where more rain was received. High humidity prevented corn from drying down appropriately in South Carolina, and corn harvest was further delayed due to heavy rains from Tropical Storm Fred. However, cool season vegetables were being planted in volume.
- For more information, please visit the Southeast Regional Climate Center Home Page.
High Plains Region (Information provided by the High Plains Regional Climate Center)
- Temperature
- Temperatures varied across the region for the month but remained above normal for most of the region. Most of Wyoming and Montana observed temperatures below normal, with isolated areas above normal. On the other hand, temperatures were above normal for Colorado, Nebraska, Kansas, North Dakota, and South Dakota. Areas with the highest departures in the region occurred in southeastern North Dakota, southeastern South Dakota, and small areas of Kansas and Colorado where the monthly averages were 3.0 to 5.0 degrees F (1.7-2.8 degrees C) above normal. As a result of these above normal temperatures, many locations ranked in the top 10 warmest August on record (see page 6 for monthly rankings). Colorado Springs, CO tied a record set in 2020 as the 2nd warmest August on record with an average temperature of 74.0 degrees F (23.3 degrees C), which was 3.9 degrees F (2.2 degrees C) above normal. Denver, CO also tied a record, set in 2020 and 2017, with an average temperature of 75.4 degrees F (24.1 degrees C) making it the 4th warmest August on record. Bismarck, ND, ranking at 7th warmest August on record, broke a new record during August. Bismarck reached its 15th day this year equal to or above 100 degrees F (37.8 degrees C). This set a record for 2021 as the year with the highest number of days equal to or above 100 degrees F (37.8 degrees C) for Bismarck, beating a previous record of 14 days set in 1936. These high temperatures, combined with lack of precipitation, for August continued to offer little relief for drought conditions as the extreme heat continued to take a toll on crops and wildlife in the region.
- Precipitation
- Dry conditions remained for much of the High Plains, barring several pockets across the region of above normal precipitation. This precipitation disparity was observed in many states but most prominently in South Dakota. The northeast portion of South Dakota observed precipitation over 5 inches (127 mm) above normal ranking some areas in the top 10 wettest August on record. Sisseton, SD ranked the wettest August on record with 7.98 inches (202 mm), surpassing a previous record of 6.91 inches (176 mm) from 1964 by almost an inch (25 mm). Although Rapid City, SD did not set any new records for August, it is worth mentioning that it received well above normal precipitation for the month. Rapid City had 191 percent above normal precipitation totals, along with Aberdeen, SD (183 percent above normal), and Pierre, SD (136 percent above normal). This contrasted with the southwestern portion of the state which observed precipitation totals between 2 and 3 inches (51- 76 mm) below normal. Outside of these isolated areas of above normal precipitation, most of the region observed precipitation totals below normal for August. Most of Kansas, Colorado, Nebraska, and portions of North Dakota, South Dakota, and Wyoming had below normal precipitation totals. These below normal conditions led to a new record in Alamosa, Colorado. Alamosa ranked as the driest August on record with 0.10 inches (2.5 mm) of precipitation for August. This lowered a previous record set in 1944 of 0.11 inches (2.7 mm). Colorado Springs observed its 4th driest August on record with 0.20 inches (5 mm) only reaching 7 percent of its normal precipitation for the month.
- Drought
- Drought conditions persisted across the region, as warm temperatures and minimal precipitation continued for August. This has led to several impacts across our region, most of which were observed in the Northern High Plains. Extreme heat and drought conditions have weakened beehives in North Dakota, a leader in U.S honey production. This has led to dwindling hive sizes and a decrease in the honey production for the year. These effects have the potential to impact other areas in the U.S. Beehives from North Dakota are transported to California in winter months to help with almond tree pollination, and with reduced bee sizes there is the potential for less pollination. Pastures and rangeland across Wyoming, North Dakota, and South Dakota continue to fare poorly. According to the USDA, 85 percent of pastures and rangeland in North Dakota, 83 percent in South Dakota, and 68 percent in Wyoming are in poor to very poor condition. Crops also continue to fare poorly in the region. In South Dakota Spring Wheat ended the crop season with 75 percent in poor to very poor condition. Extreme heat has quickened the process of crop growth this season causing earlier than average maturation and harvest. Temperatures and lack of precipitation isn’t the only thing impacting crop conditions: Grasshoppers, which have thrived in the warm, dry conditions, are causing major havoc on crops by eating them to the ground in some areas. This, along with low and poor quality stock ponds, has impacted cattle in the region causing many ranchers to sell their cattle.
Southern Region (Information provided by the Southern Regional Climate Center)
Louisiana took a direct hit from Category 4 Hurricane Ida. Tennessee may have broken its single-day rainfall total.
- Temperatures
- August 2021 was the hottest month of the year so far for every state in the Southern Region. Except for Texas, all states averaged temperatures that were above the historical median. Warmest, both in absolute terms and from a historical perspective, was Louisiana. Their August temperature averaged 82.6 °F (28.1 °C), which was 31th warmest on record. Texas, though mild historically, was second warmest among the Southern Region states at 81.9 °F (27.7 °C). A few stations in Texas managed to tie their all-time records for highest August daily minimum temperature. Tennessee only averaged 77.3 °F (25.2 °C), but that was high enough to be the 35th warmest on record. The highest temperature in the region was 109 °F (42.8 °C) at Rio Grande Village in southern Texas on August 9, while the lowest temperature was 41 °F (5.0 °C) on August 8 at Mt. Leconte, Tennessee.
- Precipitation
- Rainfall was quite variable across the South. The largest rainmaker was Hurricane Ida, which produced copious amounts of precipitation across eastern Louisiana and southern Mississippi. Some stations in the hardest-hit areas are yet to report, so the current official totals are likely to be an underestimate. According to data so far, Mississippi averaged 7.28” (185 mm), making it the fourth wettest August on record. Additional totals may elevate it to third wettest, behind only 2012 and 2008. Louisiana’s current August value is 5.63” (143 mm), 38th wettest, and the majority of the state avoided substantial precipitation from Ida. The present value is less than half the highest values on record, 13.02” (331 mm) and 12.94” (329 mm) in 2016 and 2017, respectively. Tennessee also experienced a wet August; its 6.89” (175 mm) total ranks it fifth highest on record and the wettest since 1926. Oklahoma was the only state drier than median, with an average of 2.53” (64 mm) that places it 55th driest historically. Five reporting stations recorded more than 20” (508 mm) for the month, one in Louisiana, two in Mississippi, and two in Tennessee. The latter four stations were CoCoRaHS stations, and the two observations in Tennessee were the first August totals over 20” on record.
- Drought
- Most of the southern United States remained drought-free in August. Isolated areas of abnormal dryness were found in Arkansas and Tennessee, while drought itself (D1 or greater on the US Drought Monitor) was confined to western Texas and Oklahoma. Severe drought was indicated on August 31 in parts of two counties in northwestern Oklahoma. Excessive rainfall was a much greater problem for Mississippi, Tennessee, and parts of Louisiana, while near-normal precipitation in Arkansas, Oklahoma, and Texas was generally beneficial for farmers, ranchers, and water suppliers.
- Tennessee Flooding
- There were two particularly significant weather events in the Southern Region, both of which occurred in late August. The first was localized flooding in western Middle Tennessee on August 21. Most of the precipitation occurred during the morning hours, a result of a succession of thunderstorm cells forming along a stationary front and repeatedly passing over the same area. The Texas Emergency Management Agency reports 20 weather-related fatalities, and over 700 homes were damaged or destroyed by flooding. According to the Hydrometeorological Design Studies Center, portions of three counties exceeded their 1000-year 24-hour rainfall total and portions of five more counties exceeded their 100-year value. The highest reliable total appears to be from a Tennessee Valley Authority rain gauge in McEwen, which recorded 9.34” (237 mm) in three hours and 17.02” (432 mm) in 24 hours. The latter total would have ranked second all-time in Tennessee for the entire month of August. The observations are now being investigated for possible establishment of a new official 24-hour state rainfall record.
- Hurricane Ida
- Hurricane Ida made landfall in southeastern Louisiana around noon on August 29 as a strong category 4 hurricane. According to real-time advisories by the National Hurricane Center, maximum sustained winds were 150 mph (240 km/h) and the minimum central pressure was 930 mb at landfall. Based on those numbers, Ida was one of three hurricanes in recorded history to strike Louisiana with 150 mph winds, along with Laura last year and the “Last Island” hurricane of 1856. Only four stronger landfalling hurricanes have been recorded in the continental United States. After landfall, the center of the storm tracked across southeastern Louisiana and southwestern Mississippi, weakening to a tropical depression by the time it reached central Mississippi. The full impact and death toll from Ida has yet to be determined, as wind and rain toppled trees and damaged power lines and other facilities. More than a week after the storm, most of New Orleans and the rest of southeast Louisiana had yet to see power restored, and the heat and lack of electricity meant that the death toll could continue to rise due to such threats as heat stroke and lack of water.
- Severe Weather
- There was one confirmed tornado (F0, in Gulfport, Mississippi) and another possible tornado (in central Mississippi) associated with Hurricane Ida, and three other possible tornadoes during the month (in Texas and Mississippi). There were 24 reports of hail 1”-2” (25-50 mm) in diameter (in Oklahoma, Texas, and Tennessee), and over a hundred reports of wind damage from severe thunderstorms, as distinct from the damages caused by Hurricane Ida.
- For more information, please visit the Southern Regional Climate Center Home Page.
Western Region (Information provided by the Western Region Climate Center)
- August 2021 was characterized by an anomalously strong offshore ridge centered in the eastern North Pacific Ocean. The position of the ridge west of North America brought largely seasonable, albeit hot, temperatures to the western U.S. but kept the northwestern regions drier than normal. Despite generally seasonable temperatures at the monthly scale, the Pacific Northwest experienced another heatwave. However, this event was shorter in duration and less severe in magnitude than the record-breaking June 2021 event. The hot and dry conditions allowed wildfire activity to continue throughout the west, with many notable large fires burning throughout Washington, Oregon, Idaho, and California leading to poor regional and local air quality as well as disrupting economies and displacing humans and wildlife.
- Temperatures in the West were near-average during August, with slightly above normal (0–2°F; 0–1.1°C) temperatures in the majority of regions. Owing to increased cloud cover and likely some land surface feedbacks, slightly below average (0-2°F; 0–1.1°C) temperatures were observed in the regions receiving above-normal rainfall. Salem, OR was 3.1°F (1.7°C) above its August average of 72.3°F (22.4°C), a value good for the third-warmest August in 122 years of record keeping. Davis, CA had its second warmest August in 116 years with an average of 78.7°F (25.9°C), which is 4.2°F (2.3°C) above average. With 59 years of observations, Fredonia, AZ experienced its fourth hottest August on record with an average of 77.6°F (25.3°C; 1.6°F (0.9°C) above normal).
- As is common during summer, precipitation in the West was varied. California, Oregon, and Washington remained extremely dry. The Intermountain West received well-above normal rainfall as an active Southwestern monsoon continued through August, favoring poleward moisture transport. For example, Payson, AZ experienced its eighth-wettest August in 81 years with 5.5 in. (140 mm; 190% of normal) of rainfall. However, not all locations were fortunate to receive bountiful rainfall. With 129 years of records, Winslow, AZ recorded its ninth-driest August on record, measuring only 0.24 in. (6 mm; 27% of normal). Livingston, MT, where record keeping began 74 years ago, recorded its second-wettest August on record, measuring 2.91 in. of precipitation (74 mm; 161% of normal). Pocatello, ID observed 1.89 in. (48 mm; 131% of normal) of rain, good for its fifth-wettest August in 83 years. August was the third wettest in 74 years for Salt Lake City, UT, where 2.29 in. (58 mm; 135% of normal) of rainfall fell.
- Sea surface temperatures (SST) in the vicinity the Hawaiian Islands were near to slightly below average (0–1.5°F; 0–0.8°C) above normal. Temperatures on the Hawaiian Islands in August were generally near-normal. With a mean temperature of 77.7°F (25.6°C) Hilo, HI (Hawaiʻi) recorded its thirteenth hottest August (1.1°F (0.6°C) above normal) since 1950. Drought conditions continued on all islands as August precipitation was below normal despite beneficial rainfall from Hurricane Linda. Maui is experiencing the most severe drought conditions while all parts of Lānaʻi, Kahoʻolawe, and Niʻihau are in some level of drought according to the U.S. Drought Monitor.
- August brought slightly cooler and much wetter than normal conditions to Alaska. However, northwestern and interior Alaska experienced hot conditions early in the month. Northway, AK tied its all-time highest August temperature of 88°F (33.1°C) since August records began in 1943. Anchorage (5th), Juneau (10th), and Fairbanks (9th) all had top-ten wettest Augusts. The central interior finished August with 200–300% of normal rainfall. In Fairbanks, where record keeping began in 1930, 3.67 in. (93 mm; 175% of normal) of rain was reported. This rainfall helped mitigate wildfire activity. The 2021 Alaskan wildfire season ended with approximately 254,000 acres (103,000 ha) burned, which is less than half of the long-term median. Daily sea ice extent in the Chukchi was the highest since 2006. While extensive, other indicators, such as the declining area of multiyear ice in the Arctic, suggest this ice is young and thus thin. Significant Events for August 2021
- August 11–12 Brings Another Pacific Northwest Heatwave: The Pacific Northwest endured an additional notable multiday span of anomalously hot temperatures between August 11–12. During this event, Portland, OR experienced two days of temperatures greater than 100°F (37.8°C), bringing the 2021 total to five. Normally, Portland observes an average of one day exceeding 100°F per year. In addition to numerous impacts to public health, particularly in underprivileged communities and other vulnerable populations (e.g., older populations without access to air conditioning), the additional round of heat in August will likely further stress terrestrial and marine ecosystems already damaged by the June heatwave.
- Monsoon Rains Cause Severe Flooding in Arizona: The return of summer thunderstorms to southern Arizona and New Mexico brought much-needed moisture to this drought-stricken region. However, heavy rainfall caused flash flooding in small and large communities. In Gila Bend, AZ (Maricopa County), severe flooding occurred between August 13–14. This rainfall led to a state of emergency declaration by the local government. At least two deaths were reported with dozens requiring rooftop rescues via helicopter. Urban flooding occurred in Phoenix, Arizona on August 18 with numerous impacts to roads and other infrastructure.
- For more information, please go to the Western Regional Climate Center Home Page.