National Overview

May Highlights


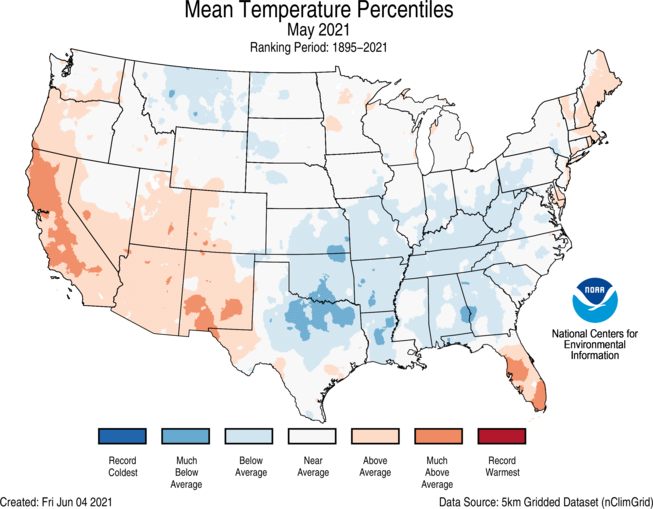
May Temperature
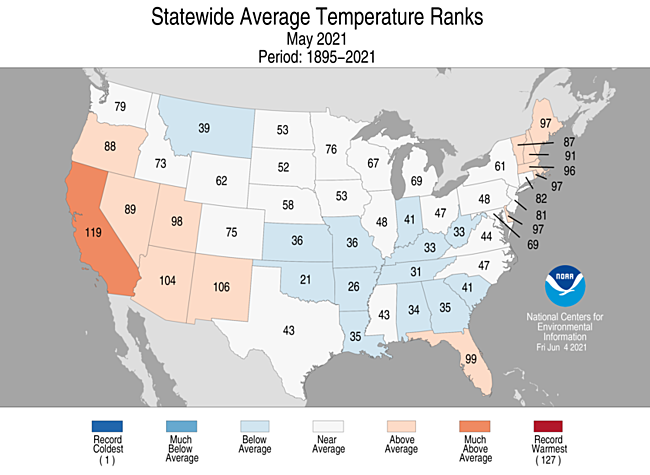
- The average contiguous U.S. temperature during May was 60.4°F, 0.2°F above the 20th century average and ranked in the middle third of the 127-year period of record.
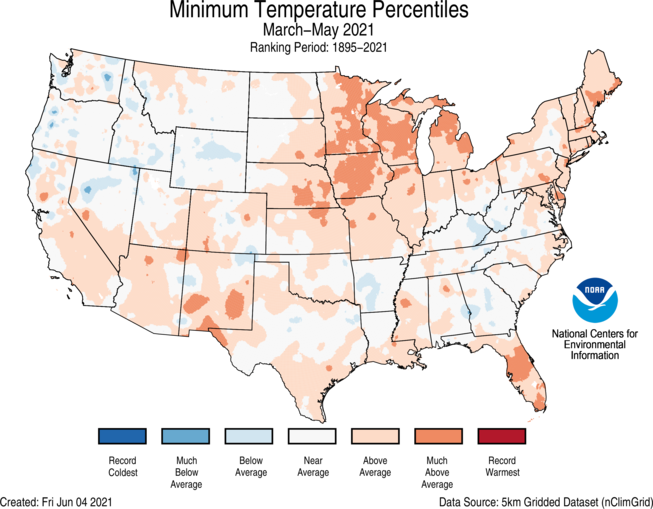
- The dominant large-scale pattern during May was a ridge of high pressure across the western U.S. and a trough of low pressure over much of the East. This pattern contributed to above-average temperatures across parts of the West Coast, Southwest, New England and Florida. Temperatures were below average across portions of the northern Rockies as well as the central and southern Plains, central Gulf Coast, Southeast, and into the Ohio Valley.
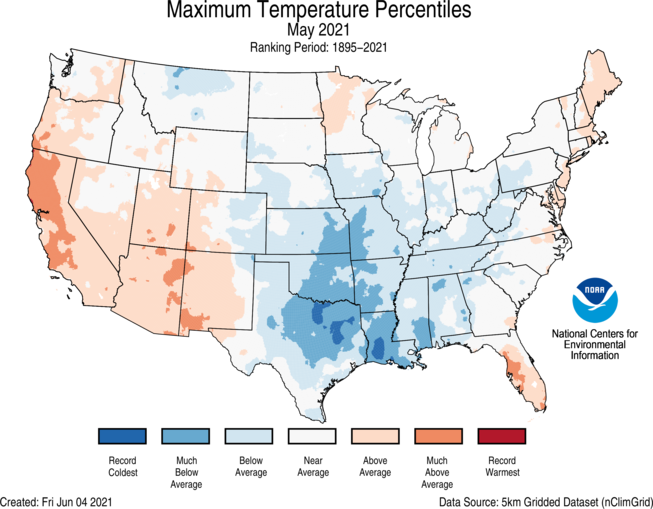
- The contiguous U.S. average maximum (daytime) temperature during May was 72.9°F, 0.1°F below the 20th century average, ranking in the middle one-third of the record. Above-average maximum temperatures were observed across the West Coast and Southwest as well as parts of the western Great Lakes, New England, mid-Atlantic and Florida. Below-average daytime temperatures occurred from the central and southern Plains to the Ohio Valley.
- The contiguous U.S. average minimum (nighttime) temperature during May was 47.8°F, 0.4°F above the 20th century average, ranking among the middle one-third of the record. Above-average minimum temperatures were observed across much of the West Coast and Southwest, parts of the Gulf Coast, New England and across portions of the central Plains and Great Lakes.
- The Alaska average May temperature was 40.2°F, 2.4°F above the long-term mean, ranking in the warmest third of the record for the state.Temperatures were cooler than average across parts of the Panhandle. Temperatures were above average across much of the western, central and southern portions of Alaska.
- Aided by near- to below-average spring temperatures in the region, Bering Sea ice average extent during May was the highest since 2013, but still lower than average levels observed during the 20th century.
- On May 25, Nome reported a high temperature of 71°F. On May 28, 0.2 inch of snow was reported. This is the first time in more than 100 years that Nome has reported measurable snowfall following the first 70°F+ day of the spring.
- Based on data records as of June 8, there were 2,501 record warm daily high (947) and low (1,554) temperature records during May, which is nearly 74 percent of the 3,380 record cold daily high (2,200) and low (1,180) temperature records.
- Based on NOAA's Residential Energy Demand Temperature Index (REDTI), the contiguous U.S. temperature-related energy demand during May was 56 percent of average and the 34th highest value in the 127-year period of record.
May Precipitation
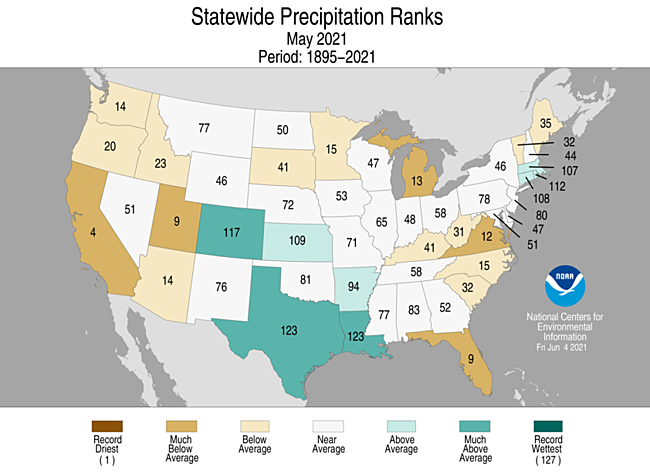
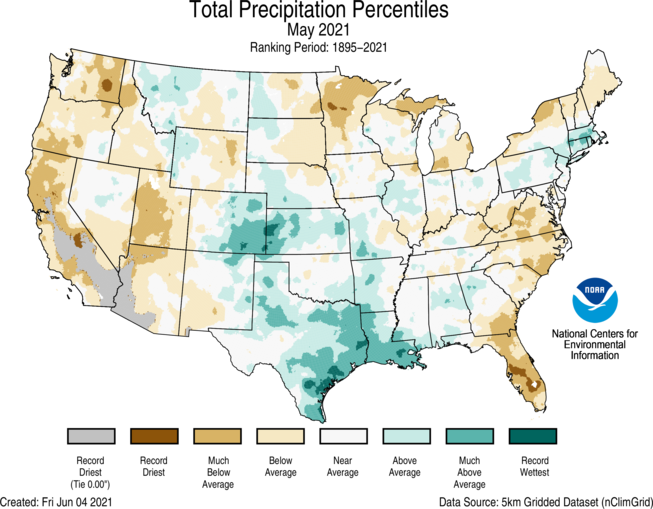
- The May precipitation total for the contiguous U.S. was 2.94 inches, 0.03 inch above average, ranking in the middle one-third of the historical period of record.
- Precipitation was above average from the central and western Gulf Coast into portions of the central Plains and scattered across parts of the northern Rockies and southern New England. Louisiana and Texas ranked fifth wettest on record for May.
- Precipitation was below average across much of the West, portions of the northern Plains, Great Lakes, northern New England, mid-Atlantic and Southeast. California ranked fourth driest while Utah and Florida ranked ninth driest during May.
- Drought emergencies were declared across portions of California and Oregon during May. Many western reservoir levels were at low levels. Agricultural, fish and wildlife as well as fire concerns are mounting across much of the West.
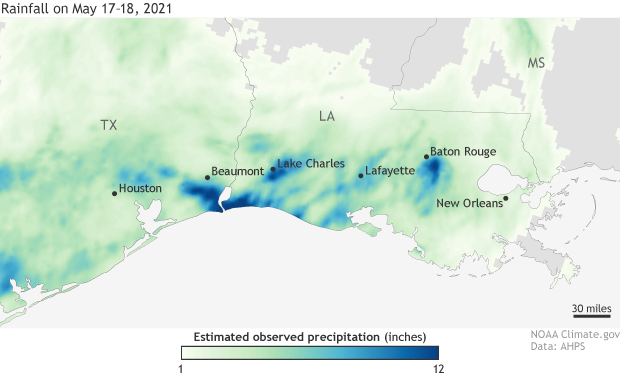
- Torrential rainfall, associated with slow-moving thunderstorms across parts of coastal Texas and Louisiana on May 17-18, brought widespread flash flooding and power outages, and resulted in hundreds of water rescues. More than a foot of rain fell near Lake Charles, Louisiana, still recovering from damage caused by Hurricanes Laura and Delta, which made landfall across the region last summer.
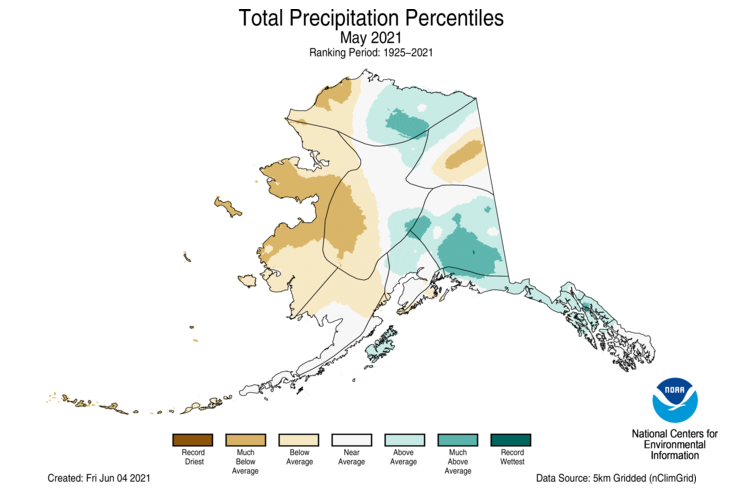
- Despite precipitation across Alaska ranking near average for May, much of western Alaska was drier than average, and eastern Alaska wetter than average.
- Eagle, AK, reported 1 inch of snowfall on May 29. This is the latest in the season this station has observed at least 1 inch of snow.
- According to the June 1 U.S. Drought Monitor report, 43.7 percent of the contiguous U.S. was in drought, down about 4.7 percent from the end of April. Drought intensified and/or expanded across California, Oregon, Washington, the northern Plains, parts of the Great Lakes and across Puerto Rico and Hawaii. Drought emerged across portions of the eastern Carolinas and Virginia. Drought severity lessened across portions of the Rocky Mountains and Northeast and drought was mostly eliminated across the central and southern Plains.
Other Notable Events
- Tropical Storm Ana formed in the Atlantic Ocean on May 22, making 2021 the seventh consecutive year in which a named storm formed before the official start of the Atlantic hurricane season on June 1.
- There were no EF-3+ tornadoes reported across the CONUS during May. If this verifies, it will be the first time, since reliable records began in 1950, that no EF-3+ tornadoes occurred during the month of May.
Spring Highlights

March-May Temperature
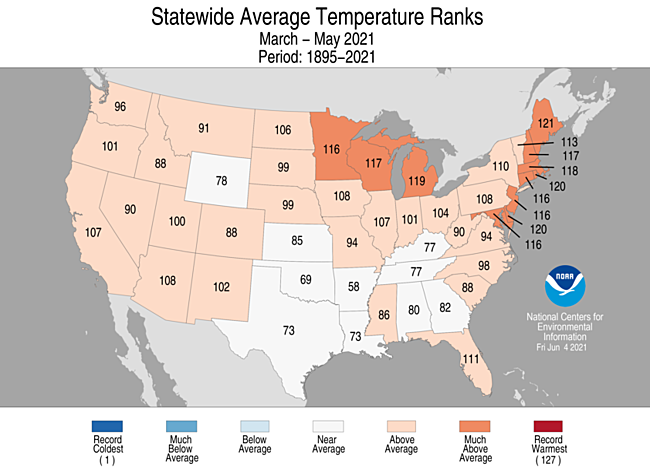
- The spring (March-May) average contiguous U.S. temperature was 52.6°F, 1.7°F above average, ranking in the warmest third of the record.
- Temperatures were above average across much of the West and from the northern and central Plains to the Northeast and along much of the East Coast. Maine ranked seventh warmest for spring. No state across the Lower 48 ranked below average for the season.
- The Alaska spring temperature was 24.4°F, 0.5°F above the long-term average, ranking in the middle third of the record for the state. This was the coolest spring across Alaska since 2013. Temperatures were above average across the Aleutians and portions of northern Alaska and below average across parts of eastern-interior Alaska.
- The contiguous U.S. average maximum (daytime) temperature during March-May was 65.2°F, 2.1°F above the 20th century average, ranking among the warmest one-third of the record. Above-average daytime temperatures were observed across much of the West, northern Plains, Great Lakes, Northeast, mid-Atlantic and portions of the Southeast and central Plains. Below-average temperatures occurred across portions of the southern Plains and central Gulf Coast.
- The contiguous U.S. average minimum (nighttime) temperature during March-May was 39.9°F, 1.3°F above the 20th century average, ranking in the warmest third of the record. Above-average nighttime temperatures were observed across much of the central Plains, Midwest, Great Lakes and New England as well as across portions of the West, southern Plains, Gulf Coast and Southeast. Below-average temperatures were scattered across parts of the West, South and Southeast.
- Based on REDTI, the contiguous U.S. temperature-related energy demand during the spring season was 43 percent of average and was the 7th lowest value on record.
March-May Precipitation

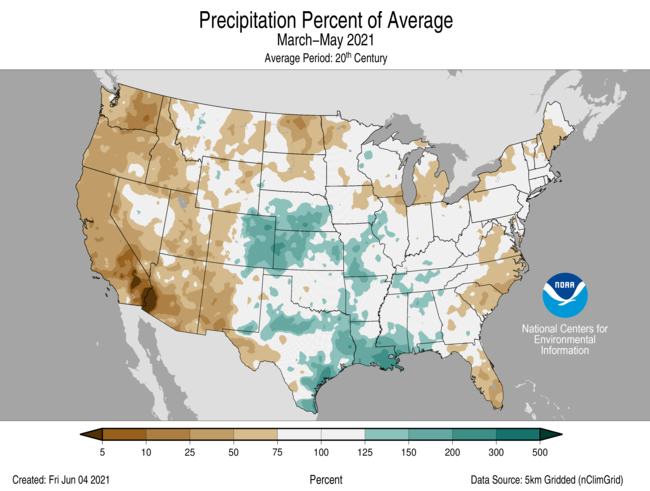
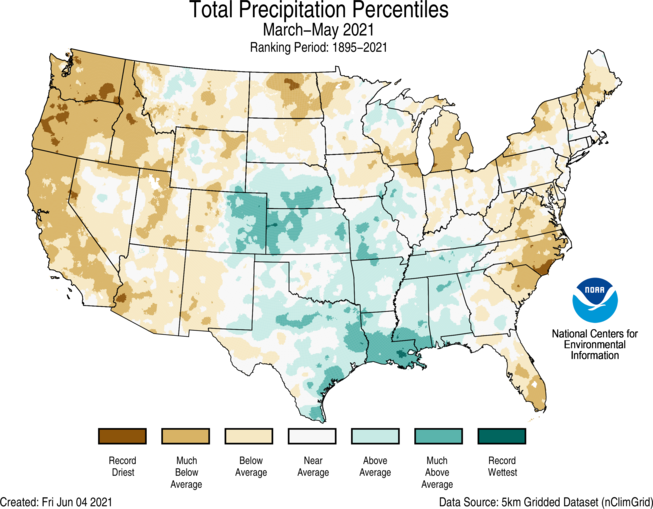
- The spring precipitation total was 7.53 inches, 0.41 inch below average, ranking in the driest one-third of the March-May record and was the driest spring since 2006.
- Spring precipitation was above average from the central High Plains to the Mississippi River and south to the Gulf of Mexico. Louisiana ranked fourth wettest for the season.
- Precipitation during March-May was below average across much of the West, northern Plains, Great Lakes and East Coast. Idaho, Oregon and the state of Washington ranked second driest for the spring season while California ranked fourth driest.
- Portland, OR, received 2.52 inches of precipitation during spring. This shattered the previous record dry spring of 1994 by 1.79 inches.
- On the East Coast, Wilmington, NC, broke its record for the driest spring. With records dating back to 1933, spring 2021 saw 4.31 inches of precipitation, which was 0.17 inches less than what was received in 2007.
Extremes
-
The U.S. Climate Extremes Index (USCEI) for the spring season was six percent below average, ranking in the middle third of the 112-year period of record. Despite the near-average national value, there were elevated extremes in the spatial extent of dry PDSI, primarily across the western U.S. The USCEI is an index that tracks extremes (falling in the upper or lower 10 percent of the record) in temperature, precipitation and drought across the contiguous United States.
- On the regional scale, the Northeast, Northwest and West regions had a CEI value that ranked in the top one-third of the historical record for the season. The Northeast and Northwest regions experienced elevated extremes in warm maximum temperatures, days without precipitation and dry PDSI. The Northwest Region was impacted by above-average extremes in both days without precipitation and dry PDSI. In contrast, the Northern Rockies and Plains region had below-average extremes for the season.
Year-to-Date Highlights


January-May Temperature

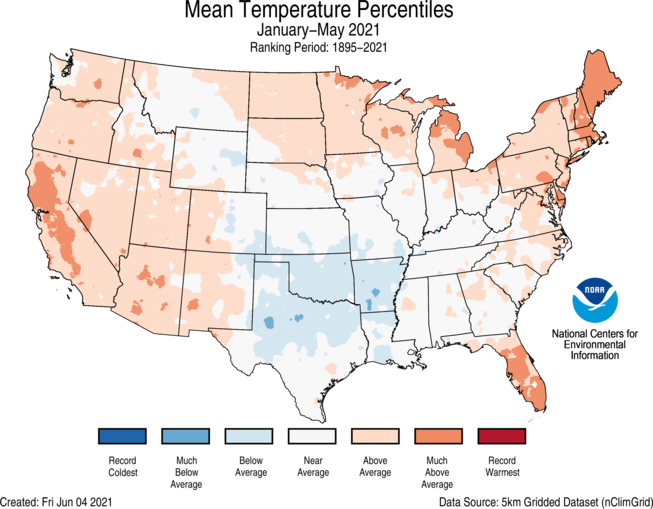
- The year-to-date (January-May) average contiguous U.S. temperature was 44.6°F, 1.3°F above average, ranking in the warmest third of the record.
- Temperatures for the year-to-date period were above average across much of the West, northern Plains, Great Lakes, Northeast and Florida. Maine ranked fifth warmest on record for the January-May period. Below-average temperatures were concentrated across portions of the southern Plains.
- The contiguous U.S. average maximum (daytime) temperature during January-May was 56.1°F, 1.2°F above the 20th century average, ranking in the warmest third of the historical record. Above-average daytime temperatures were observed across much of the West, northern Plains, Great Lakes, Northeast and across portions of the Southeast. Temperatures were below average across much of the central and southern Plains.
- The contiguous U.S. average minimum (nighttime) temperature during January-May was 33.1°F, 1.4°F above the 20th century average, ranking in the warmest one-third of the record. Nighttime Temperatures were above average across much of the northern Plains, Great Lakes, Northeast and across portions of the Southeast and West. Temperatures were below average in portions of the Rocky Mountains and the southern Plains.
- The Alaska year-to-date temperature was 17.0°F, 1.2°F above average, ranking in the middle third of the historical record. Temperatures were above average across the Aleutians, Bristol Bay, Northwest Gulf and portions of the southern West Coast regions. There were no large areas of below-average temperatures for the year-to-date period across Alaska.
- Based on REDTI, the contiguous U.S. temperature-related energy demand during January-May was 62 percent of average and was the 17th lowest value on record.
January-May Precipitation

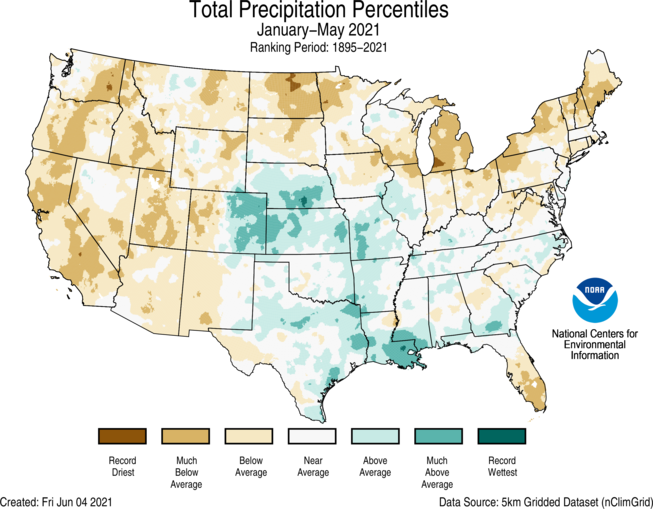
- The year-to-date national precipitation total was 11.65 inches, 0.74 inch below average, ranking in the driest third of the January-May record.
- Above-average precipitation prevailed across much of the central and southern Plains as well as the western and central Gulf Coast.
- Below-average precipitation for the year-to-date period occurred across much of the West, Northern Tier, Northeast and Florida. North Dakota and Michigan ranked seventh driest while Utah ranked eighth driest.
Extremes
-
The U.S. Climate Extremes Index (USCEI) for the year-to-date period was 10 percent below average, ranking in the middle one-third of the 112-year period of record. Extremes in dry PDSI were the major contributor to this near-average CEI value. The USCEI is an index that tracks extremes (falling in the upper or lower 10 percent of the record) in temperature, precipitation and drought across the contiguous United States.
- On the regional scale, The Northeast, Southwest and West regions each ranked in the highest third of their record for this five-month period. Elevated extremes were the result of large regions of warm maximum temperatures across the Northeast and West, warm minimum temperatures in the Northeast, as well as days without precipitation across the Northeast and dry PDSI values across the Southwest and West. The entire West region was enveloped in dry PDSI extremes during the first five months of the year — a record for this region. In contast, the Northern Rockies and Plains Region had below-average extremes for this year-to-date period ranking fifth lowest on record.
Regional Highlights
These regional summaries were provided by the six Regional Climate Centers and reflect conditions in their respective regions. These six regions differ spatially from the nine climatic regions of the National Centers for Environmental Information.
Northeast Region (Information provided by the Northeast Regional Climate Center)
- May’s average temperature of 56.2 degrees F (13.4 degrees C) was 0.7 degrees F (0.4 degrees C) colder than normal in the Northeast. May average temperatures for the 12 Northeast states ranged from 2.5 degrees F (1.4 degrees C) colder than normal in West Virginia to 1.0 degrees F (0.6 degrees C) warmer than normal in New Hampshire, with seven of the states being warmer than normal. The Northeast had its 15th warmest spring on record with an average temperature of 47.2 degrees F (8.4 degrees C) which was 1.5 degrees F (0.8 degrees C) above normal. State temperature departures ranged from 0.1 degrees F (0.1 degrees C) below normal in West Virginia to 2.4 degrees F (1.3 degrees C) above normal in Maine. This spring ranked among the 20 warmest springs on record for each Northeast state except West Virginia: Maine, seventh warmest; Delaware and Rhode Island, eighth warmest; Massachusetts, 10th warmest; New Hampshire, 11th warmest; Connecticut and New Jersey, 12th warmest; Maryland, 13th warmest; Vermont, 15th warmest; New York, 18th warmest; and Pennsylvania, 20th warmest.
- May was a drier-than-normal month for the Northeast with 3.38 inches (85.85 mm) of precipitation, which was 85 percent of normal. May precipitation for the 12 Northeast states ranged from 62 percent of normal in West Virginia to 146 percent of normal in Connecticut, with seven of the states wrapping up the month on the dry side of normal. Rhode Island experienced its 16th wettest May on record, while Connecticut had its 20th wettest. During spring, the Northeast received 9.12 inches (231.65 mm) of precipitation, which was 81 percent of normal. Precipitation for the states ranged from 71 percent of normal in Maine to 96 percent of normal in Massachusetts. Maine recorded its 18th driest spring on record, while Vermont had its 20th driest.
- The U.S. Drought Monitor released on April 29 showed 14 percent of the Northeast in a moderate drought (D1) and 41 percent as abnormally dry (D0). Abundant precipitation during the first half of May allowed areas of moderate drought and/or abnormal dryness to ease in parts of New England, New York, and western Pennsylvania. However, eastern Pennsylvania received below-normal precipitation, causing abnormal dryness to expand. Much of the second half of the month was drier than normal, leading to the expansion or introduction of abnormal dryness across the Northeast with only Rhode Island being free of D0 conditions as of late May. The last few days of May brought significant rainfall to southeast portions of the region, alleviating abnormal dryness in many locations there. However, abnormal dryness persisted or expanded in the rest of the Northeast. The U.S. Drought Monitor released on June 3 showed 3 percent of the Northeast in a moderate drought (D1) and 37 percent as abnormally dry (D0). Vermont set a new record for longest drought duration, experiencing 46 consecutive weeks of drought from June 23, 2020, through May 4, 2021. As of June 1, the record grew to 50 weeks. Streamflow and groundwater were below normal in several locations during the month. In fact, low groundwater levels led to water restrictions on Cape Cod, Massachusetts. Dry conditions increased fire risk and contributed to some wildfires in the region, with New Jersey implementing fire restrictions in several counties. The dry weather was good for planting and reduced diseases in crops such as strawberries and apples; however, some growers had to irrigate more frequently.
- Severe thunderstorms produced six tornadoes, damaging wind gusts, and flooding rain in Pennsylvania, Maryland, and West Virginia on May 3 and 4. An EF-1 tornado in Ranson, West Virginia, caused roof and siding damage to several buildings, destroyed a small warehouse, snapped trees, and resulted in one injury. In Maryland, two EF-1 tornadoes and an EF-0 tornado snapped or uprooted more than 150 trees and severely damaged or destroyed several farm outbuildings. Two EF-0 tornadoes in Pennsylvania damaged trees. In addition, around 4 inches (102 mm) of rain fell in six hours, flooding basements and roads in parts of northeastern Pennsylvania. On May 26, strong thunderstorm winds downed trees, some of which fell on vehicles and structures, and damaged several buildings. The storm also knocked down power lines, leading to power outages, and resulted in at least four injuries. This spring was the least snowy spring on record (in most cases tying several other years) for eight major climate sites that received no measurable snowfall: Concord, New Hampshire; Bridgeport, Connecticut; Providence, Rhode Island; Allentown and Philadelphia, Pennsylvania; Dulles Airport, Virginia; Atlantic City, New Jersey; and Washington, D.C. However, it was the first time on record that Bridgeport recorded no spring snowfall.
- For more information, please visit the Northeast Regional Climate Center Home Page.
Midwest Region (Information provided by the Midwest Regional Climate Center)
- May temperatures ranged from near normal in the northern Midwest to below normal in the southern Midwest. Overall Midwest temperatures averaged 58.7 degrees F (14.8 C) which was 1.0 degrees F (0.6 C) below normal. Despite the relatively small monthly departures, the region saw big swings of temperatures during the month. From the 18th to the 24th, extremely warm temperatures were experienced across the northern parts of the region. Most of the 500 plus high temperature daily records fell on these days. Much colder temperatures were experienced in the last week of May. Near-record late spring freezes were observed in northeastern Iowa and southern Wisconsin. Low temperature daily records were set both in the first half of the month and again in the last week of May. The count of low temperature daily records exceeded 700 across the region. Spring temperatures showed a different pattern, with near-normal temperatures in southern third of the Midwest and above-normal temperatures to the north. Regionwide spring temperatures averaged 50.1 degrees F (10.1 C) which was 1.6 degrees F (0.9 C) above normal. March warmth was responsible for the above-normal spring temperatures. Statewide values for the spring showed Iowa, Minnesota, Wisconsin, and Michigan all with temperature at least 2.0 degrees F (1.1 C) above normal. Only Kentucky was below normal, with temperatures averaging 0.1 degrees F (0.1 C) below normal for the spring.
- May precipitation was below normal for much of the Midwest. Regionwide totals were 3.27 inches (83 mm) which was 1.1 inches (28 mm) below normal. Parts of all nine Midwest states had precipitation totals of less than 75 percent of normal. Much of northern Minnesota and Upper Michigan had less than 50 percent of normal precipitation for May. All nine states also had areas with above normal precipitation, however the statewide totals of all nine states were below normal for the month. Southwestern Missouri was the wettest part of the region with over 150 percent of normal precipitation for the month. Spring precipitation also varied across the region. Regionwide precipitation totaled 9.23 inches (234 mm) which was 1.39 inches (35 mm) below normal. The driest areas were in northwestern Minnesota and also from central Iowa, to southern Wisconsin, to northeastern Illinois, and into much of Lower Michigan. Nearly all of Ohio and Lower Michigan had below normal precipitation. The wettest areas in the spring were in southern and western Missouri, and then extending into western Illinois. Michigan had its 10th driest spring while Missouri had its 24th wettest. Missouri was the only Midwest state that had above-normal precipitation for the spring.
- Lack of rainfall, increased water demand, and drying soils all contributed to worsening drought conditions in May. According to the June 1st U.S. Drought Monitor, more than 17 percent of the Midwest was in drought. While drought coverage in the region slightly decreased from the beginning of May, severe drought area more than doubled. Both the Milwaukee and northern Chicagoland area were in severe drought by the end of May as streamflow decreased and soil moisture dried out. According to USDA NASS, soil moisture in southeastern Wisconsin was 68 percent short to very short. Areas of southwestern Michigan were also in severe drought at the end of May, along with northwestern Iowa.
- Severe weather events were unseasonably lacking across the Midwest, with most of the reports coming on just five days. On May 3rd, strong storms spawned an EF-1 tornado near Tompkinsville, Kentucky. Weak tornadoes were also reported in southern Illinois as well on May 3rd and May 6th. On May 19th, several tornadoes were reported in southeastern Minnesota, while strong winds were reported on May 25th in northern Wisconsin and May 27th in southern Missouri and western Illinois. These were the only major events, leading to a total of more than 230 reports for May. This was only 40 percent of the total from 2020 and less than 20 percent of the reports in May of 2019.
- Drier conditions allowed farmers to plant corn and soybeans faster than average according to the USDA NASS Weekly Crop Progress Reports. Corn and soybeans were more than 90 percent planted in the Upper Midwest for the week ending May 30th. Soybeans in the southern half of the region were the only areas below 90 percent planted in the Midwest, where planting was near the five-year average. Topsoil moistures were closer to adequate in the southern half of the region, with concerns about short to medium term dryness in Iowa, Minnesota, and Michigan where drought is prevalent.
- For further details on the weather and climate events in the Midwest, see the weekly and monthly reports at the Midwest Climate Watch page.
Southeast Region (Information provided by the Southeast Regional Climate Center)
- Temperatures for the month of May ranged from near average across much of the Southeast and Puerto Rico to above average across much of the Florida peninsula. Monthly mean temperatures were within 2 degrees F (1.1 degrees C) of normal in more than 88 percent of the 188 long-term (i.e., period of record equaling or exceeding 50 years) stations across the region. There were only a handful of stations that ranked within the top 5 warmest or coldest values, including West Palm Beach, FL (1888-2021; 1st warmest May), Tampa Bay, FL (1890-2021; 5th warmest May), and Moulton, AL (1957-2021; 4th coldest May). Daily maximum temperatures ranged from 3.5 degrees F (1.9 degrees C) above normal in Punta Gorda, FL (1965-2021) to 5.7 degrees F (3.2 degrees C) below normal in Oneonta, AL (1894-2021). Likewise, daily temperature minimums ranged from 3.8 degrees F (2.1 degrees C) above average in West Palm Beach, FL (1888-2021) to 4.2 degrees F (2.3 degrees C) below average in Haleyville, AL (1902-2021). The warmest weather of the month occurred on the 24th -28th, as an upper-level ridge and surface high pressure persisted across the region. Daytime maximum temperatures reached or exceeded 95 degrees F (35 degrees C) across much of the region. Indeed, Wilmington, NC (1870-2021; T-1st warmest on the 27th) reached a maximum temperature of 98 degrees F (37 degrees C), and Richmond, VA (1871-2021; 1st warmest on the 26th) had a daily maximum temperature of 95 degrees F (35 degrees C). The University of South Carolina (1930-2021) reported its first daily maximum of 100 degrees F (38 degrees C) on May 24th, which usually isn’t seen until the middle of June. In contrast, the coldest weather of the month occurred on May 12th – 13th, as a continental high-pressure system ushered in cold, dry air from the northwest. Daily minimum temperatures fell below 45 degrees F (7.2 degrees C) across portions of every state north of Florida, with a few mountain locations dropping below freezing (0 degrees C), including, Mt. Mitchell, NC (1925-2021), which recorded a daily minimum of 28 degrees F (-2.2 degrees C). Daily maximum temperatures stayed below 60 degrees F (16 degrees C), setting new records in Raleigh, NC (1887-2021) and Rome, GA (1893-2021) at 57 degrees F (14 degrees C).
- Precipitation was especially variable across the Southeast region during May. The driest locations were found across Virginia, eastern North Carolina, Florida, and eastern Puerto Rico, where precipitation totals were 50 to less than 5 percent of normal. Fort Myers, FL (1902-2021) only received 0.04 inches (1.02 mm) of precipitation for the month, making this the driest May on record. In contrast, the wettest locations were found across central Alabama, northern Georgia, and western Puerto Rico, where precipitation totals were 150 to more than 200 percent of normal. Acworth, GA (1947-2021; 5th wettest) reported 8.4 inches (213 mm) of rainfall for the month, over 4 inches (102 mm) above normal. On the 4th, a line of thunderstorms produced heavy rainfall across Alabama, with 24-hour precipitation totals exceeding 6 inches (152 mm) and some reports of localized flooding. Alabaster, AL (1995-2021; 1st wettest) reported 6.25 inches (159 mm) of rain, and Birmingham, AL (1895-2021) received 3.59 inches (91 mm) of rain, which tied for the 4th wettest May day on record. The mountains of North Carolina and Virginia reported some snowfall for the month, with Beech Mountain, NC (2000-2021) observing 0.5 inches (13 mm).
- There were 512 reports of severe weather across the Southeast during May, which is 113 percent of the median monthly frequency of 452 reports during 2000-2019. There were 18 confirmed tornadoes reported for the month (1 EF-U,7 EF-0, 8 EF-1, and 2 EF-2), 164 percent of the monthly average of 11. The strongest tornado occurred on May 3rd in Greenwood, SC and was rated an EF-2 with winds of 125 mph (56 m/s). This tornado began near Russell Lake and heavily damaged trees and homes in its path. A person was injured as he was blown off his back porch, however, there were no fatalities with this storm. Another tornado rated EF-1, with winds of 110 mph (49 m/s) occurred in York County, SC, causing major damage at a family farm. Although no human injuries or fatalities were reported, about 4,000 turkeys were killed. On May 10th, lightning struck part of interstate 10 in Walton County, FL, sending debris into a pickup truck and causing two injuries. There were 45 reports of hail for the month, which was as large as hen-egg sized (2.00 inches) in Elizabethtown, NC, and Florence, SC. There were 444 wind reports for the month, which is 151 percent of average (294 reports). Strong winds were observed with the severe weather on May 3rd, bringing a tree down on top of a vehicle and killing the occupant in Douglasville, GA. A microburst occurred in Chapin, SC on May 4th with straight line wind speeds of 80-90 mph (36-40 m/s). Strong winds were also observed across the region on May 27th, with winds gusting to 83 mph (37 m/s) in Woodbridge, VA and reports of several trees and powerlines down.
- Below normal amounts of precipitation for the month of May intensified drought conditions across the eastern part of the region. Moderate drought (D1) increased in coverage across Virginia, North Carolina, South Carolina, and southern Florida. An area of severe drought (D2) developed in southern North Carolina and eastern South Carolina. Drought conditions continued in Puerto Rico, with a general area of abnormally dry conditions (D0) and embedded pockets of moderate drought (D1) persisting across the island. Producers in Florida increased irrigation due to warm temperatures and below normal rainfall for the month. Cotton and peanut planting have been delayed, as growers are waiting on more precipitation. Dry conditions in parts of Georgia have slowed the planting of cotton and other row crops. Some pastures throughout the state were also drying out, forcing livestock producers to rely on hay. Due to the above average precipitation in central Alabama, producers applied pesticides to eliminate pests impacting the cotton crop. Leaf curl was reported in tomato plants in the Pee Dee region of South Carolina, due to the higher temperatures at the end of the month. Irrigation had to be run in the Midlands region of the state to offset the dry conditions. Extremely dry conditions halted soybean, cotton, and peanut planting in eastern North Carolina.
- For more information, please visit the Southeast Regional Climate Center Home Page.
High Plains Region (Information provided by the High Plains Regional Climate Center)
- May was on the cool side throughout much of the High Plains, with some areas receiving ample precipitation while others remained dry. Heavy rains vastly improved drought conditions in eastern Colorado, western Kansas, and southwestern Nebraska. However, the presence of burn scars from the devastating wildfires that occurred along the Front Range of Colorado last fall increased the threat of flash flooding, and flooding also caused damage to several towns in Kansas. In the northern portion of the High Plains, very few areas received any relief from drought in May, and those areas that did get some rain will need a lot more to have significant improvements in conditions. One of the only benefits of the dryness was the ability to get ahead on spring planting.
- A multitude of drought impacts were evident across the region. In regards to crop conditions, barley, oats, and spring wheat were not faring well in North Dakota. Topsoil and subsoil moisture was rather depleted across North Dakota, South Dakota, and Wyoming, with North Dakota experiencing the worst conditions. Livestock producers in the Dakotas have been hit hard, as the lack of forage production and availability, low stock ponds, and poor water quality of stock ponds have resulted in increased cattle sales. As for pasture and range conditions, 67 percent of pastures were in poor or very poor condition in North Dakota, followed by South Dakota at 40 percent, and Wyoming at 38 percent. It is worth noting that conditions are much worse in the Northern Plains going into summer this year than they were during the last notable drought in this region, which occurred in 2017. Western Colorado has also been in drought since last year, and these conditions persisted through the spring, which was primarily due to a below-normal mountain snowpack. Many streams were at or near record low flows, which has resulted in low water allocations and a lack of irrigation across the area. Low streamflows are also expected to lead to fish kills this summer. Unfortunately, the summer outlook does not look promising for drought relief, as warm and dry conditions are expected across much of the region.
- Temperature
- May temperatures were near to below normal for much of the High Plains region, particularly east of the Rockies. The greatest departures occurred in central and eastern Kansas where temperatures were 2.0-4.0 degrees F (1.1-2.2 degrees C) below normal. Other areas that experienced below-normal temperatures included western and central North Dakota, the western half of South Dakota, northern and western Kansas, and eastern portions of Colorado and Wyoming. Temperatures were near to above normal for much of western Colorado and Wyoming, with departures ranging from 1.0-4.0 degrees F (0.6-2.2 degrees C) above normal. Monthly average temperatures were not extreme on either side of the spectrum and were certainly not record-breaking.
- As for spring (March-May), northern and eastern portions of the region generally had temperatures that were 1.0-4.0 degrees F (0.6-2.2 degrees C) above normal, whereas temperatures ranged from near normal to up to 3.0 degrees F (1.7 degrees C) below normal in southern and western areas of the High Plains. There were very few impressive spring temperature records, but it was the 9th warmest spring for Valentine, Nebraska (period of record 1889-2021).
- One very interesting outcome of the cooler temperatures that occurred during the latter part of spring for some areas was the prolonged blooming of flowers, as well as flowering trees and shrubs. According to a horticulture agent from Kansas State University, flowers that bloomed longer than normal included daffodils, peonies, and tulips. This extension of the flower blooming season created a very colorful spring landscape that was enjoyed by many.
- Precipitation
- Precipitation extremes were evident across the High Plains in May. The wettest areas included eastern Colorado, western Kansas, southwestern Nebraska, and portions of western North Dakota and South Dakota, where precipitation ranged from 150-300 percent of normal. The extreme wetness in eastern Colorado caused several locations to break into the top 10 of wettest Mays, including Alamosa (3rd wettest), Pueblo (3rd wettest), and Akron (9th wettest). This precipitation was quite beneficial, as drought conditions eased considerably across this area. However, heavy rains caused flooding in some places. For instance, in Kansas, the town of Tribune flooded after receiving heavy rain in a short amount of time. The Tribune 1W COOP station reported an astounding 5.66 inches (144 mm) of rain on the 16th, which was the highest 1-day total precipitation ever recorded at this location (period of record 1893-2021). Tribune also ended up having its wettest May on record with 9.44 inches (240 mm) of precipitation. This same storm system produced flash flooding in Natoma, Kansas, where over half the homes received moderate to severe damage or were a total loss. According to the mayor of Natoma, this flood caused more damage than the Great Flood of 1993.
- On the other hand, a large portion of the High Plains experienced a dry May. Less than 70 percent of normal precipitation fell across much of Wyoming, western Colorado, the eastern Dakotas, eastern Nebraska, and southeastern Kansas. Fargo, North Dakota, which has been in drought since last year, had its driest May on record with only 0.37 inch (9 mm) of precipitation (period of record 1881-2021). Although the widespread dryness across the region did not help the drought situation, it did advance spring planting.
- The spring season (March-May) ended up being extremely wet for the southern half of Nebraska, northern and western Kansas, and eastern Colorado. Akron, Colorado had its wettest spring on record with 10.78 inches (274 mm) of precipitation (period of record 1937-2021). However, most of the High Plains region had a dry spring. It was the 5th driest spring for Fargo, North Dakota, receiving only 2.29 inches (58 mm) of precipitation (period of record 1881-2021). Spring snowfall totals varied across the High Plains as well. For instance, Casper, Wyoming had its 4th snowiest spring on record with 61.5 inches (156 cm) of snow (period of record 1939-2021), while Lincoln, Nebraska tied with several years for its 2nd least snowiest spring, recording only a trace of snow (period of record 1948-2021).
- Upper Missouri Basin mountain snowpack continued to melt out in May. According to the U.S. Army Corps of Engineers, as of June 1st, Snow Water Equivalent (SWE) was 80 percent of average above Fort Peck Reservoir and 65 percent of average between Fort Peck and Garrison Reservoirs. Due to drought conditions in portions of the upper Basin, runoff is expected to be much lower than average this year. As of June 3rd, the upper Missouri Basin runoff forecast was 17.9 million acre-feet, which is 69 percent of average. Streamflows varied across the region. Many streams in western Colorado were at or near record lows for this time of the year due to drought and early meltout. Ongoing drought was also responsible for low streamflows in northern and eastern North Dakota. However, recent heavy rains caused streamflows to be much above normal in central and eastern Kansas.
- On the whole, drought conditions improved in the High Plains in May. According to the U.S. Drought Monitor, the area experiencing drought (D1-D4) decreased from approximately 64 percent to 48 percent over the course of the month. The area experiencing abnormal dryness and drought (D0-D4) decreased from about 82 percent to 69 percent.
- There were several areas that experienced improvement in drought conditions during May, with some places improving by three drought classes. Monthly precipitation exceeding 3.00 inches (76 mm) above normal in some locations vastly improved drought conditions across eastern Colorado, northwestern Kansas, and southwestern Nebraska. With the exception of a small area in extreme southern Colorado, the aforementioned areas were drought-free by the end of the month. Another area that had significant improvement in drought conditions in May was central Wyoming. Snowfall across the mountains improved Snow Water Equivalent (SWE) in several basins, and other indicators began pointing to improving conditions. Portions of this region were also drought-free by the end of the month.
- Meanwhile, degradations in drought conditions occurred in several locations of the High Plains in May, but most notably across the Dakotas. For instance, an area of exceptional drought (D4), which is the most intense category of drought, was introduced to central North Dakota. This was only the 3rd time the state had experienced this level of drought since the U.S. Drought Monitor began in 2000.
- For more information, please visit the High Plains Regional Climate Center Home Page.
Southern Region (Information provided by the Southern Regional Climate Center)
May 2021 was relatively cool and wet across the Southern United States. During May, drought conditions retreated dramatically in Texas and Oklahoma.
- Temperature
- Every state in the Southern Region experienced temperatures that were below the historical median. Oklahoma's average temperature of 65.9 °F (18.8 °C) was the 21st coolest May on record (all rankings are based on 1895-present). Other states, while not necessarily warmer in absolute terms, were not ranked as low: Tennessee 64.3 °F (17.9 °C), 32nd coolest May on record; Arkansas 66.8 °F (19.3 °C), 28th coolest May on record; Mississippi 70.4 °F (21.3 °C), 43rd coolest May on record; Texas 71.8 °F (22.1 °C), 45th coolest May on record; and Louisiana 72.3 °F (22.4 °C), 36th coolest May on record. The six-state region overall averaged 69.8 °F (21.0 °C), which was the 27th coolest May on record. Across the region, the highest maximum temperature observed was 109 °F (43 °C), at Falcon Dam and Castolon in Texas, while the highest minimum temperature was 79 °F (26 °C) at numerous coastal cities in Texas. The lowest temperatures were at Mt. Leconte in Tennessee on May 8: a high of 37 °F (3 °C) and a low of 23 °F (-5 °C).
- Precipitation
- May 2021 was the fifth wettest May on record in both Louisiana and Texas. The statewide average was 11.01 inches (280 mm) in Louisiana and 6.04 inches (153 mm) in Texas. In Louisiana, six stations with more than 50 years of data recorded their wettest May on record. Donaldsonville, with climate records going back to 1893, set their all-time single-month record with 25.27 inches (642 mm), the 13th highest May total ever officially recorded in Louisiana, and Plaquemine also established a new single-month record at 22.14 inches (562 mm). In Texas, 19 stations with more than 50 years of data set new May records, including Victoria at 20.28 inches (515 mm) and Kingsville with its wettest month ever at 20.94 inches (532 mm). Even Mountain Home, Arkansas, set a new May record with 14.95 inches (380 mm). Arkansas as a whole ranked 34th wettest, while Oklahoma and Mississippi were 47th wettest and 51st wettest, respectively, and Tennessee was 58th driest (70th wettest). On the whole the six-state region ranked 7th wettest, behind two other recent wet Mays: 2015 (wettest) and 2019 (4th wettest).
- Drought:
- Particularly in Texas, the extensive May rains led to substantial reduction in drought conditions. Across the Southern Region, according to the US Drought Monitor, drought coverage decreased from 35% on April 27 to 11% on June 1, and extreme drought declined from 12% to 3% over the same period. The largest improvements were in southern and western Texas. It remains to be seen to what extent the recent rains ameliorated potential agricultural losses due to the early spring drought conditions. In Tennessee, meanwhile, abnormal dryness emerged in central and eastern parts of the state.
- Notable Weather:
- In a wet month, May 17-18 stands out as the wettest day. Single-day totals of a foot (250 mm) or more of precipitation occurred in or near Baton Rouge and Lake Charles in Louisiana and Beaumont in Texas. According to a Baton Rouge Parish Fire Department spokesperson, first responders rescued more than 250 people from high water and related emergencies in the Baton Rouge area. Lake Charles reported its third highest single-day precipitation total on record, a difficult blow in the aftermath of hurricanes Delta and Laura in 2020. Overall in Louisiana, according to contemporary news reports sourced to the Louisiana Department of Health, there were three deaths apparently directly attributable to flooding and another caused by associated power outages.
- Severe Weather:
- The most widespread severe weather event of the month was the pair of severe wind events on May 3-4. The first was a derecho that developed in northeastern Texas late on the afternoon of the 3rd and swept across southeastern Oklahoma, western, central, and northeastern Arkansas, and much of Tennessee overnight and into the morning of May 4. The second was associated with multiple thunderstorm complexes on the afternoon and evening of May 4 in eastern Texas, northern Louisiana, extreme southern Arkansas, and central Mississippi. The strongest winds reported during this event were 87 mph (39 m/s) in Sulphur Springs, Texas. One Tennessee fatality was attributed to another wind outbreak in northeastern Mississippi and west and central Tennessee on May 6. Of the 68 tornado reports in the Southern Region, most were in Texas and Mississippi. Unusually for May in Oklahoma, the only tornado reports were in the extreme western Oklahoma Panhandle. No fatalities associated with tornadoes were reported. Although every state reported hail, the vast majority of reports were from Texas. Hail at least 3 inches (8 cm) in diameter was reported on five separate days, with the sole non-Texas report being from Oklahoma.
- For more information, please visit the Southern Regional Climate Center Home Page.
Western Region (Information provided by the Western Region Climate Center)
- An anomalously strong ridge of high pressure centered several hundred miles off the coast of Oregon persisted for much of May. This pattern led to below normal precipitation for the coastal states and throughout the Southwest with an area of above normal precipitation in the northern Rockies. A cutoff low-pressure system in mid-May also brought beneficial precipitation to parts of the Great Basin. Temperatures were above normal throughout California (except for some coastal areas) and the Four Corners region, below normal across Montana, and near normal elsewhere.
- May marks the transition into the dry season for coastal states in the West and is one of the driest months of the year for Arizona, southern Nevada, and southeast California. Nonetheless, May precipitation can be beneficial, particularly during drought years. A large swath of the coastal states and Arizona saw less than 5% of normal precipitation. San Francisco, California recorded just 0.02 in (0.5 mm) of precipitation and 3% of normal. Medford, Oregon logged 0.13 in (3.3 mm) at 10% of normal coming in as the 6th driest May since records began in 1911. In Missoula, Montana, where May is the 2nd wettest month of the year climatologically, 2.61 in (66.3 mm; 147% of normal) of precipitation fell making it the 11th wettest May on record; Great Falls, Montana received 4.3 in (109.2 mm; 177% of normal) and was the 6th wettest on record. Several cutoff lows brought 1.51 in (38.4 mm; 124% of normal) of precipitation that all fell from May 15 to May 23 to Elko, Nevada bringing some much-needed moisture to the drought-stricken region.
- Above normal temperatures were widespread throughout inland California with the greatest anomalies in the northern part of the state. Shasta Dam, located at the outflow of Lake Shasta (California’s largest reservoir), recorded its 3rd warmest May since 1943 at 72.7 °F (22.6 °C), +5.6 °F (+3.1 °C) above normal; Sacramento, California logged the 5th warmest May since records began in 1878 at 71.8 °F (22.1 °C), +4.1°F (+2.3 °C) above normal. A stark contrast was found in much of coastal California as temperatures remained near-to-below average in May due to strong upwelling in the Pacific Ocean along the coast and below normal sea surface temperatures. Half Moon Bay, California saw its 8th coldest May since records began in 1940 at 52.6 °F (11.4 °C), -2.3 °F (-1.3 °C) below normal; San Francisco, California recorded an average temperature of 55.9 °F (13.2 °C), -1.9 °F (-1.1 °C) below normal. Below normal temperatures accompanied the wet pattern in the northern Rockies. Great Falls, Montana saw its 6th coldest May since 1937 at 48.6 °F (9.2 °C), -2.9 °F (-1.6 °C) below normal.
- At the end of May 82% of the West was in drought with 23% in exceptional drought according to the US Drought Monitor. Drought conditions intensified in May throughout California, Nevada, Oregon, Washington, Idaho, and Utah due to the warm and dry pattern. Drought improvements were found in Wyoming, Montana, and New Mexico. Water supply concerns along the Colorado River are mounting as Lake Mead and Lake Powell, the nations two largest reservoirs, sit at 36% and 34% of capacity, respectively. Forecasted total April-July inflow into Lake Powell is just 26% of normal despite April 1 snow water equivalent in the Upper Colorado River Basin being 86% of normal.
- In Alaska precipitation was well below normal in the Seward Peninsula and generally below normal throughout the western half of the state. Above normal precipitation was found throughout the Southeast Interior with mixed bag of above and below normal precipitation for the rest of the state. Temperatures were cooler than normal in the Panhandle and most of Southcentral and well above normal in the Seward Peninsula and Southwest Alaska. Nome, in the Seward Peninsula, received just 0.15 in (3.81 mm; 17% of normal) of precipitation and recorded its 8th warmest May since 1907 at 42.3 °F (5.7 °C), +5 °F (+2.8 °C) above normal. In the Panhandle, Juneau had its 2nd wettest May since records began in 1937 with 6.91 in (175.5 mm; 197% of normal) and only six days in the month without measurable precipitation.
- In Hawaii, drier than normal conditions were found throughout Oahu, Lanai, and Molokai. At Lanai City zero precipitation was recorded in May for only the third time since records began in 1930 with all three instances occurring since 2003. Honolulu tied for the 2nd driest May since 1940 with 0.03 in (0.76 mm; 4% of normal) of precipitation.
Significant Events
- Lake Mead, Nevada falls below critical water shortage threshold: In late May the elevation of the water surface in Lake Mead fell below 1,075 feet which is the threshold for a Tier 1 federal water shortage. The lake also fell below this mark in 2015 and 2016 but recovered leading to no shortage being declared. Projections for the US Bureau of Reclamation show no recovery for 2021 and continued declines into 2022. If these projections hold true the first-ever shortage on the Colorado River would be declared in August 2021 and restrictions would go into effect January 1, 2022. Nevada and Arizona would be impacted the most by these restrictions while water deliveries to California would not be implemented in the Tier 1 phase.
- For more information, please go to the Western Regional Climate Center Home Page.