National Overview

January Highlights


January Temperature
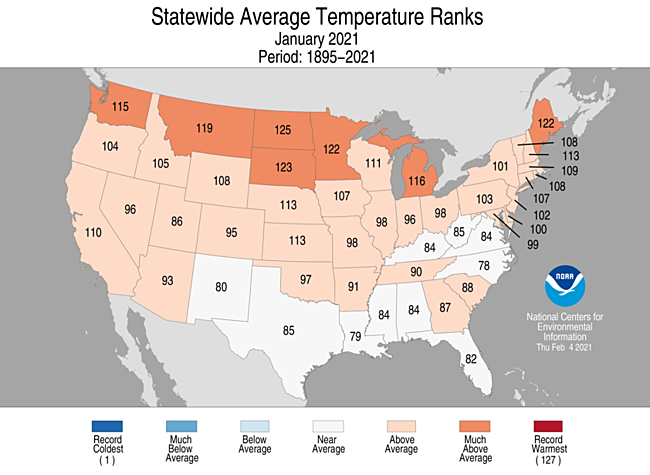
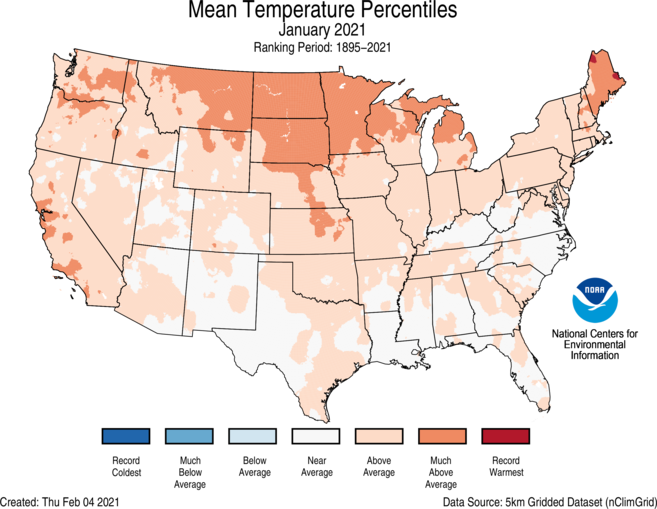
- For January, the average contiguous U.S. temperature was 34.6°F, 4.5°F above the 20th century average, tying with 1923 as the ninth warmest in the 127-year record. This was the 10th consecutive January with temperatures at least nominally above the 20th century average for the month.
- Above-average temperatures were observed across much of the West, northern and central Plains, Great Lakes and Northeast. North Dakota and South Dakota ranked third and fifth warmest on record, respectively. No state across the Lower 48 ranked below average for the month.
- Above-average temperatures across the Great Lakes during the first two months of winter helped prevent ice from forming on the lakes. On January 21, only 2.4 percent of the entire lake surface was covered by ice. This is the lowest amount of ice coverage for this date in the last 48 years. Peak ice coverage is expected to span only 30 percent of the lake surface sometime from mid-February to early March. Average peak ice coverage is around 53 percent.
- The Alaska average January temperature was 11.0°F, 8.8°F above the long-term mean ranking 13th warmest in the 97-year record and was the warmest January since 2016. Temperatures across the state were consistently warmer than average with widespread areas in the interior regions 5°F to 10°F above average.
- Warm January temperatures contributed to the ninth-lowest Bering Sea ice extent in the last 43 years. This was lower than the last two years, but greater than the extent seen in 2017 and 2018.
- The nationally averaged maximum temperature (daytime highs) was warmer than average during January at 44.0°F, 3.6°F above average, ranking in the warmest third of the 127-year record. Parts of the West Coast, Northern Tier and New England had temperatures which were much above average for the month. A small pocket of below-average maximum temperatures was evident across a portion of the Deep South.
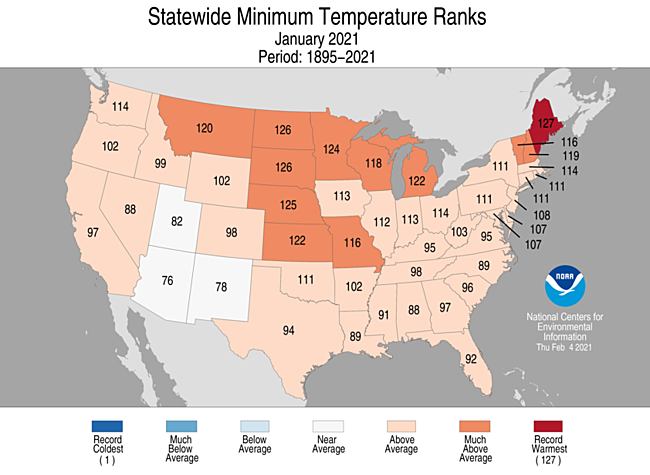
- The nationally averaged minimum temperature (overnight lows) during January was 25.1°F, 5.4°F above average and ranked as the sixth highest January average in the 127-year record. North and South Dakota ranked second warmest minimum temperature for the month while Maine ranked warmest. No state ranked below-average for minimum temperatures during January.
- Warm records in January outpaced cold records by a three-to-one margin. As of February 8, there were 1,918 warm daily high (787) and low (1,131) temperature records tied or broken during January. There were approximately 651 daily cold high (442) and low (209) temperature records set during the month.
- Based on NOAA's Residential Energy Demand Temperature Index (REDTI), the contiguous U.S. temperature-related energy demand during January was 54 percent below average and ranked as the 14th lowest value on record.
January Precipitation
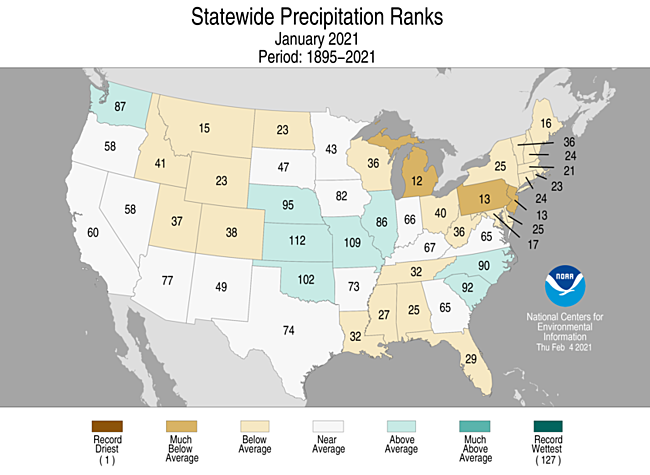
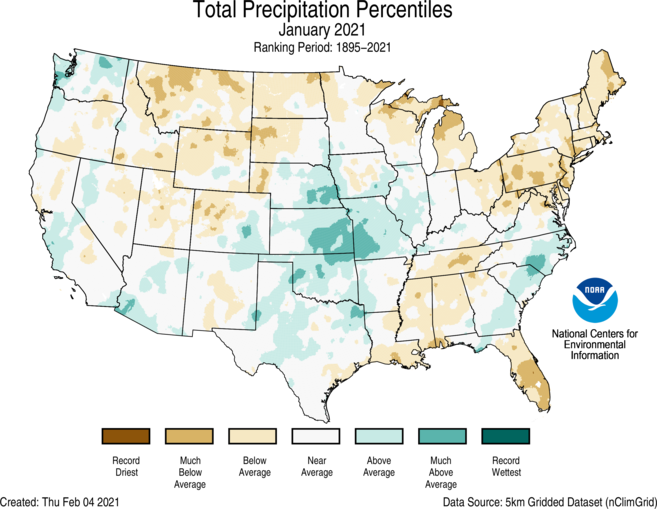
- The January precipitation total for the contiguous U.S. was 2.01 inches, 0.30 inch below average, and ranked in the driest third of the 127-year period of record.
- During January, above-average wetness was observed across portions of the West Coast, central and southern Plains and parts of the Southeast.
- An atmospheric river, or a plume of concentrated moisture in the atmosphere, impacted the West Coast from January 27-29. More than 7 inches of precipitation fell from parts of southern California to the central California coast. The Sierra Nevada range received several feet of snow, closing down major highways. In addition to significant rain and snow, winds up to 125 miles per hour were reported near Lake Tahoe, California, as well as extensive power outages and mudslides across parts of the region. This event helped reduce some of the drought that has impacted coastal regions of the West Coast for many months.
- Below-average precipitation occurred across much of the Rockies, Northern Tier, Great Lakes, parts of the South and the Northeast.
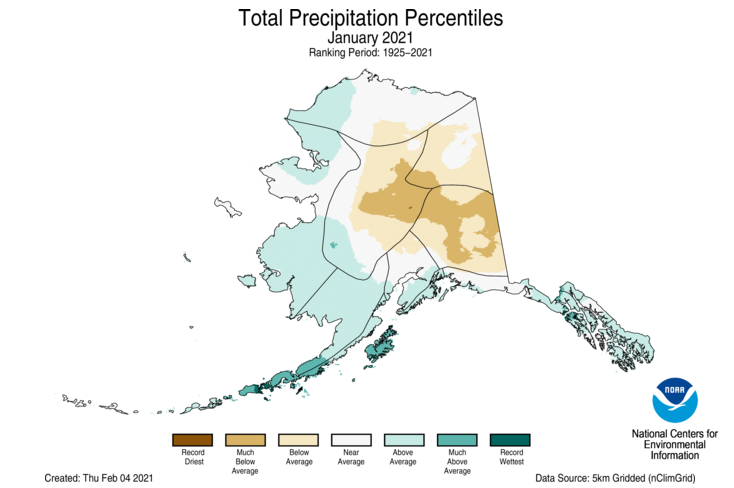
- Alaska ranked in the wettest third of the historical record for January. The interior regions were drier than average while the West Coast, Aleutians, Bristol Bay, the Northwest Gulf and the Panhandle had above-average precipitation.
- Fairbanks reported 0.5 inch of snow in January. This is the lowest January snowfall total on record for Fairbanks (since 1915).
- In the Panhandle, Ketchikan accumulated 77.64 inches of precipitation over the November to January period, which is 168 percent of average and the fourth-highest total on record for this three-month period.
- According to the February 2 U.S. Drought Monitor report, approximately 45.8 percent of the contiguous U.S. was in drought, which is approximately 3 percent less than at the end of December. Drought conditions expanded across portions of the northern Rockies and northern Plains and developed in parts of the lower Mississippi Valley. Improvements occurred across portions of the central Plains, Deep South, Southwest, and parts of the West Coast. Hawaii saw a 7 percent reduction in drought coverage, while Puerto Rico experienced some drought expansion during January.
Regional Highlights
These regional summaries were provided by the six Regional Climate Centers and reflect conditions in their respective regions. These six regions differ spatially from the nine climatic regions of the National Centers for Environmental Information.
Northeast Region (Information provided by the Northeast Regional Climate Center)
- The Northeast’s average temperature of 27.2 degrees F (-2.7 degrees C) was 4.0 degrees F (2.2 degrees C) above normal. All twelve Northeast states were warmer than normal with departures ranging from 1.8 degrees F (1.0 degrees C) above normal in West Virginia to 7.6 degrees F (4.2 degrees C) above normal in Maine. This January ranked among the 20 warmest on record for five states: Maine, sixth warmest; New Hampshire, 15th warmest; Massachusetts, 19th warmest; and Rhode Island and Vermont, 20th warmest.
- It was the 13th driest January on record for the Northeast with 2.03 inches (51.56 mm) of precipitation, 65 percent of normal. Precipitation for all 12 Northeast states ranged from 57 percent of normal in Pennsylvania to 80 percent of normal in West Virginia. Four states experienced one of their 20 driest Januarys on record: New Jersey and Pennsylvania, 14th driest, and Maine and Maryland, 17th driest. Despite the overall dryness of the month, Erie, Pennsylvania, had its wettest January day on record with 1.60 inches (40.64 mm) of precipitation on January 18. The previous record was 1.51 inches (38.35 mm) on January 7, 1998.
- The U.S. Drought Monitor from January 5 showed 4 percent of the Northeast in a moderate drought and 17 percent of the region as abnormally dry. These areas included portions of northern New England, New York, and Pennsylvania. There were only minor changes in conditions during January, with slight expansion of moderate drought and/or abnormal dryness in northeastern Vermont, northern New Hampshire, western Maine, and far northern New York but the easing of small areas of abnormal dryness in southern Maine, southeastern New Hampshire, and northwestern New York. Conditions were unchanged during January for the rest of the region. The U.S. Drought Monitor from January 26 showed 5 percent of the Northeast in a moderate drought and 16 percent of the region as abnormally dry.
- For more information, please visit the Northeast Regional Climate Center Home Page.
Midwest Region (Information provided by the Midwest Regional Climate Center)
- January temperatures were above normal across the entire Midwest. Departures from normal ranged from just 1 degrees F (0.6 C) above normal in the southern parts of the region to more than 10 degrees F (5.6 C) above normal in the northwestern corner of Minnesota. The region-wide average temperature was 27.4 degrees F (-2.6 C) which was 5.3 degrees F (2.9 C) above normal. This ranked as the 12th warmest January on record (1895-2021) for the region. Warmth in the first three weeks of the month was widespread and gave way to some colder than normal temperatures during the last 10 days of the month. Minnesota recorded its 4th warmest January while Michigan and Wisconsin were also among their top-10 warmest. Hallock, Minnesota (101 years on record) broke its record for warmest January.
- January precipitation varied considerably across the region, but the overall average was 1.40 inches (36 mm) which was 0.37 inches (9 mm) below normal. Dry conditions in the northern and eastern parts of the region offset wet conditions in the southwestern and southern parts of the region. Michigan recorded its 11th driest January on record (1895-2021). The lack of precipitation in the northern areas was also noticeable in the snow totals for that area. Iowa, northern Missouri, and along the Illinois-Wisconsin border had above normal snowfall, but the rest of the region was below normal. Missouri was the wettest with a good portion of the state picking up more than twice the normal precipitation total for January.
- Significantly less snow fell across a large portion of the Midwest in January. Areas in Minnesota, Michigan, northern Wisconsin and Kentucky had less than half the normal amount of snowfall during the month. The most pronounced snowfall departures were in the lake-effect regions of Michigan, where departures of 10 to 30 inches (25 to 76 cm) below normal were observed. Marquette, Michigan (136 years on record) broke its minimum snowfall record for January with just 3.5 inches (9 cm). The previous record was in 1942. However, heavy snowfall impacted Iowa and parts of northern Missouri, southern Wisconsin, and northern Illinois during the month. Areas in southwestern Iowa and extreme northwestern Missouri had more than twice the normal amount of snow in January. Many others had more than 1.5 times the normal in this heavy snow band. Several storms impacted these same areas during the first half of January ahead of an intense storm on January 25th through the morning of January 26th. Amounts of 8 to 12 inches (20 to 30 cm) were common across southwestern Iowa from the storm.
- Despite a drier than normal January in the Midwest, drought coverage decreased slightly with low water demand and well-placed precipitation. Overall, drought covered dropped around 1.5 percent according to the January 28th U.S. Drought Monitor compared to the start of the month. Drought severity also slightly decreased in western Iowa. However, abnormally dry conditions increased across the Upper Midwest. All of Minnesota was either abnormally dry or in moderate drought at the end of the month, with most of northern Wisconsin also abnormally dry.
- For further details on the weather and climate events in the Midwest, see the weekly and monthly reports at the Midwest Climate Watch page.
Southeast Region (Information provided by the Southeast Regional Climate Center)
- Temperatures were near average to above average across much of the Southeast region and Puerto Rico for the month of January. Monthly mean temperatures were within 2 degrees F (1.1 degrees C) of average for 70 percent of the 139 long-term (i.e., period of record equaling or exceeding 50 years) stations across the region. Consequently, there were no long-term stations that observed their warmest or coldest January on record. However, Truman Field Airport, USVI (1953-2020) tied for the seventh warmest January on record. Due to a strong temperature inversion and the persistence of fog in the valley location, the greatest range in daily maximum temperatures across the entire region occurred in the mountains of western North Carolina, from 5.3 degrees F (2.9 degrees C) above normal in Celo, NC (1948-2021) to 3.6 degrees F (2 degrees C) below normal in Marion, NC (1893-2021). Daily temperature minimums ranged from 7.7 degrees F (4.3 degrees C) above normal in Marion, NC (1893-2021) to 2 degrees F (1.1 degrees C) below normal in Fort Pierce, FL (1901-2021). The first week of the year was exceptionally warm, with much of the region recording mean temperatures more than 15 degrees F (8.3 degrees C) above normal. Daily maximum temperatures exceeded 60 degrees F (16 degrees C) across portions of every state, with parts of Florida exceeding 80 degrees F (26.7 degrees C). Indeed, Plant City, FL (1892-2021), had a daily maximum temperature of 87 degrees F (31 degrees C) on the 1st setting a daily record. In contrast, the coolest weather of the month across the Southeast occurred on the 29th and 30th, as the circulation around a departing mid-latitude cyclone ushered in cold, dry air from Canada. Daily minimum temperatures fell below 30 degrees F (-1.1 degrees C) as far south as northern Florida, with Crestview, FL (1948-2021) reaching 29 degrees F (-1.7 degrees C). Several stations to the north, however, had daily minimum temperatures that fell below 20 degrees F (-6.7 degrees C), including Richmond, VA (1871-2021) at 17 degrees F (-8.3 degrees C) and Mt Mitchell (1925-2021) at 7 degrees F (-14 degrees C).
- Precipitation was variable across the Southeast region during January, with a few wet and dry extremes recorded. The driest locations were found across Florida, Alabama, northern Georgia, northern Virginia, and Puerto Rico. Monthly precipitation totals ranged from 50 to less than 5 percent of normal across these locations. Melbourne, FL (1937-2021; 2nd driest) only received 0.04 inches (1 mm) of precipitation, which was over 2 inches (51 mm) below normal for the month. St. Thomas, USVI (1953-2021) reported its 3rd driest January on record with only 0.75 inches (19 mm) of precipitation, and Roosevelt Roads, PR (1942-2021) had its 7th driest January observing only 1.27 inches (32 mm) of precipitation. In contrast, the wettest locations were located across southern Georgia, central South Carolina, and eastern North Carolina. Precipitation totals ranged from 150 to 300 percent of normal. Indeed, Cape Hatteras, NC (1874-2021) received 7.47 inches (190 mm) of precipitation, which was more than 2 inches (51 mm) above average. A few low-pressure systems brought snowfall to the Southeast region throughout the month. From January 7th – 8th a low- pressure system tracking across the deep South brought light snowfall from northern Georgia to Virginia. Charlotte, NC (1878-2021) measured .1 inches (2.5 mm) of snowfall and continues to report a trace or more of snow every year for the period of record. On January 11th another low-pressure system on a similar track brought measurable snowfall to northern Alabama, as Huntsville, AL (1894-2021) observed .3 inches (7.6 mm). On January 28th, yet another low-pressure system on a similar track brought 7.3 inches (183 mm) of snow to Lynchburg, VA (1893-2021) and 5.3 inches (135 mm) of snowfall to Roanoke, VA (1912-2021). The instability with this extremely dynamic system contributed to the rare occurrence of thundersnow in Wake County, NC. Washington, D.C. (1871-2021) measured 2.3 inches (58 mm) of snow on January 31st, ending its second longest streak of no measurable snowfall over 1 inch (25 mm). The highest amounts of snowfall for the month, were reported across the higher elevations of the region, with Burkes Garden, VA (1896-2021) measuring 24.3 inches (617 mm) and Beech Mountain, NC (1991-2021) measuring 21.6 inches (549 mm).
- There were 26 reports of severe weather across the Southeast during January, which is 46 percent of the median monthly frequency of 57 reports during 2000-2019. There were 7 confirmed tornadoes reported for the month (3 EF-0, 3 EF-1, 1 EF-3), which is the monthly average. The strongest of these tornadoes was rated EF-3 with winds of 150 mph (67 m/s) and occurred in Jefferson County, AL on January 25th. It caused substantial damage in a subdivision, with a home swept off its foundation and debris thrown a considerable distance. A teenager was killed and several of his family members were critically injured when their home collapsed, trapping them in the basement. In total, 30 injuries and 1 fatality were reported. This was the first EF-3 or stronger tornado in January for Alabama since 2012. Another EF-1 tornado with winds of 95 mph (42 m/s) occurred in Monroe County, GA on January 1st. This tornado flipped a mobile home on its side, causing one injury. There were no reports of hail for the month and only 18 wind reports for the month, which is 38 percent of the average (48 reports). A strong low-pressure system on January 28th brought strong gusty winds to parts of the Southeast. There were numerous reports of wind damage with wind gusting up to 51 mph (23 m/s) in Asheville, NC.
- Drought slightly intensified for Alabama and Puerto Rico, and abnormally dry conditions (D0) increased in coverage across portions of Florida and Georgia in January. At the beginning of the month, pockets of abnormally dry conditions (D0) were found in Georgia, Alabama, Florida, South Carolina and northern Puerto Rico. By the end of the month, these pockets of dryness (D0) expanded with a small area of moderate drought (D1) developing in Alabama, as well as in northern Puerto Rico. Growers had to irrigate the groves, as dry conditions developed in the citrus growing region of Florida. Persistent rains in some locations in Georgia has led to pasture conditions being subpar compared to previous years and hay was being fed at a rapid pace. Vegetable planting was delayed in some areas due to the wet field conditions. Untimely rainfall hampered the last of the winter wheat planting in South Carolina. Due to cold, wet conditions, cover crops and small grains grew slowly. A few producers were able to begin preparing fields for spring row crop planting when breaks in the rain allowed. Wet conditions delayed field activity in North Carolina. Pastures are muddy and small grain crops were showing nutrient deficiencies due to the saturated soil conditions. Cold weather kept blueberry bushes dormant, and farmers are hopeful that early maturity varieties will not blossom in February as they did in 2020.
- For more information, please visit the Southeast Regional Climate Center Home Page.
High Plains Region (Information provided by the High Plains Regional Climate Center)
- January was an eventful month for the High Plains region. In northern parts of the region, extreme “warmth” was a consistent feature, as temperatures were routinely much above normal. This resulted in monthly temperature departures of up to 15.0 degrees F (8.3 degrees C) above normal. The relative warmth, along with dry conditions, led to an overall expansion of drought conditions in the Dakotas, which is rare in the winter. Meanwhile, heavy rain and snow in eastern parts of Kansas and Nebraska set new records and helped improve or alleviate drought conditions there. In western areas of the region, drought continued to be a prominent feature, with mountain snowpack below median for this time of the year.
- Towards the middle of the month, a powerful storm system brought widespread strong winds to the region, damaging structures, causing rollovers, and closing interstates and highways. The highest gusts were reported in western parts of the Dakotas, Nebraska, and Kansas, along with Colorado and Wyoming. Wind gusts of at least 75 mph (121 km/hr) were reported in each of the High Plains states, with gusts over 90 mph (145 km/hr) at isolated locations. These were some of the highest non-thunderstorm wind gusts in recent years. With little to no snowpack and drought conditions in place, the high winds increased the fire danger and several grass fires spread quickly in western parts of the Plains. A particularly large grass fire burned near the town of Lemmon, located in northwestern South Dakota. The fire started just across the state line in North Dakota and traveled quickly to the southeast. Ultimately, more than 15,000 acres burned, causing evacuations and structural damage. Another fire near the town of Benkelman, NE also caused evacuations. Just to the south, the high winds fueled a large dust storm, impacting areas along the Colorado/Kansas border, down into the Oklahoma and Texas panhandles. I-70 from just east of Denver, CO to the Kansas border was closed due to poor visibility and several accidents. Eastern parts of the region were also impacted by strong winds, snow, and blowing snow, which created treacherous travel conditions.
- Temperature:
- Above-normal temperatures continued to prevail across the majority of the High Plains region this month. Portions of eastern and central Kansas and Nebraska had widespread departures up to 6.0 degrees F (3.3 degrees C) above normal, while much of the Dakotas had departures in the 6.0-12.0 degrees F (3.3-6.7 degrees C) above normal range. A low or non-existent snowpack across the Plains portion of the region contributed to these departures. Temperatures were generally within a few degrees of normal elsewhere in the region, with slightly below-normal temperatures confined to central and western areas of Colorado and Wyoming.
- The extremely large monthly temperature departures across the northern tier of the region caused numerous locations to rank among the top 10 warmest Januarys on record. For instance, Aberdeen, SD had its 4th warmest January on record with an average temperature of 25.1 degrees F (-3.8 degrees C), which was 13.1 degrees F (7.3 degrees C) above normal (period of record 1893-present)! Although extremely “warm” for this time of the year, this month’s temperatures could not beat out those of January 2006, which was the warmest January on record not only for Aberdeen, but for many locations throughout the region.
- As mentioned earlier, this pattern of above-normal temperatures was a continuation from previous months. In fact, several locations have had consecutive top 10 warmest months recently. For instance, Mobridge, SD had its 9th warmest November, 3rd warmest December, and 2nd warmest January (period of record 1911-present).
- Precipitation:
- Precipitation varied across the High Plains region this month, with some areas receiving record-breaking precipitation and others receiving little to none. Overall, much of the region received less than 75 percent of normal precipitation. Although not record-breaking for most locations, a few of the drier locations did have a top 10 driest January on record. For instance, with only 0.04 inch (1 mm) received this past month, Rapid City, SD had its 4th driest January on record (period of record 1942-present). While precipitation deficits do not build quickly in the winter, it is worth noting that longer-term deficits, coupled with above-normal temperatures and a low snowpack have caused an increase in drought conditions, along with concerns about fire risk and winter wheat condition. Not all areas of the region were dry, however. The wettest areas included eastern parts of Kansas, Nebraska, and South Dakota, along with pockets of Colorado and Wyoming, where precipitation totals were at least 150 percent of normal. Large areas of eastern Kansas and eastern Nebraska had totals up to 400 percent of normal. Since January is one of the driest months of the year, this translated into departures ranging from about 0.75 inch (19 mm) above normal in eastern Nebraska to about 3.00 inches (76 mm) above normal in portions of southeastern Kansas. This precipitation caused some locations to rank among the top 10 wettest Januarys on record. For instance, Wichita, KS had its 4th wettest January with 2.86 inches (73 mm) of precipitation (period of record 1888-present). Much of this fell in just two days - January 25th and January 30th. Both days had precipitation in excess of 1.00 inch (25 mm), which is exceedingly rare in the winter in the Plains. While Wichita received heavy rainfall on January 25th, areas to the north experienced an historic snowstorm. This potent storm dropped 6.0-12.0 inches (15-30 cm) of snowfall across an area stretching from north-central Kansas through eastern Nebraska and central Iowa, with snowfall rates approaching 1.0-2.0 inches (3-5 cm) per hour at times. Lincoln, NE had some of the highest snowfall amounts, with 2-day storm totals around 15.0 inches (38 cm). Observations at the Lincoln Airport indicated a storm total of 14.8 inches (38 cm), of which 14.5 inches (37 cm) fell on the 25th. This was Lincoln’s highest 1-day snowfall for the month of January and the second highest 1-day snowfall for any month (period of record 1948-present). The highest 1-day snowfall for Lincoln occurred on February 11, 1965 with 19.0 inches (48 cm).
- The Upper Missouri Basin mountain snowpack declined slightly this month, according to the U.S. Army Corps of Engineers. As of January 31st, Snow Water Equivalent (SWE) above Fort Peck Reservoir was 78 percent of average, while the reach between Fort Peck and Garrison Reservoirs was 79 percent of average. At the beginning of February, snowpack across Colorado and Wyoming was also behind, at 78 percent of median for each state. Only two basins in each state had snowpack that was near median. At the end of January, Plains snowpack was fairly limited with the highest SWE confined to areas of northern Kansas, eastern Nebraska, and eastern portions of the Dakotas. Aside from the Black Hills, western portions of the Dakotas, western Nebraska, much of Kansas, and the Plains of Colorado and Wyoming were largely snow-free.
- There were several changes in drought conditions this month in the High Plains region, which is unusual for this time of the year. According to the U.S. Drought Monitor, the area experiencing drought (D1-D4) increased from approximately 82 percent to 86 percent since the end of last month. However, the area experiencing abnormal dryness and drought (D0-D4) decreased from 96 percent to 93 percent. With precipitation deficits mounting, a continuation of relatively warm, dry conditions led to the expansion of drought in several areas of the region this month. The largest changes occurred across the Northern Plains, where North Dakota had a 7 percent increase in drought coverage, while South Dakota had a 28 percent increase. Although there was an overall degradation, there was a notable improvement in North Dakota as the area of extreme drought (D3) that was introduced in the east-central part of the state in December was removed after a reassessment of the data. In other areas of the region, Wyoming had an overall increase in drought of 2 percent, with the most notable change occurring in the northeastern part of the state due to precipitation deficits, low snowpack, and poor soil moisture conditions. Meanwhile, drought decreased in Nebraska and Kansas by 5 percent and 10 percent, respectively, due to ample rain and snow in eastern areas of both states. The entire state of Colorado remained in drought, although there were slight improvements in some mountainous areas, as well as the southeastern part of the state.
- For more information, please visit the High Plains Regional Climate Center Home Page.
Southern Region (Information provided by the Southern Regional Climate Center)
- Temperatures for the month of January varied spatially across the Southern Region, with cooler than normal temperatures in the west and warmer than normal temperatures in the north and east. Parts of northwestern and western Texas as well as southern Louisiana experienced temperatures 0 to 2 degrees F (0.00 to 1.11 degrees C) below normal. Conversely, parts of northern, eastern, central, and southern Texas; western and southern Oklahoma; northern, western, central, and southern Arkansas; northern, central, southwestern, and southeastern Louisiana; southern and central Mississippi; and eastern Tennessee experienced temperatures 0 to 2 degrees F (0.00 to 1.11 degrees C) above normal, while parts of northern and eastern Oklahoma; northeastern, western, and southeastern Louisiana; northwestern and eastern Arkansas; northern and southern Mississippi; western, central, and eastern Tennessee; and eastern and southern Texas experienced temperatures 2 to 4 degrees F (1.11 to 2.22 degrees C) above normal. The statewide monthly average temperatures were as follows: Arkansas – 41.40 degrees F (5.22 degrees C), Louisiana – 50.50 degrees F (10.28 degrees C), Mississippi – 47.00 degrees F (8.33 degrees C), Oklahoma – 39.70 degrees F (4.28 degrees C), Tennessee – 39.70 degrees F (4.28 degrees C), and Texas – 47.30 degrees F (8.50 degrees C). The statewide temperature rankings for January were as follows: Arkansas (thirty-eighth warmest), Louisiana (fiftieth warmest), Mississippi (forty-fifth warmest), Oklahoma (thirty-second warmest), Tennessee (thirty-eighth warmest), and Texas (forty-third warmest). The region as a whole experienced its thirty-eighth warmest January on record. All state rankings are based on the period spanning 1895-2021.
- Precipitation values for the month of January varied spatially across the Southern Region. Parts of southern Mississippi, southern Louisiana, and western and southeastern Texas received 50 percent or less of normal precipitation, while parts of southeastern and western Texas as well as southern Mississippi received 25 percent or less of normal precipitation. In contrast, parts of southwestern and northwestern Arkansas, northern, central, and western Oklahoma, and eastern, central, and northern Texas received 150 percent or more of normal precipitation, while parts of northeastern, western, and southeastern Oklahoma as well as central and eastern Texas received precipitation 200 percent or more of normal. The statewide precipitation totals for the month were as follows: Arkansas – 3.97 inches (100.84 mm), Louisiana – 3.43 inches (87.12 mm), Mississippi – 3.52 inches (89.41 mm), Oklahoma – 2.15 inches (54.61 mm), Tennessee – 3.10 inches (78.74 mm), and Texas – 1.56 inches (39.62 mm). The statewide precipitation rankings for January were as follows: Arkansas (fifty-fifth wettest), Louisiana (thirty-second driest), Mississippi (twenty-seventh driest), Oklahoma (twenty-sixth wettest), Tennessee (thirty-second driest), and Texas (fifty-fourth wettest). The region as a whole experienced its forty-fifth driest January on record. All state rankings are based on the period spanning 1895-2021.
- Drought and Severe Weather:
- At the end of January, drought conditions improved and deteriorated across the Southern Region. Exceptional drought conditions persisted across western and northwestern Texas, but the total area experiencing exceptional drought conditions was reduced in scale, with some areas eliminated. Extreme drought conditions persisted across parts of western, northwestern, and southern Texas as well as southwestern Oklahoma, with a slight increase in southern Texas. However, parts of central and western Texas as well as southwestern Oklahoma improved, with central Texas experiencing a substantial reduction while extreme drought conditions in far western Oklahoma were eliminated. Severe drought classifications developed in northwestern Mississippi, but the total area experiencing severe drought classifications decreased as conditions improved across northern, southern and central Texas as well as southwestern Oklahoma. Moderate drought classifications expanded or developed across southern Louisiana, while moderate drought conditions persisted across parts of Tennessee, Mississippi, Oklahoma, and Texas. However, moderate drought conditions were reduced or eliminated across parts of southern Oklahoma, southwestern Arkansas, southwestern Tennessee, and eastern, central, and southern Texas. There was a decrease in the overall area experiencing abnormally dry conditions, with conditions improving across southeastern Oklahoma, north-central Texas, northwestern Louisiana, northern Mississippi, and most of Arkansas. However, abnormally dry conditions increased across eastern Tennessee, northeastern and southeastern Louisiana, and eastern Mississippi.
- In January, there were approximately 41 storm reports across Arkansas, Louisiana, Mississippi, Oklahoma, Tennessee, and Texas. There were 5 tornado reports, 17 hail reports, and 19 wind reports. Oklahoma tallied the most tornado reports (2) while Texas tallied the most hail (8) and wind (7) reports. Texas tallied the most reports (16) while Arkansas tallied the fewest (1). Arkansas and Mississippi did not report a tornado, while Arkansas and Louisiana did not report hail. All 41 reports occurred on four days.
- On January 6, 2021, two tornadoes were reported, one near Texas City, Texas and the other near Henderson, Louisiana. The tornado near Henderson, Louisiana was reported to be an EF-1 tornado with winds of 110 mph (177.03 kph). This tornado destroyed a mobile home and downed several trees, while the tornado near Texas City, Texas damaged businesses and an apartment complex. No injuries were reported. Additionally, there were reports of damage to homes near Breaux Bridge, Louisiana due to strong winds, while a trailer was flipped by strong winds near Vinton, Louisiana.
- On January 24, 2021, a wind gust of 60 mph (96.56 kph) was reported near Seymour, Texas. Additionally, there was a report near Seymour, Texas indicating damage due to strong winds, with a barn destroyed, a semi blown over, and power poles snapped.
- On January 25, 2021, there were 18 severe weather reports across Arkansas, Mississippi, Oklahoma, Tennessee, and Texas. A brief EF-0 tornado was reported near Collierville, Tennessee. Additionally, lime-sized hail was reported near Germantown, Tennessee. Unfortunately, one fatality was reported near Thomastown, Mississippi after strong winds caused a tree to fall on a car, while two injuries were reported nearby from a separate incident involving a vehicle hitting a downed tree.
- On January 31, 2021, a tornado was reported near Wann, Oklahoma, while another tornado was reported near Lenapah, Oklahoma. No injuries were reported.
- For more information, please visit the Southern Regional Climate Center Home Page.
Western Region (Information provided by the Western Region Climate Center)
- After a dry first half of the month across much of the region, a series of Pacific storm systems in late January delivered significant precipitation accumulations to areas of the West experiencing drought including portions of California, Nevada, and the Four Corners states. Along the central California coast, significant rainfall accumulations (7 to 20+ inches) were observed. Numerous mountain ranges received heavy snowfall including the Klamath Mountains, Sierra Nevada, San Francisco Peaks, White Mountains, San Juan Mountains, and the ranges/plateaus of southern Utah. In the Pacific Northwest, precipitation for the month was above normal (~100–200+% of normal) across the coastal ranges of western Oregon, west-central Idaho, as well as western and northern portions of Washington state. In the Intermountain West, recent storms improved mountain snowpack conditions, but basin-level snow water equivalent (SWE) continued to lag behind normal levels across most of the region with the Four Corners states continuing to experience substantial longer-term (6 to 36 months) precipitation deficits. By the end of January, 80% of the West was experiencing drought (21% in D4–Exceptional Drought) according to the U.S. Drought Monitor—with the most severe drought centered on the Four Corners states and Nevada. In statewide reservoir conditions (Jan 1), below-average storage levels were observed in California, Colorado, Idaho, Nevada, New Mexico, and Oregon.
- In California, back-to-back storm systems in late January provided a marked increase to the Sierra Nevada snowpack. Overall, the storms boosted the statewide snowpack from 53% of normal (Jan 1) to 69% of normal (Jan 31) with the regional breakdown as follows: North–65%, Central–74%, and South–59%. Along the central California coast in the Santa Lucia Range, torrential rains caused localized flash flooding and a debris flow that collapsed a portion of California’s Hwy 1 (south of Big Sur) into the Pacific Ocean. In San Simeon, the observing station at Hearst Castle recorded 12.79 in (325 mm; 233% of normal) for January including a daily record-breaking rainfall accumulation of 6.33 in (161 mm) on Jan 27. Statewide, average temperatures were near normal to above normal for the month—including Santa Barbara with single-day record highs of 82° F (27.8° C) on Jan 16–18. As of Jan 31, the state’s two largest reservoirs, Shasta and Oroville, were at 69% and 54% of historical averages, respectively.
- In the Pacific Northwest, precipitation was near normal to above normal across western Oregon and Washington as well as in northeastern Washington. In the eastern Cascades of Washington, the town of Chelan observed 2.84 in (72 mm; 182% of normal) of precipitation (liquid) for January—including 18.3 in (465 mm; 251% of normal) of snow. As of Jan 31, basin-wide (6-Digit HUC) SWE-levels ranged from 66% (Klamath Basin) of median to 108% (Upper Columbia) of median with the Pacific Northwest region (2-Digit HUC) at 86% of median. For the month, average temperatures were above normal across most of the region with the largest departures observed on the Columbia Plateau (Washington), Snake River Plain (Idaho), and across much of Montana including the eastern plains town of Glasgow that observed an average temperature of 27.3° F (-2.6° C), a +13.5° F (+7.5° C) departure from normal.
- In the Southwest, drought-related conditions (snow drought, low soil moisture, stressed vegetation) in Arizona saw some modest improvement as beneficial rains and snow fell across the Sonoran Desert while moderate-to-heavy snowfall accumulations were observed in areas along the Mogollon Rim and Colorado Plateau including Flagstaff that observed a monthly snowfall total of 43.5 in (1105 mm; 11th snowiest January) and Prescott 18.1 in (460 mm; 10th snowiest January). The storms significantly boosted SWE levels (Jan 31) in the Little Colorado and Verde River basins to 80% of median (18% on Jan 1) and 124% of median (13% on Jan 1), respectively. Likewise, mountain snowpack conditions improved in other basins (Salt, Upper Gila, Mimbres, Upper Pecos) in the region, but substantial WYTD deficits remained.
- In Alaska, above-normal temperatures prevailed across the state with the greatest positive anomalies observed in the Interior where Eagle recorded its 4th warmest (+14° F departure) January on record. Precipitation for the month was below normal in the Interior and northern portions while areas of the Panhandle, Southwest, and coastal mountains of Southcentral observed above-normal precipitation. In the Interior, Fairbanks observed only 0.5 in (12.7 mm) of snow—breaking the record (dating back to 1966) for the lowest January snowfall total. In the Panhandle, Ketchikan logged its 4th wettest Nov to Jan period with 77.64 in (1972 mm).
- In the Hawaiian Islands, drought conditions improved on Lanai, Maui, Molokai, and Oahu— according to the U.S. Drought Monitor. For January, select rainfall totals were as follows: Hilo Intl AP 17.47 in (444 mm; 189% of normal), Honolulu Intl AP 3.23 in (82 mm; 140% of normal), Kahului AP 3.72 in (94 mm; 130% of normal), Lihue AP 1.68 in (43 mm; 45% of normal), and Molokai AP 1.16 in (29 mm; 29% of normal).
Significant Events for January 2021- Heavy snowfall accumulations in the Sierra Nevada (Jan 25–29): Multiple storms dumped 4 to 6+ feet of snow to the Greater Lake Tahoe region leading to extreme avalanche danger, vehicular accidents, and road closures along Interstate 80 and U.S. Highway 395 (Eastern Sierra Nevada). In the southern Sierra, Mammoth Mountain recorded more than 9 feet of snow.
- Heavy rains and snowfall on Hawaii Island (Jan 24–27): The summits of Mauna Kea (13,803 ft; 4,207 m) and Mauna Loa (13,679 ft; 4169 m) observed 6+ inches of snow while heavy rains soaked the lower elevations of the windward slopes with the Glenwood 54.2 station recording a daily record rainfall of 7.56 in (192 mm) on Jan 24 and 16.52 in (420 mm) from Jan 24 to 27.
- For more information, please go to the Western Regional Climate Center Home Page.