National Overview

September Highlights


September Temperature
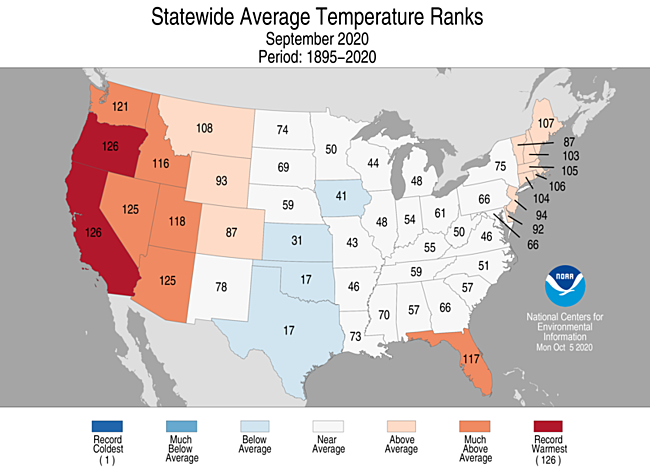
- For September, the average contiguous U.S. temperature was 66.0°F, 1.1°F above the 20th century average, ranking in the warmest one-third of the 126-year record.
- The cooler temperatures observed across the Plains and Upper Mississippi Valley mid-month were associated with a strong trough of low pressure.
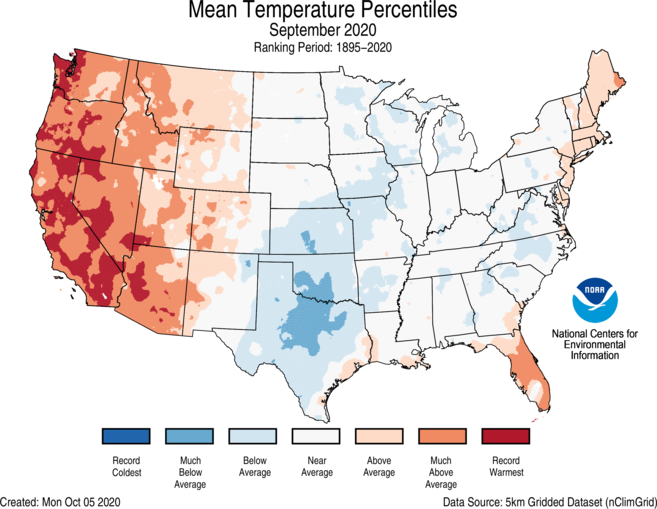
- Above- to much-above-average September temperatures were observed across much of the West, parts of the Northeast and Gulf Coast. California and Oregon ranked warmest on record for the month with Nevada and Arizona ranking second warmest.
- Phoenix, Arizona, broke the record for the number of days with temperatures at or above 110°F in a calendar year during August and added three more days to the record in September. The 2020 record of 53 days shatters the previous record of 33, set in 2011.
- Below-average temperatures were present across portions of the Plains and Deep South and in pockets scattered across the Great Lakes, Southeast and mid-Atlantic.
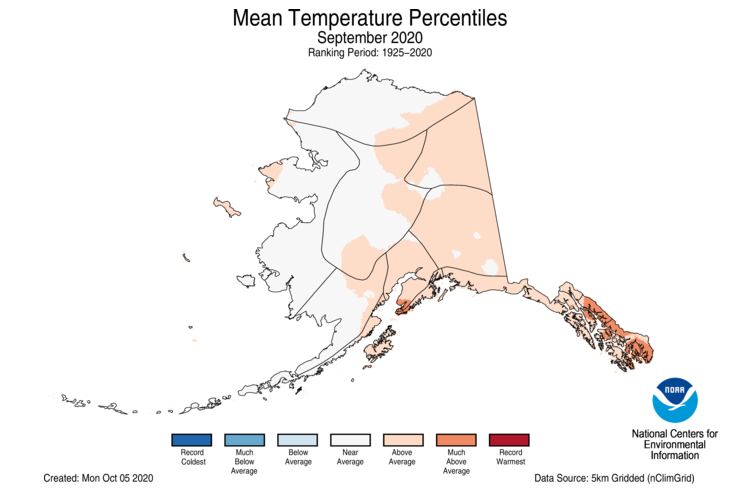
- Alaska had a statewide average temperature of 42.0°F, 1.4°F above the long-term average, ranking in the warmest one-third of the 96-year record. Above-average temperatures were observed across the eastern half of Alaska including most of the Northeast and Southeast Interior regions, Cook Inlet, Northeast Gulf and the Panhandle regions.
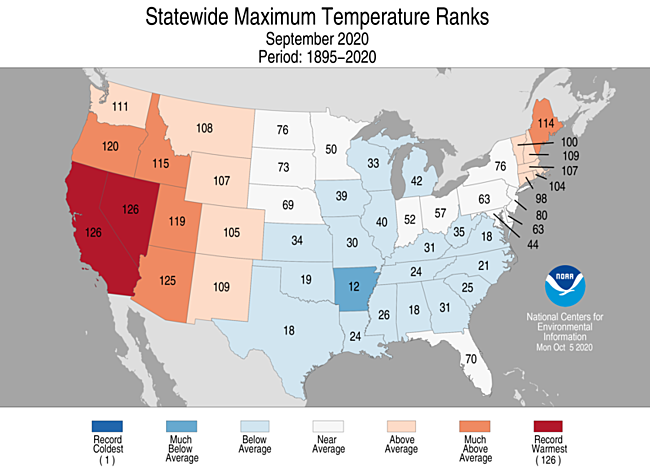
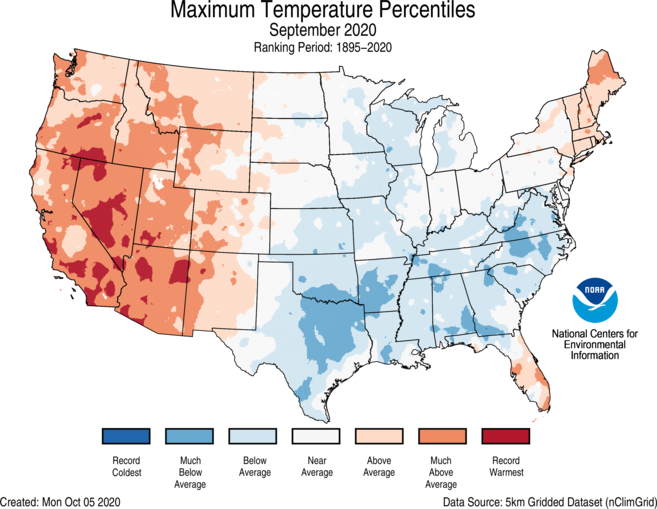
- The nationally averaged maximum temperature (daytime highs) was warmer than average during September at 78.9°F, 1.1°F above average, ranking in the warmest one-third of the 126-year record. California and Nevada ranked record warmest for maximum temperatures in September, while the remainder of the West, much of the Northeast and southern Florida experienced above-average daytime high temperatures for the month. Eighteen states from the Gulf Coast to the Great Lakes and across the Southeast had below-average daytime high temperatures with Arkansas ranking 12th coldest on record.
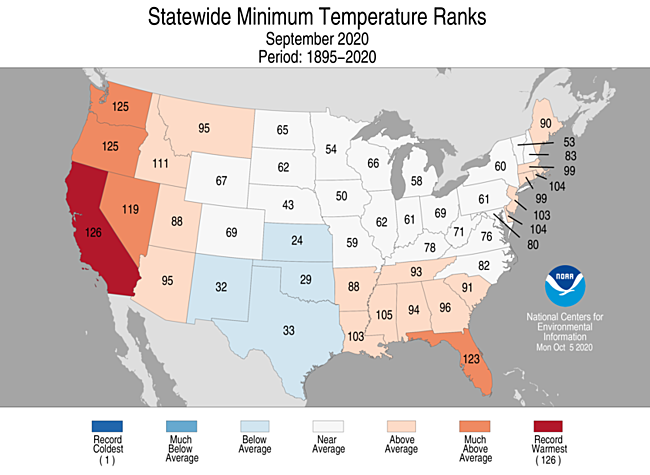
- The nationally averaged minimum temperature (overnight lows) during September was 53.0°F, 1.1°F above average, also ranking in the warmest one-third of the 126-year record. California ranked warmest on record with much of the West, Gulf Coast states and parts of the Southeast and Northeast experiencing above-average overnight low temperatures during September. Four states in the southcentral U.S. ranked below average for the month.
- As of October 9, there were 5,260 daily cold high (2,894) and low (2,366) temperature records tied or broken during September. This was approximately 80 percent of the 6,608 warm daily high (3,171) and low (3,437) temperature records set during the month.
- Based on NOAA's Residential Energy Demand Temperature Index (REDTI), the contiguous U.S. temperature-related energy demand during September was 112 percent above average and ranked in the middle one-third of the 126-year period of record.
September Precipitation
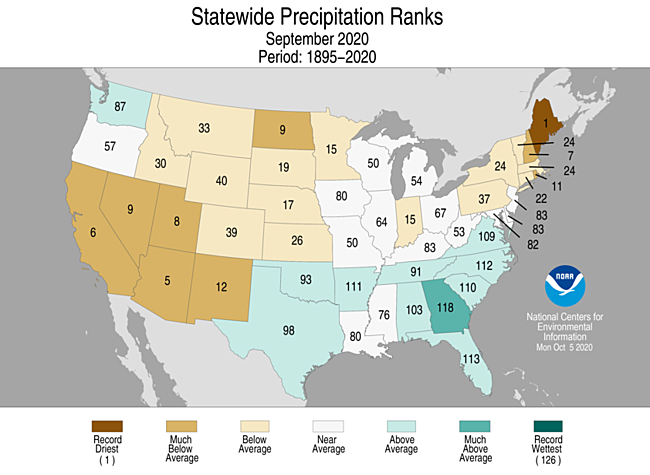
- The September precipitation total for the contiguous U.S. was 2.38 inches, 0.11 inch below average, ranking in the middle one-third of the 126-year period of record.
- The West remained hot and dry under a relatively persistent ridge of high pressure throughout much of September, exacerbating wildfire conditions throughout the region.
- Above-average precipitation was observed from parts of the Deep South to the mid-Atlantic and across portions of the Northwest and Midwest. The rainfall observed across the South and Southeast was in large part due to Tropicl Storm Beta and Hurricane Sally. Georgia had its ninth-wettest September on record.
- Below-average precipitation was observed from the West Coast to the northern Great Lakes and across the Northeast, as well as across portions of the central Gulf Coast and western Ohio Valley. Maine had its record-driest September, while Arizona ranked fifth driest and California sixth driest on record. In total, seven states in the Northeast, Southwest and northern Plains had their tenth driest, or drier, September.
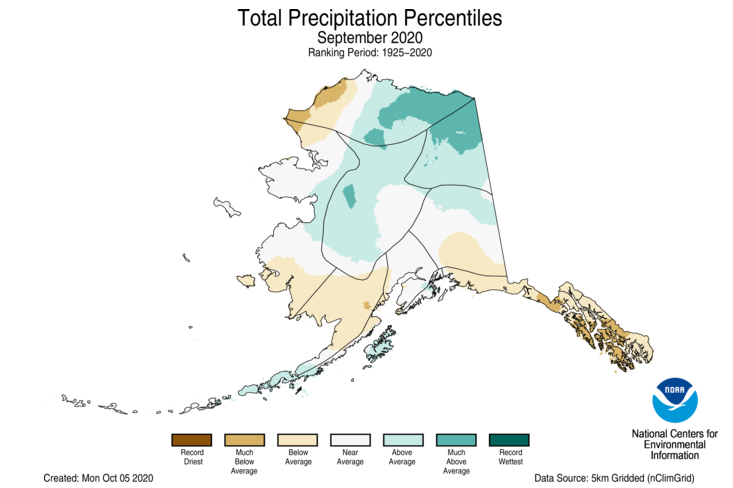
- Alaska’s average of 3.93 inches of precipitation in September was 0.64 inch below average and ranked in the driest one-third of the 96-year record. The Northeast Interior, the eastern half of the North Slope as well as much of the Central Interior received above-average precipitation during September, while below-average precipitation was present across the western North Slope, Bristol Bay, the Northeast Gulf and the Panhandle regions.
- No snow was reported at Fairbanks during September. This is the third consecutive year with no September snowfall — a first in the Weather Bureau/NWS era (since 1930).
- According to the September 29 U.S. Drought Monitor 42.6 percent of the contiguous U.S. was in drought, up about 3 percentage points from the beginning of September. This is the largest drought footprint across the CONUS since September 2013. Drought conditions expanded or intensified across much of the Northeast and the western half of the contiguous U.S. Drought coverage lessened or was eliminated across parts of the mid-Mississippi Valley and Deep South. Drought was eliminated across Kodiak Island in Alaska, contracted across Hawaii’s Big Island and intensified on the other Hawaiian islands.
Wildfires
- The western U.S. is in the midst of its most active fire year on record in 2020.
- By the end of September, more than five million acres were consumed across California, Oregon and Washington State. This is more than three times the annual 10-year (2010-2019) average of nearly 1.6 million acres.
- California has already had the highest number of acres burned in a single year across the state with many active fires still ablaze at the beginning of October.
- Five of the six largest fires in California history occurred during 2020 — August Complex, SCU Lightning Complex, LNU Lightning Complex, North Complex and the Creek Fire.
- As of October 1, the Cameron Peak Fire in Colorado is the third-largest fire in the state’s history. Three of the four largest fires in Colorado history occurred during 2020.
- Thick smoke and ash from the wildfires reduced air quality in the West and southwest Canada to dangerous levels, forcing people to stay indoors during much of September. See the WRCC Report for additional wildfire details.
Tropical Cyclones and Hurricanes
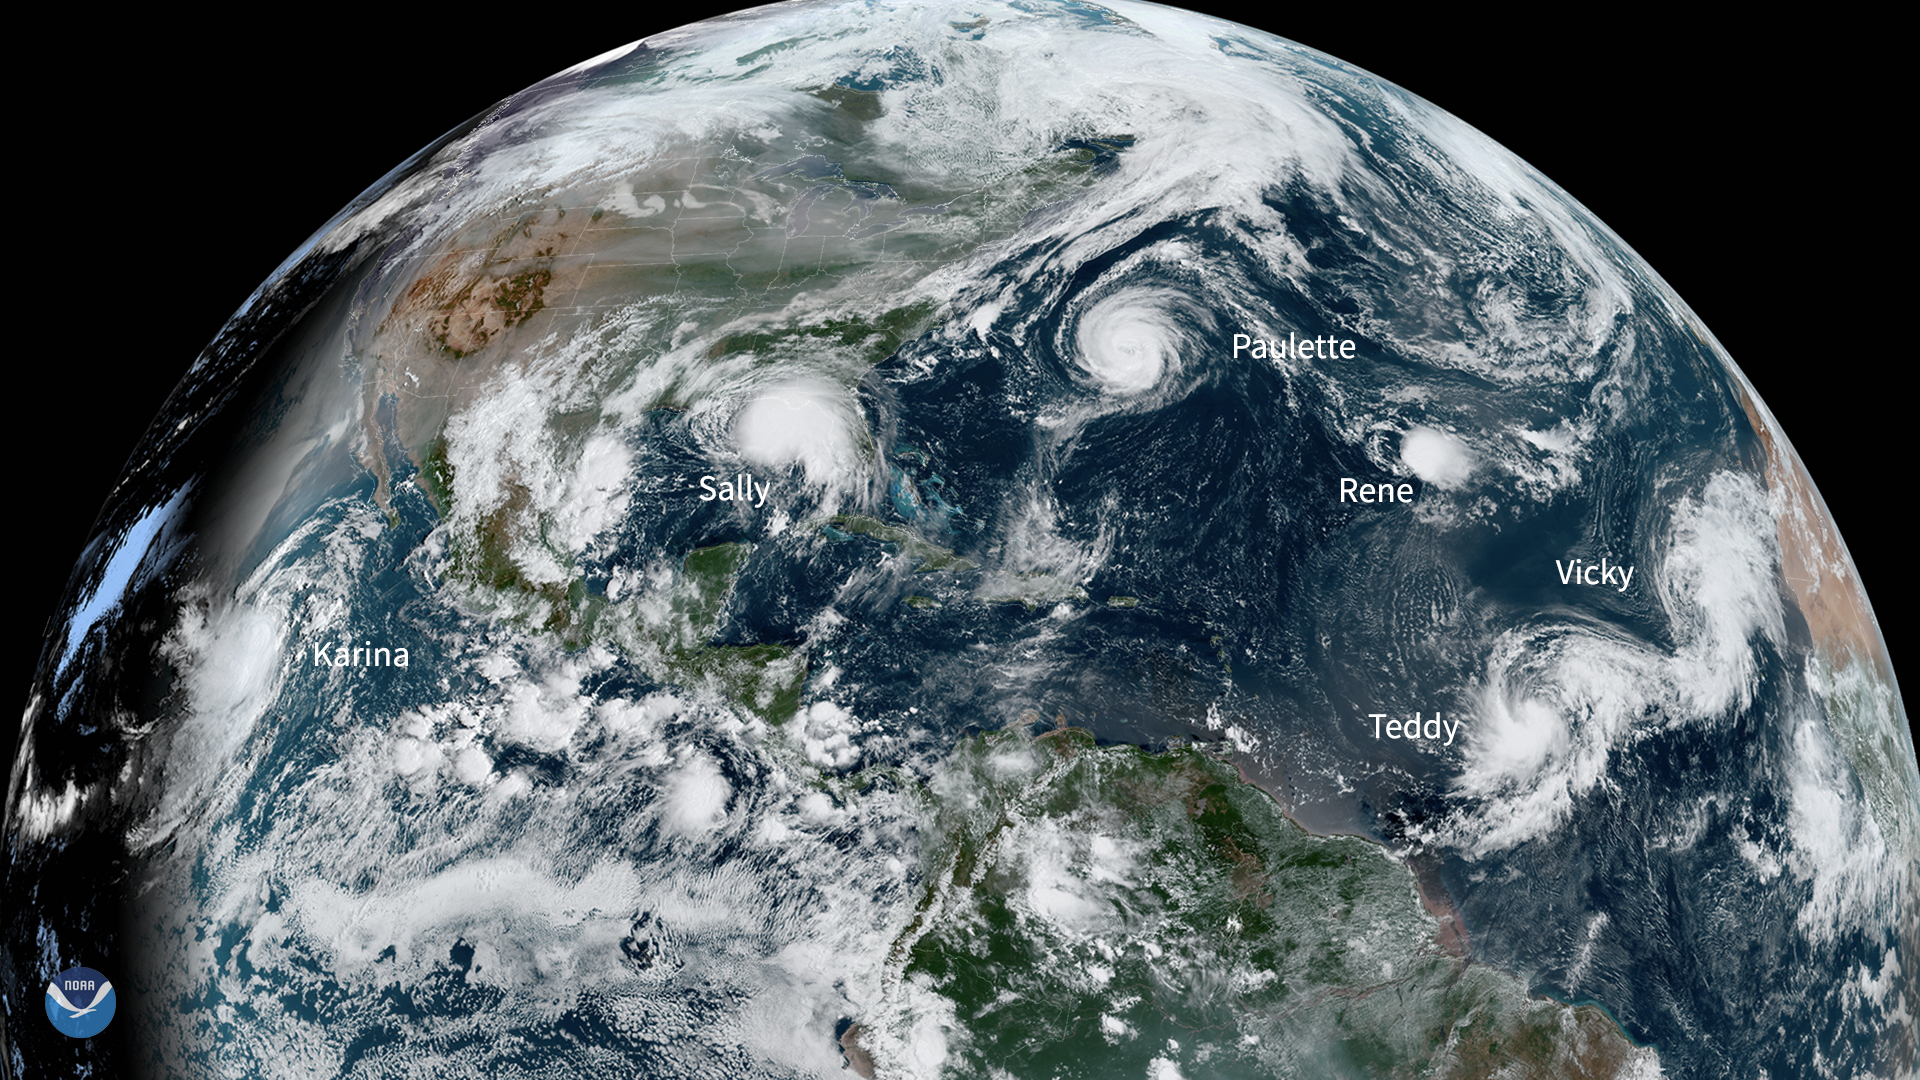
- The Atlantic Basin hurricane season continues at a record pace for named-storm formation during 2020. In September alone, 10 named storms formed — Nana, Omar, Paulette, Rene, Sally, Teddy, Vicky, Wilfred, Alpha and Beta. This broke the September record of eight named storms, which occured in 2002, 2007 and 2010.
- On September 15, Hurricane Sally made landfall near Gulf Shores, Alabama, as a Category 2 storm. Impacts included storm surge flooding, widespread wind damage and up to 30 inches of rainfall.
- Tropical Storm Beta made landfall on the Matagorda Peninsula in Texas on September 22 and brought extensive flooding to the Houston area.
- For the first time since 1971, five named storms churned in the Atlantic Basin at one time. Paulette, Rene, Sally, Teddy and Vicky were each visible in the Atlantic Ocean on September 14.
- Through October 1, nine named storms made landfall along the CONUS coastline, tying a record (1916) for most landfalls in a single season.
- Additional information on tropical cyclones and hurricanes can be found on the Hurricanes and Tropical Cyclones page.
Billion-Dollar Weather and Climate Disasters
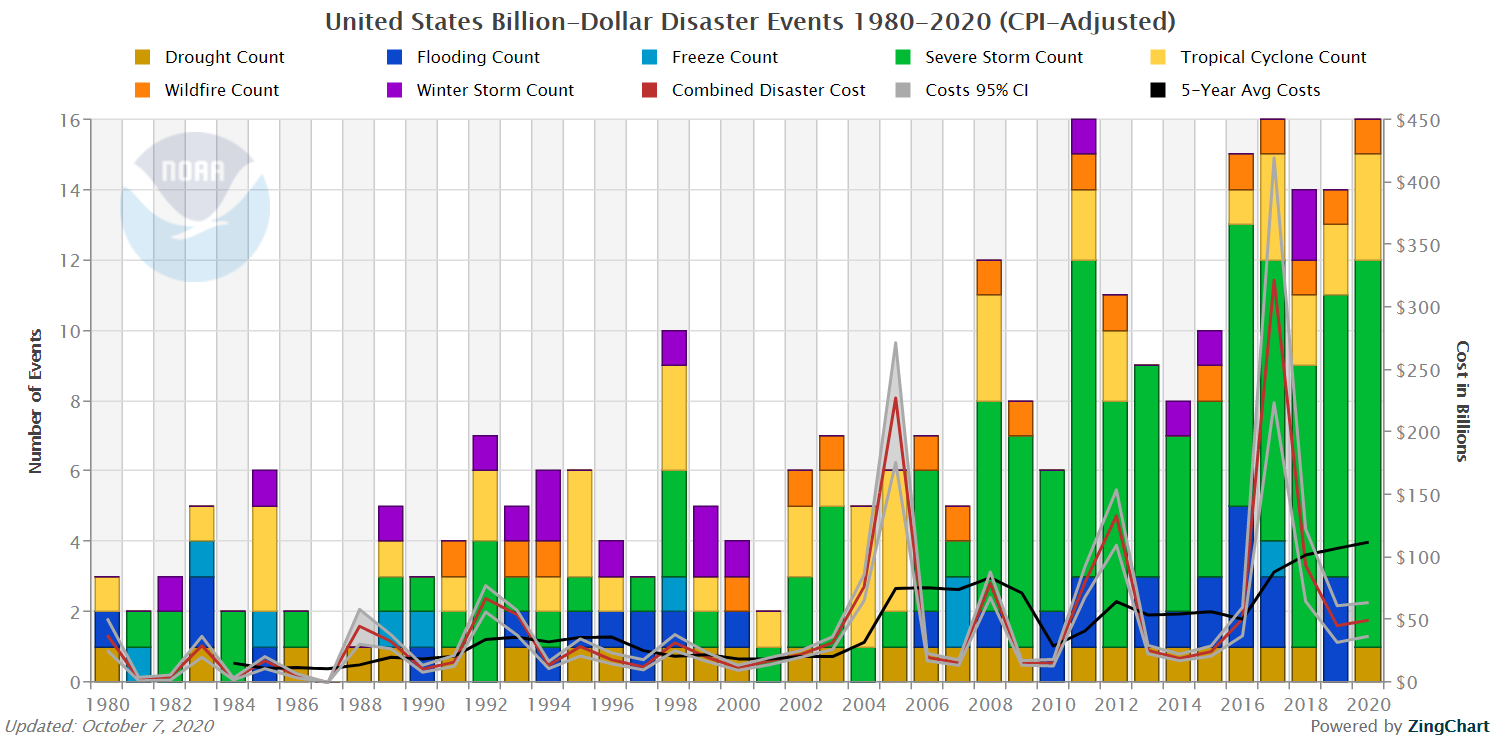
- NCEI updated the 2020 billion-dollar weather and climate disaster list to include six additional events — Western Wildfires, Western/Central Drought and Heatwave, Hurricane Sally, Hurricane Laura, Central Severe Weather Derecho and Hurricane Isaias.
- This brings the year-to-date total to 16 weather and climate disaster events with losses exceeding $1 billion each across the U.S. and ties with 2011 and 2017 for the largest number of disasters in a calendar year.
- Eleven of the events were due to severe storms which occurred across more than 30 states from the Great Lakes to the Gulf and East coasts. The remaining events were identified as one wildfire, one drought and three tropical cyclone events.
- This is also the sixth consecutive year (2015-2020) in which 10 or more billion-dollar disasters have impacted the U.S. — the only such occurrence on record.
- Since records began in 1980, the U.S. has sustained 279 separate weather and climate disasters where overall damages/costs reached or exceeded $1 billion (based on the CPI adjustment to 2020) per event. The total cost of these 279 events exceeds $1.825 trillion.
- Disaster costs over the last five years (2016-2020) exceed a record $550 billion. These costs do not yet include the 2020 Western Wildfires, Drought/Heatwave or Hurricane Sally.
- The U.S. has been impacted by slow moving tropical cyclones that produced extreme rainfall and damaging floods for four consecutive years (2017-2020). These storms include: Harvey, Florence, Imelda and Sally.
Year-to-Date Highlights


January-September Temperature
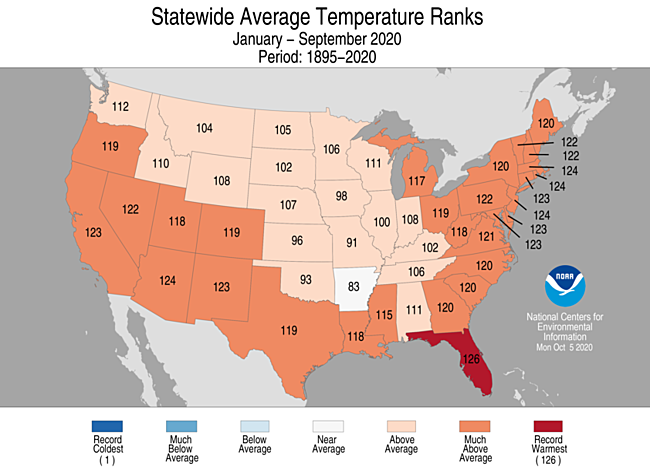
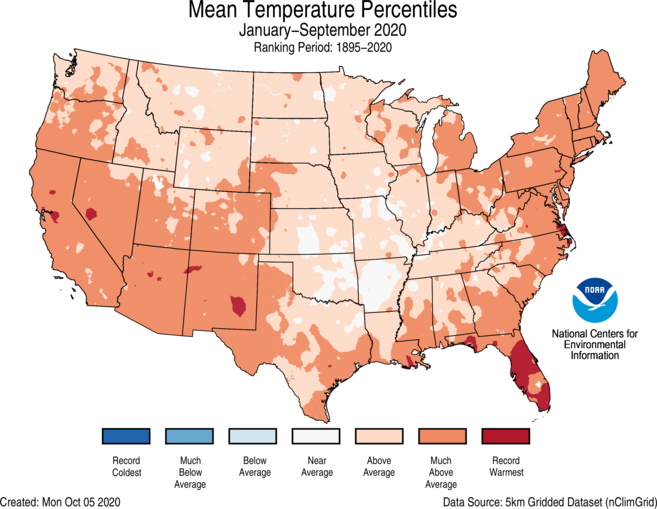
- For the year-to-date, the contiguous U.S. temperature was 57.3°F, 2.3°F above the 20th century average, ranking sixth warmest in the January–September record.
- Above- to much-above-average year-to-date temperatureas were observed across most of the contiguous U.S. Florida had its warmest January-September on record while Arizona, New Jersey, Rhode Island and Massachusetts ranked third warmest. Near-average temperatures were observed across portions of the central U.S.
- Denver, Colorado, reported 75 days with high temperatures at or above 90°F in 2020. This eclipses the previous record of 73 days set in 2012.
- Despite the overall warmth across the contiguous U.S. in 2020, the northern Plains experienced an early freeze September 8-9, which caused an abrupt end to the growing season, leading to agricultural losses across the region.
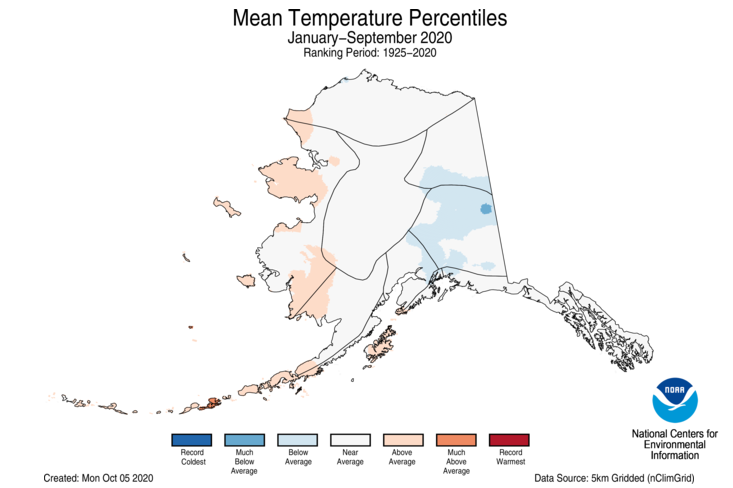
- Year-to-date temperatures averaged across Alaska were near average with above-average temperatures observed along portions of the West Coast and the Aleutians. Below-average temperatures for this year-to-date period were observed across parts of the eastern interior regions.
- The contiguous U.S. average maximum (daytime) temperature during January-September was 69.3°F, 2.0°F above the 20th century average, ranking seventh warmest in the 126-year record. Above-average maximum temperatures were observed across much of the CONUS with Arizona and Florida ranking third warmest on record. Below-average maximum temperatures were observed across portions of the lower-Mississippi River Valley.
- The contiguous U.S. January-September minimum (nighttime) temperature was 45.3°F, 2.5°F above average, and ranked fifth warmest on record. Above-average minimum temperatures were observed across most of the CONUS. Minimum temperatures averaged across Mississippi, Florida, South Carolina, North Carolina and Virginia were record warmest for this year-to-date period. No state ranked near or below average.
- Based on REDTI, the contiguous U.S. temperature-related energy demand during January-September was 52 percent of average and ranked in the lowest one-third third of the 126-year period of record.
January-September Precipitation

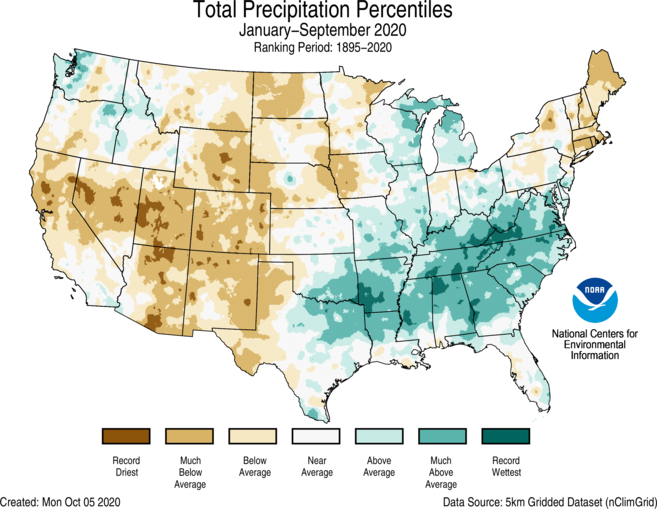
- For the year-to-date, the national precipitation total was 24.08 inches, 0.88 inch above average, ranking in the middle one-third of the January-September record.
- Above- to much-above-average January-September precipitation stretched from parts of the southern Plains to Gulf Coast and Great Lakes to the mid-Atlantic Coast as well as across portions of the Northwest. Mississippi, Tennessee, North Carolina and Virginia ranked third-wettest year-to-date on record. Below-average precipitation fell from the West Coast to the northern Plains and across the Northeast. Utah had its driest year-to-date on record, while Colorado was second driest.
- For Alaska, January-September precipitation was near average. Below-average precipitation was observed across portions of the northwest coast, the Aleutians and the central Gulf Coast. Above-average precipitation was observed across much of the eastern Interior regions and the Panhandle regions.
Extremes
- The USCEI for the year-to-date was 64 percent above average and ranked 10th highest in the 111-year period of record. Extremes in warm maximum and minimum temperatures as well as wet PDSI contributed to this elevated value.
- On the regional scale, the Northeast ranked fifth highest and the Southeast ranked highest on record. Elevated extremes observed across the Northeast were due to widespread warm maximum and minimum temperatures, wet PDSI and the number of days with precipitation. For the Southeast, the record high CEI value could be attributed to widespread warm maximum and minimum temperatures, wet PDSI, 1-day precipitation and the number of days with precipitation.
Regional Highlights
These regional summaries were provided by the six Regional Climate Centers and reflect conditions in their respective regions. These six regions differ spatially from the nine climatic regions of the National Centers for Environmental Information.
Northeast Region (Information provided by the Northeast Regional Climate Center)
- For September, the Northeast averaged out to be 61.2 degrees F (16.2 degrees C), 0.5 degrees F (0.3 degrees C) warmer than normal. State departures ranged from 0.1 degrees F (0.1 degrees C) below normal in West Virginia to 1.5 degrees F (0.8 degrees C) above normal in Rhode Island. Overall, eleven of the twelve Northeast states were warmer than normal, with Maine having its 20th warmest September on record.
- The Northeast had its 18th driest September on record with 2.32 inches (58.93 mm) of precipitation, 59 percent of normal. Maine had its driest September on record, while New Hampshire had its seventh driest and Rhode Island had its 11th driest. Ten of the 12 Northeast states were drier than normal, with precipitation ranging from 23 percent of normal in Maine to 103 percent of normal in New Jersey.
- The U.S. Drought Monitor released on September 3 showed 28 percent of the Northeast in a severe or moderate drought and 26 percent as abnormally dry. These areas included much of New England and parts of New York and Pennsylvania. Conditions worsened during September, with moderate and severe drought expanding in the region and the introduction of extreme drought in New England for the first time since February 2017. In fact, at month’s end, all of Rhode Island was in an extreme drought for the first time in the U.S. Drought Monitor’s history (since 2000). The U.S. Drought Monitor released on October 1 showed 45 percent of the Northeast in an extreme, severe, or moderate drought and 25 percent as abnormally dry. There were numerous impacts from the drought and abnormally dry conditions. During September, streamflow and groundwater levels were much below normal in many of the drought areas, with some sites setting daily record low streamflows. In fact, the Aroostook River at Masardis and Washburn, Maine, dropped to an all-time record-low flow. In New Hampshire, officials were performing dam releases in the Lamprey River watershed to help stressed aquatic species. To protect fish populations in the Salmon River and its tributaries, which were experiencing low water levels due to drought conditions, New York State officials closed a section of the river to fishing and delayed a scheduled baseflow increase. Low streamflow and warm temperatures in the Farmington River in Connecticut caused officials to delay restocking trout and salmon. Water restrictions were enacted or remained in place for numerous locations in Massachusetts and several locations in Connecticut, Maine, New York, and Pennsylvania. As of September 30, 165 community water systems, seven municipalities, and some private well users in New Hampshire had restrictions in place. In addition, dry wells were reported across New England and in New York. Some well drilling contractors in New Hampshire and Rhode Island had a 6 to 12 week wait. Agriculture continued to suffer across the region. A press release from the Maine Drought Task Force noted crops across the state continued to experience drought stress and there were irrigation issues, particularly in Aroostook County, leading the Maine Department of Environmental Protection to issue an irrigation warning. Aroostook County was declared a primary natural disaster area by the U.S. Department of Agriculture due to drought, which reduced some crop yields by 50 percent. Portions of southern Maine saw forage crop yields reduced by up to 60 percent, with similar conditions in parts of New Hampshire. Farmers in both states, as well as in other states affected by drought, were buying hay to feed livestock this winter. Purchasing hay and irrigating crops increased expenses for farmers. For instance, in New Hampshire, one farmer spent around $14,000 on feed for livestock, while another farmer had $30,000 in irrigation-related costs including equipment and additional workers to perform the tasks. For the week ending September 27, topsoil moisture was rated short or very short for all of Maine and New Hampshire and over 90 percent of Rhode Island. Subsoil moisture was rated short or very short for more than 90 percent of Maine and Rhode Island and more than 80 percent of New Hampshire. For the same period, pasture and rangeland conditions were rated very poor (the lowest level) for 90 percent of Rhode Island and 73 percent of Massachusetts and Connecticut, while 10 percent of Pennsylvania’s corn crop was rated very poor, making it some of the worst corn condition ratings in the country. There have been fewer ticks and mosquitoes, and in turn, fewer insect-related illnesses, this year in New England due to a lack of moisture. Fire risk remained elevated in areas of New England, New York, and Pennsylvania that were experiencing drought and abnormal dryness. Much of New England was seeing an unusually high number of fires or atypical fire behavior. Massachusetts has seen more than 1,000 wildfires this year, with 41 of those occurring during the week ending September 22, which is unusual for September. With 1000 wildfires as of September 24, Maine had its worst year for fires in 20 years. There were at least four ground fires in Vermont this year, which is atypical. Rhode Island officials were seeing unusual fire behavior such as fires climbing trees and were concerned that items like lawn mowers and chains could spark wildfires, which is a typical wildfire behavior in the western U.S. and unusual for the Northeast. The governor of New Hampshire enacted an emergency drought law banning outdoor fires and smoking near public woods. In addition, several New Hampshire communities as well as the White Mountains National Forest enacted burn bans. Across New England, fires have burned deeper and taken longer to extinguish. In addition, drought conditions have dried up or reduced water supplies that some firefighters rely on to fight fires.
- Severe thunderstorms produced an EF-1 tornado, damaging winds, and flash flooding in Maryland on September 3. As much as 5 inches (127 mm) of rain fell in a two-hour period on September 10, leading to flash flooding in Washington, D.C., and surrounding suburbs. There were numerous road closures and several water rescues. A stream gauge near Colesville, Maryland, rose eight feet (2.4 m) in around an hour. Highly-localized flooding was also noted on western Long Island and in northeastern Massachusetts. On the same day, Atlantic City, New Jersey, saw 3.97 inches (100.84 mm) of rain, making it the site’s wettest September day on record. The old record was 3.86 inches (98.04 mm) of precipitation on September 14, 1973. Hurricane Teddy, which passed hundreds of miles off the U.S. East Coast from September 21 to 22, produced large waves, rough surf, and coastal flooding in parts of New Jersey and New England. Winds gusted as high as 47 mph (21 m/s) in eastern Massachusetts. Due to strong winds, dry conditions, and low humidity, Red Flag Warnings were issued for portions of New England on September 22, which is somewhat unusual for this late in the year. Portions of the New England, New York, and Pennsylvania were experiencing their driest or one of their 10 driest Septembers on record until the last two days of the month, September 29 and 30, when a storm system brought some precipitation. The greatest rainfall totals generally ranged from 2 to 4 inches (51 to 102 mm). Winds gusts of up to 72 mph (32 m/s) were reported. The highest gusts were generally in New England, where downed trees and wires led to road and a few school closures. Some roof and siding damage were also noted in parts of Maine. More than 100,000 customers in Maine, more than 65,000 customers in Massachusetts, and more than 20,000 each in Connecticut and Rhode Island lost power.
- For more information, please visit the Northeast Regional Climate Center Home Page.
Midwest Region (Information provided by the Midwest Regional Climate Center)
- September temperatures ranged from near normal to below normal. The average temperature for the region was 62.2 degrees F (16.8 C) which was 0.7 degrees F (0.4 C) below normal. The coolest areas were in the northwestern half of the Midwest with some areas near Lake Superior having temperatures as much as 3.0 degrees F (1.7 C) below normal. The southeastern third of the region had temperatures within a degree F (0.6 C) of normal. A cold spell from the 9th to the 11th brought very cold temperatures to the northwestern areas of the region, with both freezing temperatures and record low maximum temperatures. These days accounted for the vast majority of the nearly 1000 record low daily temperatures in September. The last week of September saw above-normal temperatures and most of the 100 or so record high daily temperatures in September.
- September precipitation in the Midwest ranged from less than 0.50 inches (13 mm) in southern Indiana to more than 6.00 inches (152 mm) in eastern Iowa, northern Illinois, and extreme southwestern Wisconsin. Much of the region had precipitation totals that fell below normal. Total precipitation for the region was 2.86 inches (73 mm) which was 0.58 inches (15 mm) below normal. Significantly dry areas were observed across Minnesota, southern Illinois, and southern Indiana. The totals in southern Indiana were less than 25 percent of normal with a few areas below 10 percent of normal. Meanwhile, the areas that received more than 5 inches (127 mm) had more than 175 percent of normal with many having more than 200 percent of normal. Much of this precipitation fell in the 2nd week of September. The following week was completely free of rain across nearly the entire Midwest. Rains in the last week of the month also fell well short of normal.
- First fall freezes were observed across the Upper Midwest from September 8th to 11th as an extremely cold airmass swept into the region. Some of the coldest temperatures were across northern Minnesota on September 9th, when hard freezes were observed. Extensive areas in northern Wisconsin and Michigan reached freezing for the first time this fall on September 10th and 11th. These freezes were on the eastern edge of a very intense temperature shift across the northern Great Plains and Rockies as maximum temperatures fell more than 50 degrees F (28 C) in just two days in Iowa and Minnesota.
- Drought significantly improved in Iowa and northern Illinois during September. Soaking rainfall from September 8th to 14th aided in eliminating extreme drought from Iowa and led to a 35 percent decrease in Iowa drought coverage as of the September 29th U.S. Drought Monitor. However, drier weather across southern Missouri, southern Illinois and Indiana led to an expansion of drought and abnormally dry conditions in these areas. Overall, drought coverage dropped by five percent in September, while abnormally dry conditions increased by five percent.
- Severe weather was observed on several days in September. A total of 150 reports of strong winds or hail were reported in the month, with three reported tornadoes. Many of these reports occurred on the 5th and 7th as storms impacted Minnesota, Iowa and central Ohio. On September 5th, 2.5-inch (6-cm) diameter hail was reported near Olivia, Minnesota and near Wanda, Minnesota. Strong winds in Iowa included an 83-mph (134-kpm) wind gust near Titonka, Iowa. On September 7th, 2-inch (5-cm) hail was also reported near Nashville, Ohio, while an EF-0 tornado was confirmed near Delaware, Ohio. Isolated severe weather was also reported in northern Wisconsin and the U.P. of Michigan on September 25th and 26th, which included a tornado near Upson, Wisconsin, and 2-inch (5-cm) hail near Morse, Wisconsin.
- For further details on the weather and climate events in the Midwest, see the weekly and monthly reports at the Midwest Climate Watch page.
Southeast Region (Information provided by the Southeast Regional Climate Center)
- Temperatures were near average across much of the Southeast region and Puerto Rico for the month of September. Monthly mean temperatures were within 2 degrees F (1.1 degrees C) of average for over 90 percent of the 210 long-term (i.e., period of record equaling or exceeding 50 years) stations across the region. There were only two stations that tied or observed their warmest September on record, Stuart, FL (1935-2020; 1st warmest) and Plant City, FL (1892-2020; T-1st warmest). Maximum temperatures ranged from 3.6 degrees F (2 degrees C) above normal in Plant City, FL (1892-2020) to 6.4 degrees F (3.6 degrees C) below normal in Oneonta, AL (1894-2020). Daily temperature minimums ranged from 5.9 degrees F (3.3 degrees C) above normal in Marion, NC (1893-2020) to 1.4 degrees F (0.8 degrees C) below normal in Rome, GA (1893-2020). High rates of evaporation and the persistent influx of tropical moisture suppressed nighttime cooling during the month. Indeed, there were a few stations in Florida that saw minimum temperatures above 70 degrees F (21 degrees C) for the entire month including, Key West, FL (1871-2020) and Miami, FL (1895-2020). The warmest weather of the month occurred from the 3rd through the 5th, as the circulation around the Bermuda High, situated off the Atlantic coast, transported warm, humid air over much of the Southeast region. Daily maximum temperatures exceeded 90 degrees F (32 degrees C) across portions of every state, resulting in heat advisories for Charleston, SC (1938-2020), with heat index values between 105 -115 degrees F (41-46 degrees C). In contrast, the coolest weather of the month across the Southeast occurred from the 20th – 22nd, as the circulation around a departing mid-latitude cyclone ushered in relatively cooler and drier air from Canada. Daily minimum temperatures fell below 60 degrees F (16 degrees C) across portions of every state north of Florida, with a few locations in the higher elevations of North Carolina and Virginia falling below 40 degrees F (4.4 degrees C), prompting frost and freeze advisories. Indeed, Mt Mitchell (1925-2020) had a minimum temperature of 29 degrees F (-1.7 degrees C), and Raleigh, NC (1887-2020) experienced its lowest September minimum temperature since 2003 at 44 degrees F (6.7 degrees C).
- Precipitation was variable across the Southeast region during September, with a few wet and dry extremes recorded. The driest locations were found across central Alabama, southern Georgia, and eastern Florida. Monthly precipitation totals ranged from 70 to less than 25 percent of normal across these locations. Tuscaloosa, AL (1948-2020; 9th driest) only received 0.85 inches (22 mm) of precipitation, over 2 inches (51 mm) below normal for the month. In contrast, the wettest locations were located across the Florida Panhandle, northern Georgia, western North Carolina, and southern Virginia. Precipitation totals ranged from 150 to 300 percent of normal. Indeed, Pensacola, FL (1879-2020) received 18.51 inches (470 mm) of precipitation, which was more than 12 inches (305 mm) above average, making this the 3rd wettest September on record. On September 11th Highlands, NC (1877-2020) reached 100 inches (2540 mm) of precipitation for the year, which is the earliest it has ever made it to that value in a given year. Most of Puerto Rico and the US Virgin Islands received normal amounts of precipitation for the month. Hurricane Sally was the seventh hurricane of the Atlantic 2020 season and made landfall near Gulf Shores, AL on September 16th. However, from the 12th through the 16th, Hurricane Sally impacted parts of Florida with numerous reports of localized flooding resulting in several road closures, stalled vehicles, and water entering multiple residences and businesses. Key West, FL (1871-2020) received 9.37 inches (238 mm) of rain from the storm in a single day, making it the 5th wettest day on record. Key West, FL recorded 3.95 inches (100 mm) in a single hour, making this their second highest rain rate ever recorded. Pensacola, FL (1879-2020) received 11.85 inches (301 mm) of rainfall in a single day from the storm, which is their 4th wettest day ever reported, and the 1st wettest September day on record.
- There were 116 reports of severe weather across the Southeast during September, which is 118 percent of the median monthly frequency of 98 reports during 2000-2018. There were 22 confirmed tornadoes reported for the month (16 EF-0, 4 EF-1, 2 EF-unknown), about 157 percent of the monthly average of 14. A total of 19 of these tornadoes were associated with Hurricane Sally. The strongest of these tornadoes was rated EF-1 with winds of 110 mph (49 m/s), and occurred in Ware County, GA on September 16th. This tornado lofted and displaced gravestones along the damage path, as well as damaging a nearby church roof. No injuries or fatalities were reported. Hurricane Sally made landfall near Gulf Shores, AL on September 16th, with peak winds of 105 mph (47 m/s). Fort Morgan, AL reported a wind gust of 121 mph (54 m/s) and Mobile, AL reported a wind gust of 83 mph (37 m/s). At the height of the storm, over 103,000 customers in Baldwin County, AL and over 60,000 in Mobile County, AL were without power. Several sewage overflows were reported across Mobile County following the heavy rain from the storm, causing contamination to Dog River and Rabbit Creek. The Panhandle of Florida was also impacted by Hurricane Sally. In Pensacola, FL over 24 inches (610 mm) of rain fell and storm surge flooding reached 5.6 feet (1.7 m), the third highest storm surge ever recorded in the city. Unfortunately, there were a total of 8 fatalities from Hurricane Sally including a 45-year old female kayaker who had gone missing at the height of the storm. There were 6 reports of hail for the month, with the largest being a little larger than hen-egg sized (2.25 inches) in Wake County, NC on September 25th. There were 89 wind reports for the month, which is 116 percent of the average (77 reports). Damaging straight line winds associated with severe thunderstorms impacted the Washington, DC area on September 3rd. There were reports of several trees and large tree branches downed from these winds leaving many customers without power; however, no injuries or fatalities were reported.
- The entire Southeast region and Puerto Rico remained drought-free for the month of September. At the beginning of the month, small pockets of abnormally dry conditions (D0) were found in Georgia, Alabama, western Florida, and southern Puerto Rico. By the end of the month, however, only small pockets of abnormally dry conditions (D0) in Georgia, Alabama, and southern Puerto Rico remained. Many farmers in the Panhandle reported a loss of cotton due to the heavy rains and wind brought by Hurricane Sally. Boll rot was noted by many farmers in cotton as a result of the hurricane. Peanuts were unable to be dug in the Panhandle due to the rain, and farmers noted that fungal disease and rotting will affect the quality of the harvest. In many fields in southern Alabama, Hurricane Sally blew down the cotton crop when bolls had yet to open. Soybean wind damage was relatively minor and limited to the leaves. Pecan production was substantially impacted for this year’s crop, with many immature pecans blown to the ground. However, orchards remain in good shape overall after the storm. Farmers in southern Georgia also noted an increase in boll rot in cotton as a result of the rain from Hurricane Sally. Livestock and pastures, on the other hand, were in mostly good condition. In South Carolina, portions of vegetable fields remained wet, limiting spraying and field preparations. Overall, however vegetables were growing well.
- For more information, please visit the Southeast Regional Climate Center Home Page.
High Plains Region (Information provided by the High Plains Regional Climate Center)
- The month of September brought a variety of extreme weather to the High Plains region. Record high temperatures occurred in many locations during the first week of the month; however, a large storm system and accompanying cold front brought about a drastic temperature change on the 8th-9th. Temperatures dropped rapidly, falling over 50.0 de¬grees F (27.8 degrees C) in many locations over a 24-hour period. For instance, Denver, CO had a high temperature of 93.0 degrees F (33.9 degrees C) on the 7th, but the high temperature only reached 43.0 degrees F (6.1 degrees C) on the 8th. This storm system also brought snowfall to parts of the region, which was the earliest on record for some locations. Alamosa, Colorado experienced a record daily high, then a record daily low and earliest snowfall on record just two days later. Some parts of the region set daily records for lowest maximum temperature as well.
- Unfortunately, the rest of the month was rather dry, resulting in further development and intensification of drought conditions throughout the High Plains. Pasture conditions continued to worsen across areas of Colorado, Wyoming, Kansas, and Nebraska, which has had a significant impact to livestock. According to the Drought Condition Moni¬toring Observer Reports, many pastures in these states had little to no green grass, which has left livestock with little to eat and is forcing ranchers to use supplemental feed. In western Nebraska, “catastrophic” crop losses were reported, with one agricultural producer reporting that crop production in 2020 was less than 10 percent of what it was in 2019. The continuation of dry conditions also exacerbated wildfires in Colorado and Wyoming. The Cameron Peak Fire, which became Colorado’s third largest wildfire in recorded history, continued to burn across the northern part of the state and was only 42 percent contained by October 1st. In Wyoming, the Mullen Fire quickly grew in size at the end of the month, with more than 151,000 acres burned as of October 5th. The smoke from these fires, combined with smoke from the wildfires along the West Coast, plagued the region with hazy skies and poor air quality throughout the month.
- Temperatures varied across the High Plains in Septem¬ber. Across western and northern portions of the region, temperature departures were generally 1.0-3.0 degrees F (0.6-1.7 degrees C) above normal. Meanwhile, in southern and eastern areas of the High Plains, departures ranged from 1.0-3.0 degrees F (0.6-1.7 degrees C) below normal.
- Extreme temperature swings produced both daily record highs and daily record lows in some areas in September. The month started off warm across the region, with many locations having record high temperatures. For instance, Denver, Colorado hit 101.0 degrees F (38.3 degrees C) on the 5th, which was the latest 100.0 degrees F (37.8 degrees C) day on record (period of record 1872-2020). Interest¬ingly, the previous record was set just last year on Sep¬tember 2nd. Then, during the second week of the month, a strong cold front ushered in much colder temperatures. On the 8th, 9th, and 10th, multiple locations had low temperatures at or below freezing. In fact, several places, such as Rapid City, South Dakota and Williston, North Dakota, had their earliest hard freeze (defined as 28.0 degrees F (-2.2 degrees C)) on record. There were many other locations that had a freeze (32.0 degrees F (0.0 degrees C)) that ranked in the top 10 earliest on record. Some of those locations include: Akron, CO (tied for earliest); Denver, CO (2nd earliest); Pueblo, CO (2nd earliest); Chadron, NE (5th earliest); and Casper, WY (6th earliest). These cold temperatures only added to the issues that farmers have been having this year, as some crops that were already strug¬gling from the dry conditions were also damaged from the freeze, which occurred only weeks away from fall harvest.
- September was a dry month once again for much of the High Plains. The majority of the region had below-nor¬mal precipitation, with only a few isolated areas observing above-normal precipitation. The driest areas of the region, which primarily included portions of the Dakotas and Nebraska, had less than 25 percent of normal precipita¬tion. The persistent dryness, combined with above-normal temperatures, led to increasing and worsening drought conditions for portions of the High Plains. By the end of September, over 60 percent of the High Plains region was experiencing drought. Some locations ranked in the top 10 driest Septembers on record, including Sioux Falls, SD (4th driest); Laramie, WY (6th driest); and Grand Forks, ND (7th driest). Precipitation deficits had also become quite impressive in some locations. For instance, by the end of September, Omaha, Nebraska had a year-to-date precipitation deficit of 12.19 inches (310 mm).
- There were several locations that picked up early-season snowfall toward the beginning of the month. On Septem¬ber 8-9, a large storm system tracked across portions of Wyoming and Colorado and interacted with an unusu¬ally cold air mass. Alamosa, Colorado received 15.3 inches (39 cm) of snowfall from the storm. Not only was this the earliest measurable snowfall on record for Alamosa, but this one storm produced Alamosa’s snowiest Septem¬ber on record. The previous record was 10.0 inches (25 cm) in September 1936 (period of record 1906-2020). Another location that ranked in the top 10 snowiest Septembers on record was Boulder, Colorado, with a to¬tal of 5.7 inches (14 cm). This ranked as the 9th snowi¬est September on record for Boulder. The snowiest was in September 1971, with a total of 21.0 inches (53 cm) (period of record 1893-2020). There were several loca¬tions in Wyoming that ranked in the top 5 earliest snow¬falls on record as well. Some of those locations include: Casper, WY (earliest); Cheyenne, WY (tied for ear¬liest); and Lander, WY (3rd earliest). The wet and heavy nature of the snow, combined with trees that were still fully leafed out, led to some tree damage and power outages in Wyoming and Colorado.
- According to USGS WaterWatch, both above-normal and below-normal streamflows were present across the High Plains in September. Streamflows remained below normal at many locations across Colorado, Wyoming, northern North Dakota, and southwestern Nebraska as persistent dryness continued in these areas. Lake and reservoir levels were also quite low in some areas due to worsening drought conditions, which was impacting agricultural and recre-ational activities. For instance, some irrigation districts in northeastern Colorado and western Nebraska have begun to run out of water. Recent dryness in eastern South Dakota provided some benefit, however. On September 30, the James River near Stratford finally fell below flood stage. The river had been above flood stage for 546 consecutive days at this location. This was an unprecedented event for a river in the Lower 48 in modern times of flood control.
- Drought conditions expanded and intensified in portions of the High Plains through Septem¬ber. According to the U.S. Drought Monitor, the area experiencing drought (D1-D4) in the re¬gion increased by approximately 12.5 percent between August 25th and September 29th.
- A continuation of below-normal precipitation led to wors¬ening conditions throughout much of the High Plains. While precipitation that fell early in the month looked promising, it did little to improve drought conditions across the region. Exceptional drought conditions (D4) devel¬oped in a small area of western Colorado, and remained in place over a pocket of eastern Colorado. Extreme drought conditions (D3) expanded over parts of Colorado and Wy¬oming, with D3 conditions being introduced in portions of Nebraska and western Kansas as well. Severe drought (D2) persisted over parts of all High Plains states, and new areas of D2 developed in northern North Dakota and southeastern South Dakota. Areas of moderate drought (D1) conditions expanded significantly across Nebraska and North Dakota, with some expansion across northwest¬ern Kansas. Abnormally dry conditions (D0) increased in coverage across large swaths of the High Plains region, filling in areas of South Dakota, Nebraska, and Kansas.
- Meanwhile, conditions improved in southeastern Kansas in September, as heavy rains led to the removal of D1.
- For more information, please visit the High Plains Regional Climate Center Home Page.
Southern Region (Information provided by the Southern Regional Climate Center)
- Temperatures for the month of September ranged from slightly above normal to below normal across the Southern Region. Parts of central and western Oklahoma as well as northern, central, western, and eastern Texas experienced temperatures 2 to 4 degrees F (1.11 to 2.22 degrees C) below normal, while parts of central Louisiana, northwestern Mississippi, western and eastern Tennessee, and most of Arkansas, Oklahoma, and Texas experienced temperatures 0 to 2 degrees F (0.00 to 1.11 degrees C) below normal. Conversely, parts of eastern and southern Texas, northern and southeastern Arkansas, northern, western, and southeastern Louisiana, eastern, central, and western Tennessee, and most of Mississippi experienced temperatures 0 to 2 degrees F (0.00 to 1.11 degrees C) above normal, while parts of southeastern Texas, southwestern Louisiana, and northeastern Mississippi experienced temperatures 2 to 4 degrees F (1.11 to 2.22 degrees C) above normal. The statewide monthly average temperatures were as follows: Arkansas – 71.90 degrees F (22.17 degrees C), Louisiana – 77.60 degrees F (25.33 degrees C), Mississippi – 75.50 degrees F (24.17 degrees C), Oklahoma – 70.20 degrees F (21.22 degrees C), Tennessee – 69.80 degrees F (21.00 degrees C), and Texas – 74.10 degrees F (23.39 degrees C). The statewide temperature rankings for September were as follows: Arkansas (forty-eighth coldest), Louisiana (fifty-fifth warmest), Mississippi (fifty-seventh warmest), Oklahoma (nineteenth coldest), Tennessee (sixtieth coldest), and Texas (nineteenth coldest). The region as a whole experienced its forty-ninth coldest September on record. All state rankings are based on the period spanning 1895-2020.
- Precipitation values for the month of September varied spatially across the Southern Region. Parts of northwestern Arkansas, southeastern Louisiana, southern Mississippi, northern Oklahoma, and northern and western Texas received 50 percent or less of normal precipitation. Parts of northern and western Texas received 25 percent or less of normal precipitation, while parts of western Texas received 2 percent or less of normal precipitation. In contrast, parts of central and southern Arkansas, northern Louisiana, eastern Mississippi, southern Oklahoma, eastern Tennessee, and central, eastern, and southern Texas received 150 percent or more of normal precipitation, while parts of central and southern Arkansas, northwestern Louisiana, southern Oklahoma, and central and eastern Texas received precipitation 200 percent or more of normal. The statewide precipitation totals for the month were as follows: Arkansas – 5.72 inches (145.29 mm), Louisiana – 4.30 inches (109.22 mm), Mississippi – 3.67 inches (93.22 mm), Oklahoma – 4.32 inches (109.73 mm), Tennessee – 4.22 inches (107.19 mm), and Texas – 3.97 inches (100.84 mm). The state precipitation rankings for September were as follows: Arkansas (sixteenth wettest), Louisiana (forty-seventh wettest), Mississippi (fifty-first wettest), Oklahoma (thirty-fourth wettest), Tennessee (thirty-sixth wettest), and Texas (twenty-ninth wettest). The region as a whole experienced its thirty-first wettest September on record. All state rankings are based on the period spanning 1895-2020. Drought and Severe Weather:
- At the end of September, drought conditions both improved and deteriorated across the Southern Region. Exceptional drought conditions developed and persisted across western and northwestern Texas. Extreme drought conditions persisted across southwestern Oklahoma and northern Texas, with new areas developing or expanding across western Oklahoma and western Texas; however, areas in northern and western Texas saw improvement or removal. Severe drought classifications were removed or diminished across parts of central and northern Texas as well as southwestern Oklahoma, but areas expanded across western Texas. Moderate drought classifications were removed or diminished across parts of northeastern Arkansas, western Oklahoma, and central, western, northern, and eastern Texas; however, moderate drought conditions expanded or developed across western Oklahoma, northwestern Arkansas, and western Texas. There was a decrease in the overall area experiencing abnormally dry conditions, with conditions eliminated across western Tennessee, northeastern Arkansas, southwestern and northeastern Louisiana, western Mississippi, southeastern Oklahoma, and eastern and central Texas. However, abnormally dry conditions persisted or expanded across parts of northern and eastern Mississippi, northwestern Arkansas, southeastern Louisiana, northern Oklahoma, and northern Texas.
- In September, there were approximately 44 storm reports across Texas, Oklahoma, Arkansas, Tennessee, Louisiana, and Mississippi. There were 9 tornado reports, 2 hail reports, and 33 wind reports. Arkansas tallied the most tornado reports (5) while Texas tallied the most hail (2) and wind (16) reports. Texas tallied the most reports (20) while Oklahoma tallied the fewest (1). Three states (Arkansas, Tennessee, and Texas) reported tornadoes, Texas was the only state was to report hail, and every state reported at least one wind report.
- Two tropical cyclones impacted the Southern Region in September, one directly and one indirectly. Parts of southeastern Louisiana and southern Mississippi received rainfall from Hurricane Sally, which made landfall outside the region in Alabama as a Category 2 hurricane on September 15. Texas experienced a direct landfall from Tropical Storm Beta on September 22 before its remnants drifted northeastward over the region. Over 12 inches of rain fell near Houston, Texas in a 48-hour period while Arkansas, Louisiana, Mississippi and Tennessee experienced heavy rainfall and flooding due to Beta’s remnants traversing the region.
- On September 1, 2020, there were 9 tornado reports across Arkansas (5), Tennessee (2), and Texas (2). No injuries were reported. Additionally, a wind gust of 75 mph (120.70 kph) was reported near Pampa, Texas.
- On September 2, 2020, a wind gust of 59 mph (94.95 kph) was reported near Memphis, Texas.
- On September 8, 2020, a wind gust of 67 mph (107.83 kph) was reported near Hobart, Oklahoma. Additionally, a wind gust of 63 mph (101.39 kph) was reported near Haskell, Texas.
- For more information, please visit the Southern Regional Climate Center Home Page.
Western Region (Information provided by the Western Region Climate Center)
- September marked yet another month of anomalously warm temperatures and unseasonably dry conditions across parts of the West—including Arizona, California, Nevada, and Oregon where average temperatures fell into the top 10th percentile or record warmest. In California and Oregon, numerous large wildfires—exacerbated by the extreme hot and dry conditions—burned hundreds of thousands of acres, produced dense smoke, and degraded air quality conditions into the unhealthy-to-hazardous range across the West Coast states affecting metropolitan areas including San Francisco, Portland, and Seattle. With the Southwest monsoon season ending, numerous records were broken across the region for the driest monsoon on record including Las Vegas (tied for driest) and numerous localities across the Four Corners states. Elsewhere in the West, precipitation for September was above normal (~110–250% of normal) across western portions of Oregon and Washington as well as in isolated areas of southern Colorado, central Idaho and Wyoming, and north-central Montana while the remainder of the region was dry. By the end of August, 76% of the West was experiencing drought according to the U.S. Drought Monitor—with areas of Extreme (D3) and Exceptional (D4) drought in the Four Corners states and Nevada. In terms of statewide reservoir conditions, below-average storage levels were observed (Sept. 1) in Arizona, California, Colorado, Nevada, New Mexico, and Oregon.
- In California, numerous large wildfires continued to burn—including the Creek Fire in the southern Sierra that has burned 309,033 acres (as of Oct. 1) and the Glass Fire (56,781 acres burned) in Napa and Sonoma counties forcing mandatory evacuations in Santa Rosa and Calistoga. In northwestern California, the August Complex Fire became the largest wildfire in California’s history burning 955,513 acres (as of Oct. 1). Anomalously warm temperatures were observed across the state during September including along the northwestern coastal town of Crescent City that observed its hottest September on record (dating back to 1949) with an average temperature departure of +6.2°F (+3.5°C) as well as a daily record-high temperature of 95°F (35°C), +22.5°F (+12.5°C) above normal. Further south in the Mojave Desert, Palm Springs logged an average temperature of 92.1°F (33.4°C)—a +5.7°F (+3.2°C) departure from normal. In Los Angeles County, the observing station at Pierce College (Woodland Hills) in the San Fernando Valley recorded an all-time record high of 120°F (49°C) on Sept. 6.
- In the Pacific Northwest, numerous large wildfires broke out in Oregon including a cluster of large fires in north-central Oregon (Beachie Creek, Lionshead, Riverside) that have burned a combined 535,244 acres—according to the U.S. Forest Service (Oct. 1). For the month, average temperatures were above normal across the region with the largest departures observed in western portions of Washington and Oregon including at Klamath Falls that observed its second warmest September on record dating back to 1948. Precipitation was below normal across much of central and eastern Oregon, eastern Washington, and southern Idaho while areas in western Oregon and Washington saw above-normal levels—including Shelton, Washington in the western Puget Sound that logged 3.6 in (91 mm; 220% of normal) while Eugene, Oregon in the Willamette Valley observed 2.75 in (70 mm; 213% of normal) for the month.
- In the Four Corners states, the monsoon season ended with record or near-record dryness across much of Arizona including Flagstaff, Page, Prescott, Tucson, Williams, and Window Rock.
- For the month of September, Phoenix and Tucson both observed their third highest average maximum temperatures on record at 104.1°F (40.1°C) and 99.2°F (37.3°C), respectively. In other parts of the Intermountain West, Denver set all-time high temperature records of 101°F (38.3°C) on Sept. 5 and 97°F (36.1°C) on Sept. 6. Two days later, a strong upper-level low pressure system dipped into the region from the Canadian Rockies causing temperatures to plummet nearly 60 degrees in less than 24 hours and brought early-season snowfall to areas from Montana to New Mexico—including Red Lodge, Montana that observed 7 in (178 mm) on Sept. 8 and in the south-central Colorado town of Alamosa that logged 8.8 in (224 mm) on Sept. 8.
- In Alaska, slightly above-normal temperatures prevailed across much of the state with the greatest departures along the North Slope, central Interior, and in areas of the Panhandle. For the month, precipitation was below normal in the Panhandle (less than 85% of normal) after a wet summer season while further to the north above-normal precipitation was observed across the central and northeast Interior, North Slope, and in the Northwest Gulf climate divisions. For the summer, the South Panhandle climate division recorded its wettest June-August period on record.
- In the Hawaiian Islands, drought conditions intensified leading to implementation of water restrictions in areas of Maui County (Upcountry and West Maui). For September, select rainfall totals were as follows: Hilo Intl AP 8.79 in (223 mm; 88% of normal), Honolulu Intl AP 0.07 in (1.8 mm; 10% of normal), and Lihue AP 1.26 in (32 mm; 59% of normal). Significant Events for September 2020
- Arctic sea-ice extent dips to second lowest on record: According to the National Snow & Ice Data Center, the Arctic sea-ice extent dipped sharply in early September and reached its annual minimum extent (1.44 million sq. miles; 3.74 million sq. km) on September 15, the second lowest extent observed in the 42-year satellite record.
- Worst wildfire season on record in California: According to CAL FIRE, approximately 3,754,729 acres (8,136 fires) have burned across California since January 1—making it the worst wildfire season on record with several months remaining in the 2020 season.
- For more information, please go to the Western Regional Climate Center Home Page.