National Overview

August Highlights


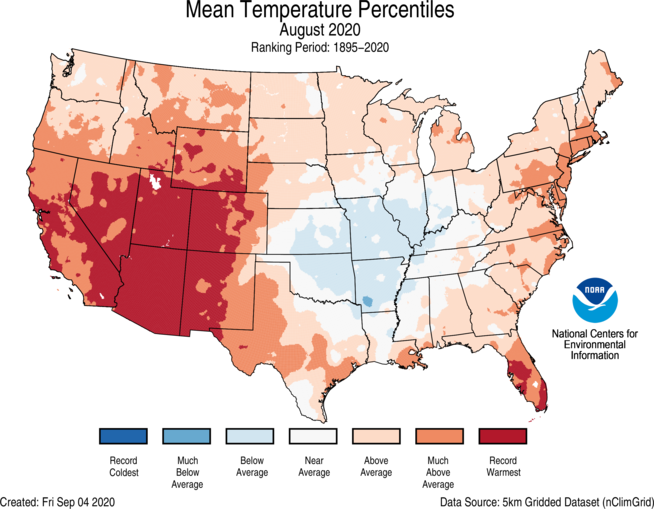
August Temperature
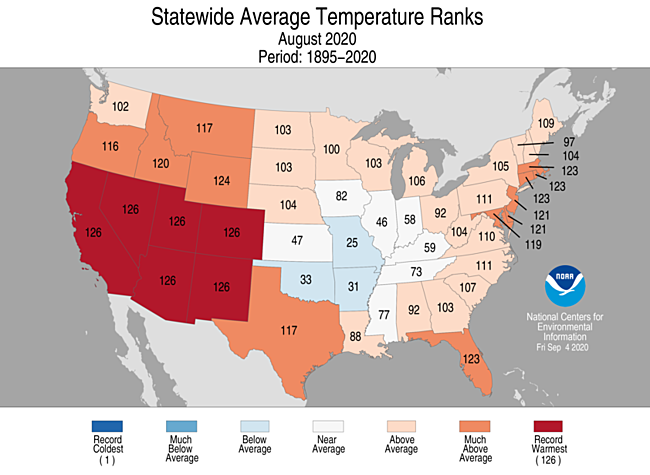
- The August contiguous U.S. temperature was 74.7°F, 2.6°F above the 20th century average and ranked third-warmest August on record.
- An unusually strong ridge of high pressure during mid-August across the western contiguous U.S. drove the record heat seen across much of the Southwest.
- Above- to much-above-average August temperatures were observed across all but an area from the central Plains to the Ohio Valley with widespread record warmth across the western U.S. California, Nevada, Arizona, Utah, New Mexico and Colorado each had their warmest August on record. Arizona shattered its previous warmest August of 2011 by 2.1°F. The predominance of warmth across the West can be attributed to record and near-record warm daytime high temperatures.
- On August 16, the Furnace Creek Visitor Center in Death Valley, California, reported a high temperature of 130°F. If verified, this temperature would be the warmest August temperature on record and the third-warmest temperature on record for any month across the U.S.
- August was the hottest month on record for Phoenix, with an average temperature of 99.1°F. This broke the previous record, 98.3°F, which was set just last month.
- Below-average temperatures were observed across parts of the central Plains and middle to lower Mississippi Valley.
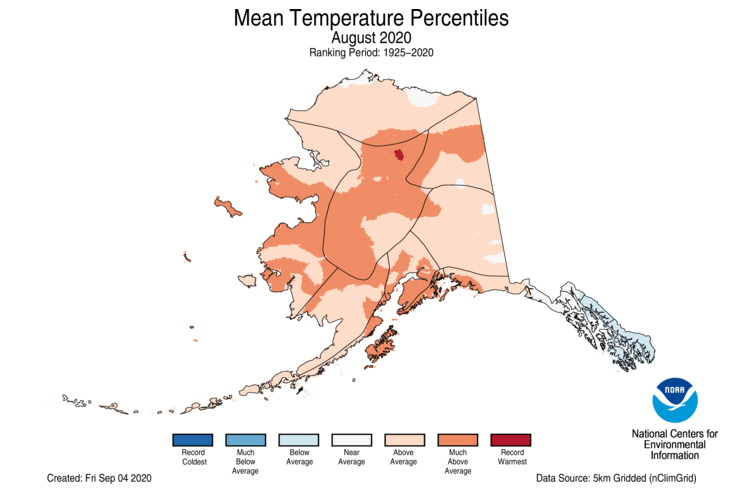
- The Alaska average August temperature was 52.1°F, 2.6°F above the long-term mean, ranking in the warmest third of the 96-year period of record for the state. Above-average temperatures were present across most of Alaska. Cooler-than-average conditions were present across much of the rain-soaked Panhandle.
- Significant sea ice melt across the Chukchi Sea occurred during August, leaving the waters 99% open. This is the lowest sea ice extent since 2012.
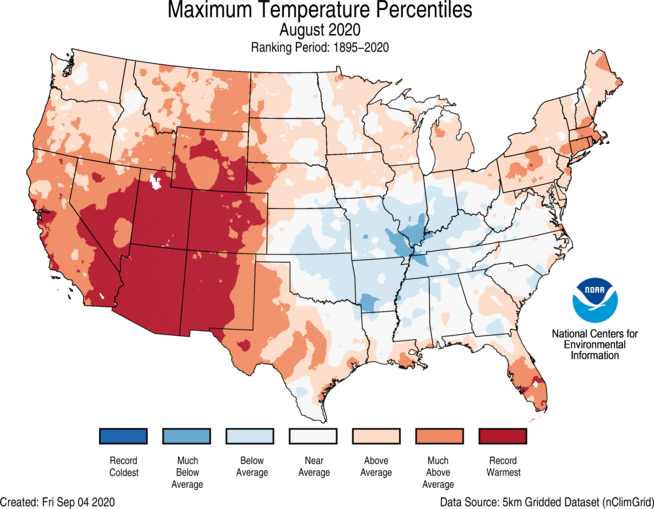
- The nationally averaged maximum (daytime) temperature was warmer than average during August at 87.9°F, 2.8°F above average, ranking fifth warmest in the 126-year record. California, Nevada, Utah, Arizona, New Mexico, Colorado and Wyoming ranked record warmest for maximum temperatures in August, while parts of the Great Plains as well as the Mississippi and Ohio valleys saw cooler than average daytime high temperatures.
- The nationally averaged minimum (nighttime) temperature during August was 61.5°F, 2.5°F above average, also ranking fifth warmest in the 126-year record. California, Nevada, Arizona and Utah ranked warmest on record while Oklahoma and Missouri ranked below average for overnight low temperatures during August.
- As of September 11, there were 10,378 warm daily high (4,632) and low (5,746) temperature records tied or broken during August. This was roughly ten times the 1,072 daily cold high (666) and low (406) temperature records set during the month.
- Based on NOAA's Residential Energy Demand Temperature Index (REDTI), the contiguous U.S. temperature-related energy demand during August was 204 percent above average and ranked sixth highest in the 126-year period of record.
August Precipitation
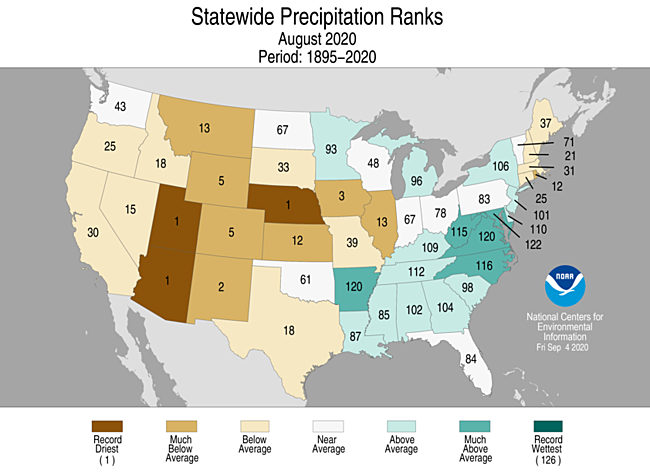
- The August precipitation total for the contiguous U.S. was 2.35 inches, 0.27 inch below average ranking in the driest third of the 126-year period of record.
- Above-average precipitation was observed from the central Gulf Coast to the mid-Atlantic and across portions of the Great Lakes and Northeast as well as coastal California. Maryland ranked fifth wettest on record for August while Virginia ranked seventh wettest.
- Below-average precipitation stretched from the Southwest to the Midwest and from the Northwest to the western Gulf Coast. Arizona, Utah and Nebraska ranked driest on record for August while New Mexico and Iowa ranked second and third driest on record, respectively.
- Precipitation across Alaska was near-average for August. Northern and western portions of the state received below-average precipitation, while much of the eastern Interior and Panhandle received above-average precipitation.
- According to the September 1 U.S. Drought Monitor report, approximately 39 percent of the contiguous U.S. was in drought, up almost seven percentage points from the end of August. Drought conditions expanded or intensified across parts of the Northeast, Midwest, Great Plains, Southwest, central Rockies, West Coast and Hawaii. Drought returned to portions of Alaska for the first time since January 2020. Drought coverage lessened across parts of the Ohio Valley and Great Lakes, with drought conditions eliminated across the Commonwealth of Puerto Rico.
Extremes
- Hurricane Isaias made landfall on August 4 at Ocean Isle Beach, North Carolina, and accelerated up the East Coast, resulting in widespread damage and power outages across New York, New Jersey and Pennsylvania.
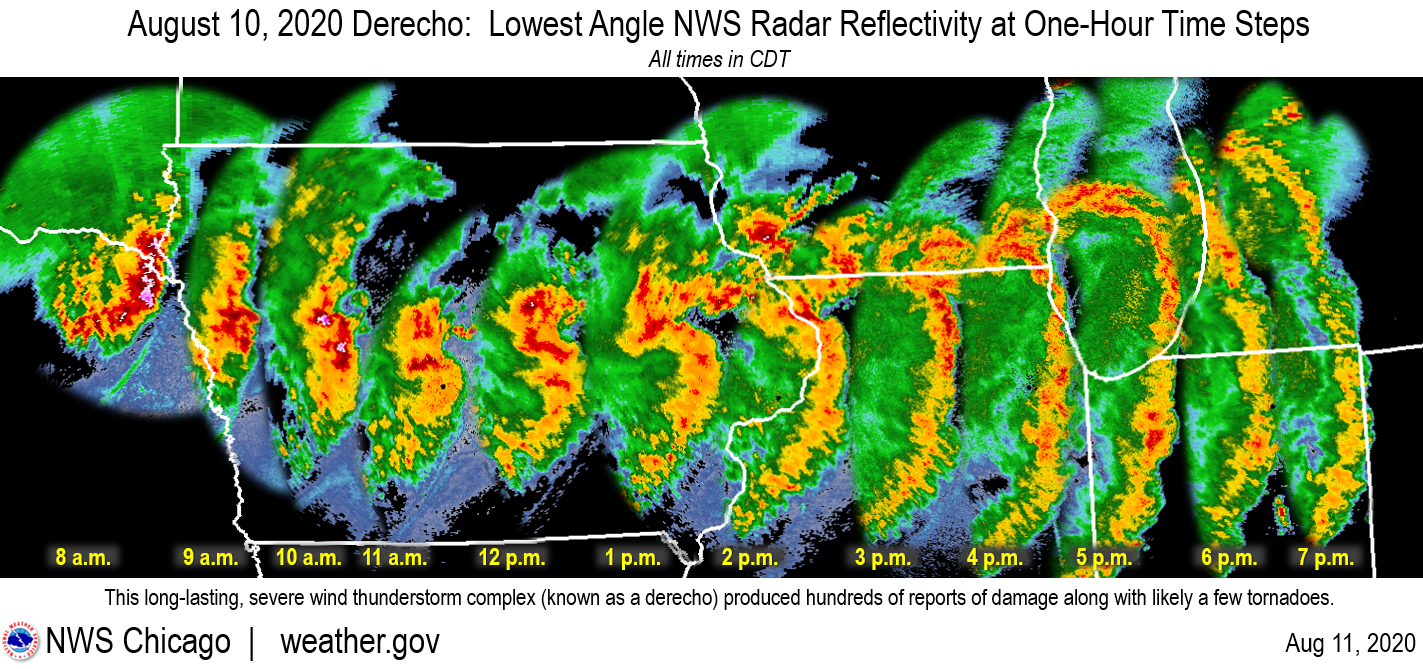
- On August 10, a derecho, or line of severe weather, raced 700 miles across the central U.S. from Iowa to Ohio and brought significant damage to crops and infrastructure with reports of widespread winds more than 100 mph.
- In August, tropical storms Josephine and Kyle as well as hurricanes Laura and Marco became the earliest 10th through 13th named storms on record in the North Atlantic Basin, continuing the streak of record-pace named storms this season. Including tropical storms Nana and Omar, which formed on September 1, 12 of the 15 named storms to-date in 2020 occurred earlier in the calendar year than any other such named storm on record.
- On August 27, Hurricane Laura made landfall in southwest Louisiana as a Category 4 storm with 150 mph winds. This tied the 1856 Louisiana hurricane for the strongest landfalling winds on record for the state.
- As of September 1, the SCU and LNU Lightning Complex and the August Complex wildfires, burning in central and northern California, are the second-, third- and fourth-largest fires on record in California, respectively, and currently fall shy of the record Mendocino Complex fire of 2018, in which 459,123 acres were consumed.
- The Pine Gulch wildfire, near Grand Junction, Colorado, is the largest wildfire in Colorado history with over 139,000 acres consumed and was approximately 80% contained at the end of August. The previous record was held by the 2002 Hayman Fire.
Summer Highlights
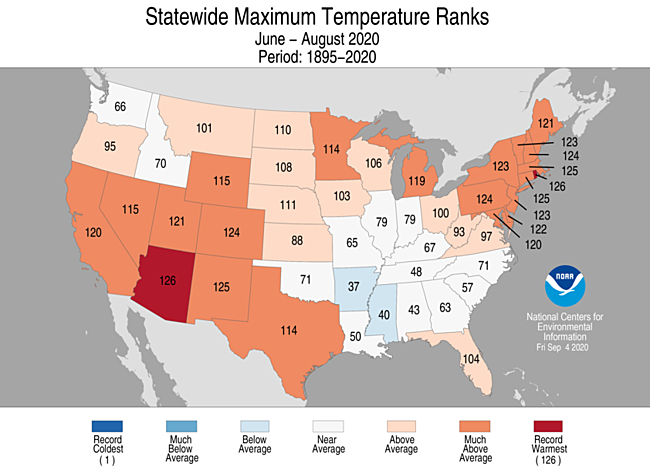
June-August Temperature
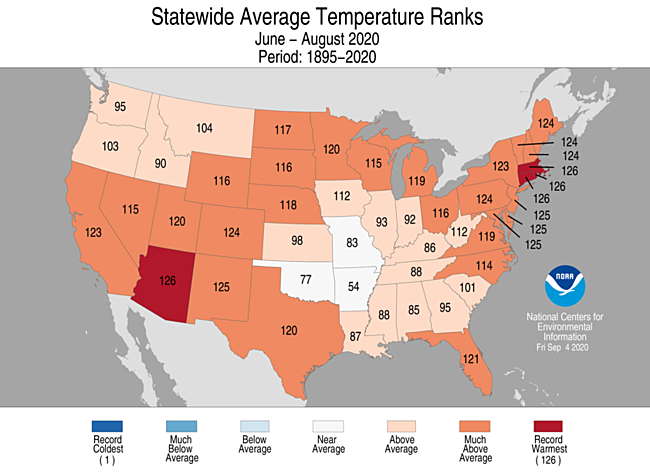
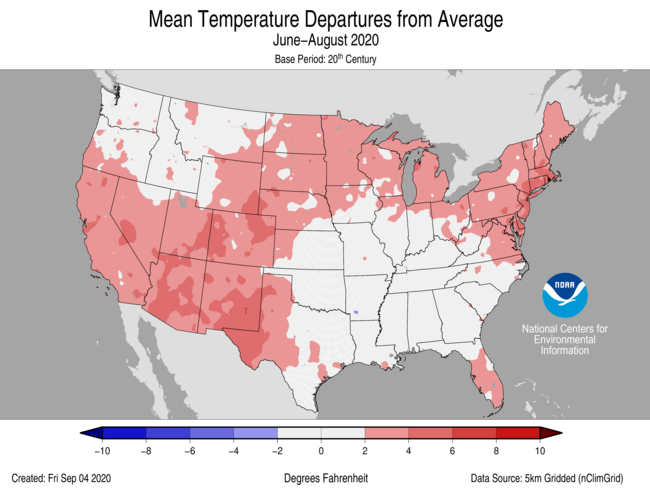
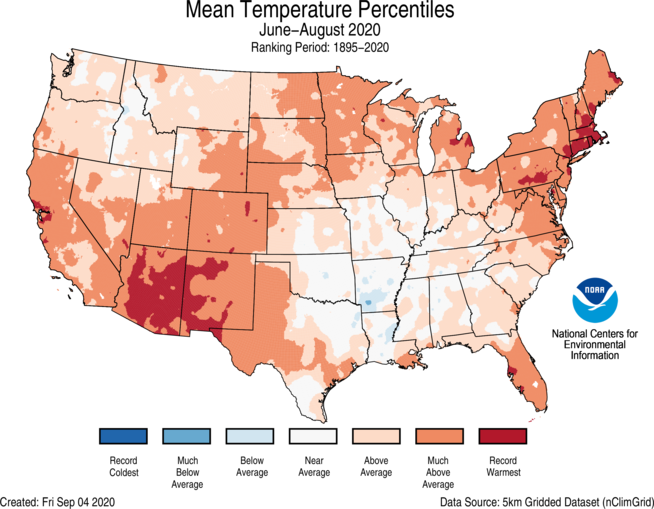
- During meteorological summer (June-August), the average temperature for the Lower 48 was 73.6°F, 2.2°F above average, ranking fourth warmest in the historical record.
- Above- to much-above-average summer temperatures spanned most of the Lower 48 with pockets of near-average and below-average temperatures observed in the Lower Mississippi Valley. Arizona, Connecticut, Rhode Island and Massachusetts each reported their warmest June-August on record. Eleven additional states had a top-5 warmest summer. No state ranked below average for the summer season.
- Many stations across the Southwest, Southeast, mid-Atlantic and Northeast tied or broke their record for the warmest summer on record.
- The Alaska statewide average temperature for the summer was 52.0°F, 1.5°F above average and ranked in the warmest one-third of the 96-year record. Temperatures were warmer than average across central, western, southwestern and southcentral Alaska, while much of the North Slope and eastern Interior were near average. Below-average temperatures were present across much of the Panhandle.
- Kodiak reported its sixth-warmest summer since the 1930s, with 2015, 2016 and 2019 each warmer than what was observed in 2020.
- Seasonal wildfire activity across Alaska was below-average with the lowest acreage consumed since 2008.
- The contiguous U.S. average maximum (daytime) temperature during June-August was 86.5°F, 2.1°F above the 20th century average, ranking eighth warmest on record. Above- to much-above-average maximum temperatures were observed across the West, northern Plains, Great Lakes, Northeast and portions of the Gulf Coast. Below-average maximum temperatures were concentrated in parts of the Mississippi River Valley, Southeast and Northwest. Arizona ranked warmest on record for daytime temperatures during the summer, exceeding the previous record set in 2002 by 1.0°F.
- The contiguous U.S. June-August minimum (nighttime) temperature was 60.7°F, 2.2°F above average, and ranked fourth warmest on record. Above- to much-above-average minimum temperatures were observed across nearly all of the Lower 48 states. Arizona, Maryland, Delaware, New Jersey, Connecticut, Rhode Island and Massachusetts each had their warmest summer for minimum temperatures.
- Based on NOAA's Residential Energy Demand Temperature Index (REDTI), the contiguous U.S. temperature-related energy demand during June-August was 224 percent above average and ranked as the fourth highest value in the 126-year period of record.
June-August Precipitation

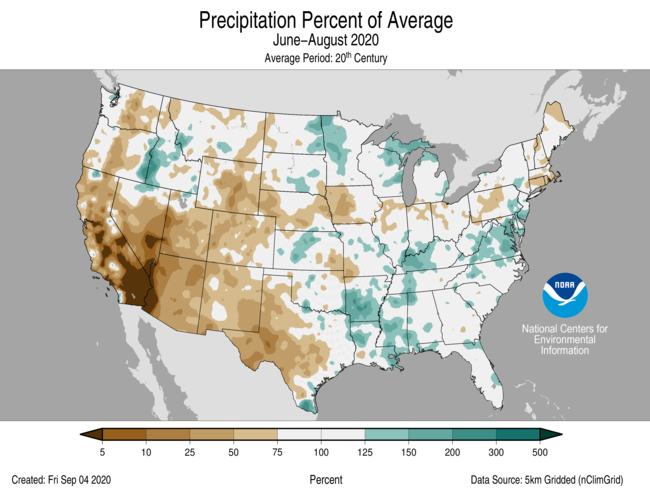
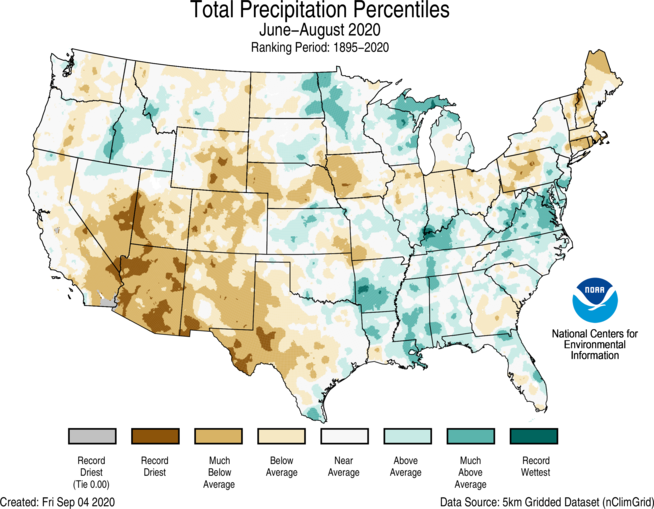
- The summer precipitation total was 7.99 inches, 0.33 inch below average, ranking in the driest third of the historical record.
- Above-average precipitation was observed in parts of the Northwest, the Great Lakes and from the lower Mississippi River Valley to the mid-Atlantic. Virginia had its 10th-wettest summer on record.
- Below-average precipitation was observed across much of the West, Rockies, Deep South and from portions of the central Plains to the Northeast. Arizona had its driest summer on record receiving about 33% of its seasonal average. This follows the previous record dry summer of 2019, which yielded approximately 41% of average precipitation. New Mexico, Colorado, California and Rhode Island each had a top-10 driest summer.
- In Alaska, Ketchikan reported its wettest summer on record with nearly four feet of rainfall. Juneau set a record for the most number of summer days with measurable rainfall — 68. The former record of 67 days was reported in 2006. In contrast, Kotzebue, had its second-driest August since 1943 and subsequently, the lowest summer rainfall observed since 1977.
June-August Extremes
- The U.S. Climate Extremes Index (USCEI) for summer was 31 percent above average and ranked in the upper third of the 111-year period of record. On a national scale, elevated extremes in warm maximum and minimum temperatures as well as wet PDSI were the main contributors to this above-average value. The USCEI is an index that tracks extremes (falling in the upper or lower 10 percent of the record) in temperature, precipitation and drought across the contiguous United States.
- On the regional scale, extremes across the Northeast ranked fourth highest and were due primarily to extremes in warm maximum and minimum temperatures, wet PDSI, as well as extremes in 1-day precipitation. The Southwest ranked seventh highest and was primarily impacted by warm extremes in maximum and minimum temperatures and dry PDSI.
Year-to-Date Highlights

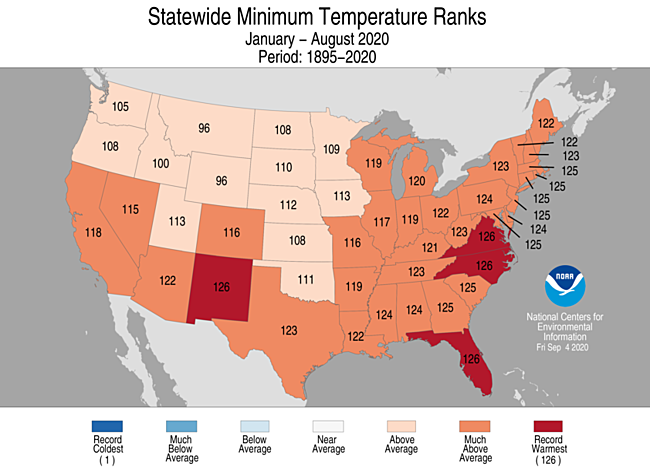
January-August Temperature

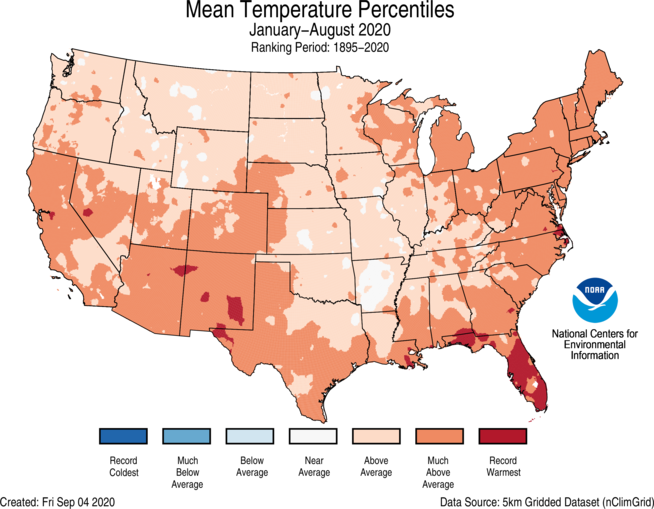
- For the year-to-date, the national temperature was 56.3°F, 2.4°F above average, ranking seventh warmest in the historical record.
- Above- to much-above-average year-to-date temperatures were observed across nearly the entire Lower 48. The year-to-date average temperature for Florida ranked warmest on record with 2019 and 2017 ranking second and third warmest, respectively. Maryland, Delaware, New Jersey and Rhode Island ranked second warmest for this January-August period.
- Phoenix shattered a record for the most number of days in a calendar year with a high temperature of at least 110°F. Through September 1, there were 50 days in 2020 where temperatures were at least 110°F. This exceeds the 2007 record of 33 days.
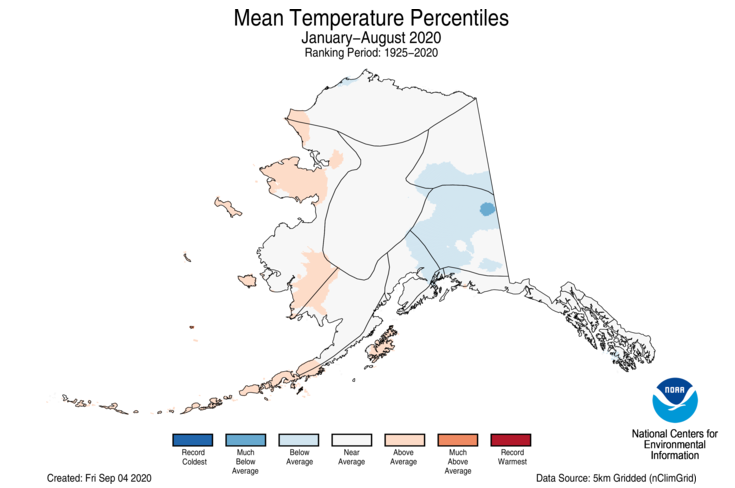
- Year-to-date temperatures averaged across Alaska were near-average with above-average temperatures observed along portions of the West Coast and the Aleutians. Below-average temperatures for this year-to-date period were observed across parts of the eastern interior regions and Cook Inlet.
- The contiguous U.S. average maximum (daytime) temperature during January-August was 68.2°F, 2.2°F above the 20th century average, ranking seventh warmest in the 126-year record. Above- to much-above-average maximum temperatures were observed across most of the Lower 48. Portions of the Mississippi Valley had below-average daytime temperatures for the first eight months of the year.
- The contiguous U.S. January-August minimum (nighttime) temperature was 44.4°F, 2.7°F above average, and ranked fifth warmest on record. Above- to much-above-average minimum temperatures were observed across most of the Lower 48. Portions of the central Rockies had below-average nighttime temperatures for this year-to-date period. New Mexico, Florida, North Carolina and Virginia ranked record warmest for this year-to-date period with seven additional states ranking second warmest.
- Based on REDTI, the contiguous U.S. temperature-related energy demand during January-August was 51 percent above average and ranked 13th lowest in the 126-year period of record.
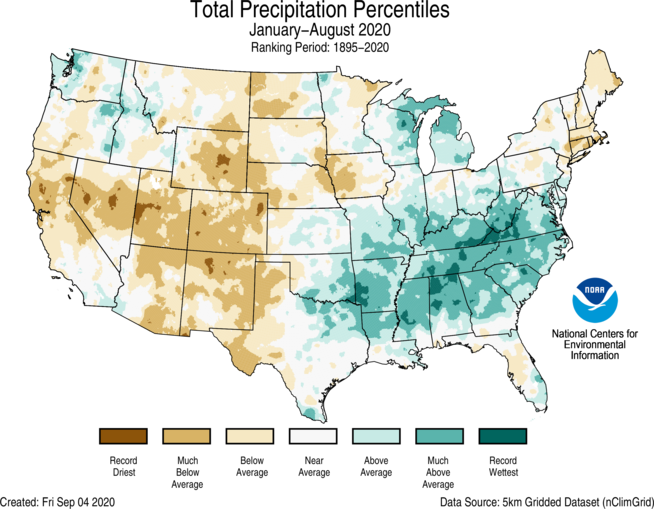
January-August Precipitation

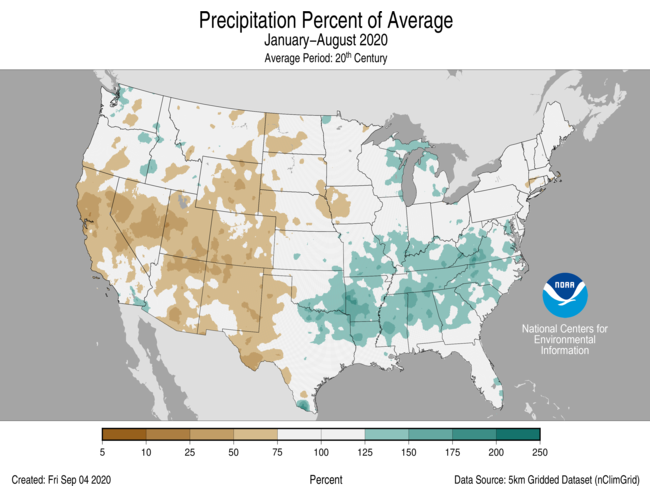
- The year-to-date precipitation total for the Lower 48 was 21.64 inches, 0.93 inch above average, ranking in the wettest one-third of the record. Five of the first six months of 2020 were wet, contributing to the record wet accumulation for January-August.
- Above- to much-above-average January-August precipitation occurred in portions of the Northwest and from the Great Lakes to the Gulf Coast and from the central Plains to the mid-Atlantic region. Tennessee and Virginia ranked second wettest for this year-to-date period with Alabama ranking third wettest.
- Drier-than-average conditions occurred from the West Coast to the Rockies and into portions of the Plains as well as across parts of New England. Colorado ranked third driest while Utah ranked fourth driest for this year-to-date period.
- For Alaska, January-August precipitation was lower than average across the western North Slope and northern West Coast as well as the Aleutians and central Gulf Coast. Above-average precipitation was observed across parts of the southern West Coast, Bristol Bay, eastern Interior regions and the Panhandle.
Extremes
- The USCEI for the year-to-date was 59 percent above average and ranked 10th highest in the 111-year period of record. Extremes in warm maximum and minimum temperatures, record wet PDSI and the number of days with precipitation contributed to this elevated value.
- On the regional scale, the Southeast ranked highest on record for the January to August period. This was due to a combination of warm maximum and minimum temperatures, wet PDSI values, extremes in 1-day precipitation and the number of days with precipitation across the region. The Northeast ranked third highest and experienced elevated extremes in warm maximum and minimum temperatures, wet PDSI values and the number of days with precipitation.
Regional Highlights
These regional summaries were provided by the six Regional Climate Centers and reflect conditions in their respective regions. These six regions differ spatially from the nine climatic regions of the National Centers for Environmental Information.
Northeast Region (Information provided by the Northeast Regional Climate Center)
- The Northeast had its 15th hottest August since 1895 with an average temperature of 70.1 degrees F (21.2 degrees C), which was 2.0 degrees F (1.1 degrees C) above normal. All twelve Northeast states were warmer than normal, with departures ranging from 1.1 degrees F (0.6 degrees C) above normal in Vermont to 3.6 degrees F (2.0 degrees C) above normal in Rhode Island. This August ranked among the 20 hottest on record for eight states: Rhode Island, second hottest; Connecticut and Massachusetts, third hottest; New Jersey, fifth hottest; Delaware and Maryland, sixth hottest; Pennsylvania, 15th hottest; and Maine, 17th hottest. Portland, Maine, recorded six days this August with a high of at least 90 degrees F (32 degrees C), tying its August record. The Northeast had its third hottest summer since recordkeeping began with an average temperature of 70.0 degrees F (21.1 degrees C), which was 2.4 degrees F (1.3 degrees C) above normal. It was the hottest summer on record for Connecticut, Massachusetts, and Rhode Island. This summer ranked as the second hottest on record for Delaware, Maryland, and New Jersey and as the third hottest for Maine, New Hampshire, Pennsylvania, and Vermont. New York had its fourth hottest summer, while West Virginia had its 16th hottest. State temperature departures ranged from 1.5 degrees F (0.8 degrees C) above normal in West Virginia to 3.2 degrees F (1.8 degrees C) above normal in Connecticut, Massachusetts, and Rhode Island. Nine major climate sites had their hottest summer on record: LaGuardia Airport, New York; Harrisburg and Williamsport, Pennsylvania; Burlington, Vermont; Caribou and Portland, Maine; Bridgeport and Hartford, Connecticut; and Providence, Rhode Island. Hartford, Connecticut, recorded 39 days this summer with a high of at least 90 degrees F (32 degrees C), the greatest on record for summer.
- The Northeast had a wetter-than-normal August, receiving 4.43 inches (112.52 mm) of precipitation, 114 percent of normal. The states were split, with six being drier than normal and six being wetter than normal. Precipitation ranged from 45 percent of normal in Rhode Island, its 13th driest August, to 240 percent of normal in Maryland, its fifth wettest August. In addition, West Virginia had its 16th wettest August and Delaware had its 17th wettest. It was a drier-than-normal summer in the Northeast, with the region receiving 11.30 inches (287.02 mm) of precipitation, 92 percent of normal. Eight states were drier than normal, with five ranking this summer among their 20 driest on record: Rhode Island, ninth driest; Connecticut, 11th driest; Maine and New Hampshire, 13th driest; and Massachusetts, 17th driest. Precipitation for all twelve states ranged from 56 percent of normal in Rhode Island to 142 percent of normal in Maryland, its 13th wettest August. Harford, Connecticut, received only 4.42 inches (112.27 mm) of precipitation during summer, making it the site’s driest summer on record and beating the old record of 4.75 inches (120.65 mm) from 1965.
- The U.S. Drought Monitor released on August 6 showed 29 percent of the Northeast in a severe or moderate drought and 35 percent as abnormally dry. During August, conditions worsened in New England, with severe and moderate drought expanding and every part of the region except a small portion of southwestern Connecticut experiencing some level of dryness. Conditions were mixed in New York, with moderate drought and abnormal dryness improving in eastern parts of the state but worsening in western parts. Moderate drought and abnormal dryness also expanded in the western half of Pennsylvania. The U.S. Drought Monitor released on August 27 showed 37 percent of the Northeast in a severe or moderate drought and 23 percent as abnormally dry. Water restrictions remained in place for numerous locations in Massachusetts and several locations in Connecticut and Pennsylvania. As of August 27, 143 community water systems in New Hampshire had restrictions in place. Some shallow wells went dry in Maine and Vermont. York Water District in Maine temporarily siphoned water from Kittery Water District due to drought conditions and increased water demand. During August, some New England waterways had daily record low flows. New York farmers reported varying crop conditions, with some corn showing drought stress and uneven oat maturity. With unusually dry soils in parts of New England, farmers continued to irrigate frequently in order to keep crops growing. However, there were concerns about water sources for irrigation drying up. A Connecticut grower said irrigation costs were $1,000 a month. Some farmers also invested in irrigation infrastructure for the first time due to this year’s drought. Crops in nonirrigated fields showed signs of moisture stress, and there were some crop losses. The drought conditions caused apples to be smaller-sized in some New England locations. Crop ratings for farms throughout southern New Hampshire were at their lowest levels as the timing of precipitation did not align with key planting and pollinating seasons. In western Vermont, hay yields were down and corn was short, with hundreds of acres possibly a loss. In addition, poor pasture conditions forced some farmers to buy supplemental feed for livestock; however, there was a decreased supply of affordable feed due to drought conditions in other Northeast states. Maine farmers reported having to sell cattle early due to lack of hay, struggling to keep up with irrigation needs, and drought impacts on several crops. A few northern Maine farmers initiated the process to allow for emergency haying and grazing on conservation reserve lands because of this year’s drought. Lawns turned brown in several locations, including in parts of southeastern Massachusetts and central Pennsylvania. Drought stress caused leaves to turn yellow/brown and/or drop earlier than usual in some New England, New York, and Pennsylvania locations. There have been fewer mosquitoes in Massachusetts so far this year due to the drought, which dried up breeding grounds. The fire risk was elevated in New England due to drought conditions. According to Massachusetts officials, “Long term precipitation deficits have also led to extremely dry soil conditions, which results in fires burning deep into the ground, and taking multiple days to extinguish. These conditions exhaust local resources and increase risk to firefighter safety.” Jefferson County, Pennsylvania, enacted a 30-day burn ban on August 27 in order to prevent forest fires due to drought conditions.
- On August 2, severe storms produced three tornadoes in New England. Tropical Storm Isaias, the Atlantic Ocean’s earliest "I" named tropical system on record, produced extreme rainfall, tornadoes, and damaging winds in the Northeast on August 4. The greatest rain totals ranged from 4 to 9 inches (102 to 229 mm), with Allentown, Pennsylvania, having its wettest August day with 4.92 inches (124.97 mm) of rain. Significant flooding occurred, particularly in southeastern Pennsylvania where several waterways recorded their highest water levels on record. For instance, the Perkiomen Creek at Graterford, Pennsylvania, reached 19.14 feet (5.83 m), nearly a foot (0.30 m) higher than its previous record from 1935. Across the region, there were hundreds of closed roads, stranded vehicles, water rescues, and buildings affected by flooding. Preliminary estimates indicated millions of dollars in damage from flooding along the Schuylkill River near Philadelphia, Pennsylvania. Isaias produced 17 tornadoes in the region (10 in Maryland, three in Delaware, two each in Pennsylvania and New Jersey, and one in Connecticut), with the strongest rated EF-2. One tornado in Delaware was on the ground for over 35 miles (56 km), the state's longest tornado track on record. The storm's highest wind gusts ranged from 60 to 78 mph (27 to 35 m/s). Mount Washington, New Hampshire, had its highest August wind gust of 147 mph (66 m/s). The tornadoes and wind gusts caused structural damage and downed numerous trees. More than 2.5 million customers lost power, making it one of the largest storm-related outages for two energy companies. Power outages lasted five days in some locations. There were at least five storm-related deaths. Preliminary damage estimates in Delaware exceeded $20 million. On August 7, just a few days after Isaias' excessive rainfall, strong storms produced heavy rain and more flash flooding in southeastern parts of the region. Winterthur, Delaware, saw 4.11 inches of rain (104.39 mm), more than a month's worth, in an hour, with 1.03 inches (26.16 mm) of that falling in five minutes, qualifying as a 1,000-year storm event. Northern Delaware experienced some of its worst flash flooding in at least 15 years. In southeastern Pennsylvania, Chester Creek rose to its fourth highest water level on record, exceeding its previous fourth highest level set days earlier. Flash flooding due to heavy rain occurred again in parts of Maryland, Delaware, southeastern Pennsylvania, and New Jersey on August 12 and 13. There were road closures, cars trapped in floodwaters, and water rescues. Quick rises on waterways were observed. For instance, in Maryland, East Branch Herbert Run at Arbutus rose more than seven feet (2 m) in an hour and the Patapsco River at Elkridge rose 9.6 feet (2.9 m) in over an hour. Severe storms spawned an EF-1 tornado in eastern New York on August 10 and an EF-0 tornado in central New Jersey on August 19, with damage from both tornadoes mostly consisting of snapped or uprooted trees. The Northeast experienced severe weather almost daily from August 22 to 29. An EF-0 tornado and straight-line winds of up to 80 mph (36 m/s) damaged trees in New Hampshire on August 22. On August 23, localized heavy rain led to flash flooding. For instance, a weather station near Elam, Pennsylvania, picked up 4.65 inches (118.11 mm) of rain in around 90 minutes, making it a 500-year storm event and leading to several flooded roadways. On August 27, four (EF-0 or EF-1) tornadoes and straight-line winds caused extensive damage to numerous buildings and felled trees in western Connecticut and southeastern New York. Lime-sized hail was reported in western New York. On August 28, there were multiple reports of flooded basements and closed roads due to flash flooding in western Pennsylvania. Two EF-1 tornadoes touched down in eastern New York on August 29.
- For more information, please visit the Northeast Regional Climate Center Home Page.
Midwest Region (Information provided by the Midwest Regional Climate Center)
- August precipitation varied from very dry to quite wet across the Midwest. The central Midwest was dry while the Upper Midwest and the Ohio River Valley were wet. Regionwide precipitation was 3.21 inches (82 mm) which was 0.45 inches (11 mm) below normal. Most of Iowa, northern Missouri, and northern Illinois had less than half the normal total for the month, with southern Iowa and northwestern Illinois receiving less than 25 percent of normal. Areas in Minnesota, Upper Michigan, and Kentucky had more than 175 percent of their normal monthly precipitation, with a few locations in each state topping 200 percent of normal. Statewide, Iowa ranked as the 3rd driest (1895 to 2020), Illinois ranked 13th driest, while Kentucky ranked as the 18th wettest in its history. Summer precipitation also ranged from well below normal to well above normal. Drier than normal areas stretched from Iowa, across northern Illinois, northern and central Indiana, to much of Ohio and Lower Michigan. Southwestern Missouri was also drier than normal. Wetter than normal areas included two areas of the region, in the north and the south. The northern wet region included much of Minnesota and Wisconsin, Upper Michigan, and a few areas in Lower Michigan. The southern wet region included parts of northern and eastern Missouri, southern Illinois, southern Indiana, and nearly all of Kentucky. The driest area was in western Iowa with less than 50 percent of normal and the wettest area was in west central Minnesota where totals topped 175 percent of normal. Areas in western Kentucky and Upper Michigan also received more than 150 percent of normal in the summer months.
- August temperatures were within 2 degrees F (1 C) of normal across the Midwest. Cooler-than-normal temperatures were primarily in the southwestern parts of the region while warmer-than-normal temperatures were in the northern and eastern areas. Temperatures for the region were 71.2 degrees F (21.8 C) which was 0.3 degrees F (0.2 C) above normal. Cool temperatures early in the month gave way to warmer conditions later in the month. Daily records were nearly even (290 record highs and 310 record lows) during August. Summer temperatures ranged from near normal in the southern Midwest to above normal in the northern Midwest. Temperatures were about 3 degrees F (2 C) above normal in northwestern Iowa for the summer period.
- On August 10th, a sustained line of thunderstorms known as a derecho impacted areas from Iowa through Ohio, causing millions of dollars in damage. Forming in eastern Nebraska and southern South Dakota during the early morning hours, the derecho tore a path through central Iowa in the mid- to late morning. Significant damage to structures, trees and cropland were sustained, with more than an estimated five million acres of corn and soybeans flattened. Wind gusts along the derecho frequently reached 70-80 mph (110-130 kph), higher gusts recorded above 90 mph (145 kph). A 100-mph (161 kph) gust was reported in Hiawatha, Iowa, and a 112-mph (180 kph) wind gust was reported near Midway, Iowa. Some of the worst damage to structures occurred in Linn County, where Cedar Rapids, Iowa is located. A bike rider was struck by a tree in Cedar Rapids, leading to a fatality. Several days after the event, more than 100,000 people were still without power in the Cedar Rapids area, and tens of thousands were without power for more than a week, as many local and regional utility crews had been dispatched to the east coast for Hurricane Isaias recovery. An estimated 90 percent of structures in Cedar Rapids sustained some sort of damage from the storm, and more than 1,000 homes were destroyed. Further east, impacts continued in northern Illinois and southern Wisconsin, with several EF-1 tornadoes reported in the Chicago metro area. Wind gusts remained over 70 mph (112 kph) along the storm’s path, with a 92-mph (148 kph) gust near Dixon, Illinois. At least six injuries were reported in Illinois, which included five from the destruction of a trailer park near Forreston, Illinois. More than 800,000 people were without power at one point in the Chicago area, with more than 100,000 without power for several days. As the derecho moved into Indiana and Lower Michigan, winds slowly began to weaken, as gusts were reported between 60-65 mph (95-105 kph). Several tornadoes were reported as well. A woman and child were trapped in a mobile home near Wallen, Indiana from the storm, with the woman later dying in the hospital. More than 100,000 customers were without power in Michigan and Indiana after the storm, while thousands more waited several days for power to return. As storm finally began to dissipate, isolated gusts caused damage in western Ohio. In total, 695 severe weather reports were recorded in the Midwest from the derecho and other scattered severe weather on August 10th, resulting in at least 60 injuries and 4 deaths. Estimates indicated at least 1.9 million people in the region lost power due to the storms, peaking with 1.2 million without power at the same time.
- Extremely dry conditions in August worsened drought in Iowa according to the U.S. Drought Monitor. Extreme drought was introduced in west-central Iowa at the beginning of the month, with areas of moderate and severe drought expanding during the month. By the end of the month, more than 60 percent of the state was in drought, with more than 95 percent either abnormally dry or in drought. Dry conditions during the month also led to abnormally dry weather in northern Illinois. Many of these areas had less than half the normal amount of precipitation during the month, along with warmer than normal temperatures during the second half of the month.
- Crop conditions severely declined in August across Iowa and the Corn Belt from the effects of drought and the August 10th derecho. Corn and soybeans in western Iowa were already stressed from extreme drought before severe winds led to the flattening of millions of acres of crops. Advanced metrics tracking corn conditions in Iowa and across the U.S. indicated a sharp decline from late July through August. As of the August 31st USDA NASS Crop Progress Report, 25 percent of Iowa corn was rated poor to very poor while only 19 percent of Iowa topsoil moisture was rated as adequate.
- Severe weather was common throughout August. More than 1,200 reports of strong winds, hail and tornadoes were reported during the month, with more than 500 reports on days other than August 10th. Prior to the derecho, severe storms impacted Minnesota and Wisconsin from August 7th to 9th. Strong winds and several brief tornadoes were reported, with the western suburbs of the Twin Cities receiving 2-inch (5 cm) diameter hail on August 9th. On August 14th, an outbreak in Minnesota led to more than 80 reports, with five tornadoes reported in Grant County, Minnesota alone. Strong winds led to a grain bin collapse near Felton, Minnesota while many trees and power lines were felled. Rounds of severe thunderstorms also impacted Ohio from August 25th to 28th.
- For further details on the weather and climate events in the Midwest, see the weekly and monthly reports at the Midwest Climate Watch page.
Southeast Region (Information provided by the Southeast Regional Climate Center)
- Temperatures were near average across much of the Southeast region and Puerto Rico for the month of August. Monthly mean temperatures were within 2 degrees F (1.1 degrees C) of average for 80 percent of the 178 long-term (i.e., period of record equaling or exceeding 50 years) stations across the region. There were six stations that observed their warmest August on record, including Cape Hatteras, NC (1874-2020), and Sarasota, FL (1911-2020). Maximum temperatures ranged from 3.7 degrees F (2.1 degrees C) above normal in Elizabeth City, NC (1934-2020) to 5.2 degrees F (2.8 degrees C) below normal in Oneonta, AL (1894-2020). Daily temperature minimums ranged from 5.9 degrees F (3.3 degrees C) above normal in Clayton, NC (1955-2020) to 2.4 degrees F (1.3 degrees C) below normal in Haleyville, AL (1902-2020). High rates of evaporation and the persistent influx of tropical moisture suppressed nighttime cooling during the month. Indeed, there were several stations that saw minimum temperatures above 70 degrees F (21 degrees C) for the entire month including, Wilmington, NC (1870-2020) and Norfolk, VA (1874-2020). The warmest weather of the month occurred from the 9th through the 12th, as the circulation around the Bermuda High, situated off the Atlantic coast, transported warm, humid air over much of the Southeast region. Daily maximum temperatures exceeded 90 degrees F (32 degrees C) across portions of every state, with a few stations reaching 100 degrees F (38 degrees C), including Muscle Shoals, AL (1893-2020). In contrast, the coolest weather of the month across the Southeast occurred from the 17th – 20th, as the circulation around a departing mid-latitude cyclone ushered in relatively cooler and drier air from Canada. Daily minimum temperatures fell below 70 degrees F (21 degrees C) across portions of every state, with a few locations in the higher elevations of North Carolina and Virginia falling below 60 degrees F (16 degrees C).
- Precipitation was slightly above average across the Southeast region during August, with a few wet and dry extremes recorded. The driest locations were found across southern Florida, eastern Georgia, eastern North Carolina, and western Puerto Rico. Monthly precipitation totals ranged from 70 to less than 25 percent of normal across these locations. Only one long-term station (i.e., period of record equaling or exceeding 50 years) observed August precipitation that ranked in the top five driest on record, Coloso, PR (1899-2020; 5th driest), which received 6.18 inches (157 mm) of precipitation, over 3 inches (76 mm) below normal. In contrast, the wettest locations were located across Virginia, western North Carolina, northern Georgia, and northern Alabama. Precipitation totals ranged from 150 to 300 percent of normal. Indeed, Statesville, NC (1901-2020) received 15.78 inches (401 mm) of precipitation, which was more than 11 inches (279 mm) above average, making this the wettest August on record. From the 3rd through the 5th, Hurricane Isaias impacted parts of South Carolina, North Carolina, and Virginia, with numerous reports of localized flooding. Williamsburg, VA (1948-2020) received over 5 inches (127 mm) of rain from the storm. From August 20th – 22nd, Hurricane Laura passed by Puerto Rico, dropping over 6 inches (152 mm) of precipitation across the southern and eastern portions. There were several reports of flooding and landslides, including two people that had to be rescued due to river flooding from the rapidly rising Toro Negro River. On August 31st, a line of slow-moving thunderstorms brought over 5 inches (127 mm) of rain to Johnston County, NC. Tragically, a 5-year old girl and her 4-year old brother were swept away in the flood waters.
- There were 520 reports of severe weather across the Southeast during August, which is 176 percent of the median monthly frequency of 295 reports during 2000-2018. There were 31 confirmed tornadoes reported for the month (11 EF-0, 15 EF-1, 4 EF-2, 1 EF-3), almost 4 times the monthly average of 8. A total of 22 of these tornadoes were associated with Hurricane Isaias. The strongest of these tornadoes spawned as a rare EF-3 tornado from Hurricane Isaias in Bertie County, NC on August 4th. It completely destroyed several mobile homes, flattening some and leaving unrecognizable bits of debris for others. Maximum wind speed was estimated to be 140 - 145 mph (63 - 65 m/s). Unfortunately, there were 14 injuries and 2 fatalities reported. Hurricane Isaias made landfall near Ocean Isle Beach, NC on August 3rd, with peak winds of 85 mph (38 m/s). Federal Point, NC reported a wind gust of 99 mph (44 m/s) and Oak Island, NC reported a wind gust of 87 mph (39 m/s). Unfortunately, the 8.5-9.5 feet of storm surge destroyed many dunes and sea turtle nests in Oak Island, NC. At the height of the storm, over 53,000 customers in Brunswick County, NC were without power. There were 27 reports of hail for the month, with the largest being tennis-ball sized (2.5 inches) in Gordon County, GA on August 3rd. There were 457 wind reports for the month, which is 174 percent of the average (262 reports). On August 23rd a mesonet station in St. George Island, FL reported a wind gust of 75 mph (34 m/s) due to a passing squall line. Damaging straight line winds associated with severe thunderstorms impacted Bedford County, VA on August 24th. There were reports of several trees and large tree branches downed from these winds leaving over 3,000 households without power, however no injuries or fatalities were reported. Unfortunately, there were two lightning deaths in the region for the month. A 77-year old man and a 42-year old man were struck while cleaning Hurricane Isaias debris from their yard on August 5th.
- Drought conditions decreased across the Southeast for August, while Puerto Rico remained drought-free the entire month. At the beginning of the month, small pockets of moderate drought (D1) surrounded by abnormally dry conditions (D0) were in Georgia, Alabama, and western Florida. By the end of the month, however, only small pockets of abnormally dry conditions (D0) were found in Georgia, Alabama, Florida, and southern Puerto Rico. The citrus growing region in Florida continued to experience warm conditions, and grove activities continued as normal with irrigation in areas that received lesser amounts of rainfall. Peanut digging continued throughout the Florida Panhandle, but sporadic rain events delayed some harvesting as the peanuts will need to dry out. Due to wet conditions, a few peanut producers continue to battle leaf spot and white mold. Frequent rain events prevented some producers from cutting and harvesting hay in Georgia. The increase in rain, paired with high humidity, slowed the drying down of corn, and many farmers were battling with whiteflies and boll rot in cotton, and white mold in peanuts. A few counties in Alabama are in need of sunshine and dry weather for the corn harvest to start. Meanwhile, producers were reporting fall army worms in several pastures and hayfields recovering from dry conditions. In some South Carolina counties, growers were continuing to see a fair amount of disease from the recent wet conditions. Farmers also noticed caterpillar populations climbing on fall brassicas. However, cattle and pasture conditions were fairing well.
- For more information, please visit the Southeast Regional Climate Center Home Page.
High Plains Region (Information provided by the High Plains Regional Climate Center)
- Hot, dry conditions caused drought to expand and intensify across much of the High Plains. By the end of August, almost 50 percent of the region was experiencing drought (D1-D4). These conditions helped fuel several wildfires, especially across Colorado, Wyoming, and western areas of South Dakota and Nebraska. Fires affected many areas of Colorado, forcing evacuations, closing roads, and impacting air quality. One such fire was the Pine Gulch Fire, located north of Grand Junction, in the western part of the state. Triggered by lightning at the end of July, this fire grew to be Colorado’s largest fire in recorded history, surpassing the 2002 Hayman Fire, with over 139,000 acres burned. As of September 4th, according to InciWeb, the Pine Gulch Fire was 87 percent contained. These conditions have also continued to impact agriculture. According to the August 31 USDA Weekly Weather and Crop Bulletin, the percent of pastureland rated poor to very poor was 73 percent in Wyoming and 57 percent in Colorado. Local reports indicated that some livestock producers were having to haul water and provide supplemental feed. Some producers were selling calves early as well. Crops were also impacted, particularly in Colorado, where 44 percent of corn was rated poor to very poor. However, corn and soybeans were faring well in the rest of the region. In fact, according to the USDA National Agricultural Statistics Service, soybean yields could hit record levels in Nebraska and South Dakota, while corn yields could set a new record in South Dakota. In addition to drought impacting the region this month, severe storms that initiated in the High Plains tracked eastward and caused significant damage in the Midwest. On the morning of the 10th, a cluster of storms that formed along the southeastern South Dakota-Nebraska border evolved into a derecho, causing substantial damage to cities, towns, farmland, and other infrastructure, especially in central Iowa. According to the Storm Prediction Center, the storm tracked about 770 miles from South Dakota to Ohio in just 14 hours. Damages were still being determined at the time of this writing.
- Temperatures varied across the High Plains in August. Across western portions of the region, in places such as Colorado, Wyoming, and the panhandle of Nebraska, temperature departures were generally 2.0-6.0 degrees F (1.1-3.3 degrees C) above normal, with some isolated pockets up to 8.0 degrees F (4.4 degrees C) above normal. On the other side of the spectrum, temperature departures ranged from 2.0-4.0 degrees F (1.1-2.2 degrees C) below normal in southern and eastern Kansas. Elsewhere across the region, temperatures were generally near normal. There were many locations that ranked in the top 10 warmest Augusts on record. Some of those locations included: Cheyenne, WY (warmest); Denver, CO (warmest); Rawlins, WY (2nd warmest); Colorado Springs, CO (2nd warmest); and Chadron, NE (3rd warmest). In addition to it being the warmest August on record, Denver, CO experienced other temperature records this month. According to the National Weather Service, Denver experienced 26 days at or above 90.0 degrees F (32.2 degrees C), and 17 days at or above 95.0 degrees F (35.0 degrees C), both of which were records for August. By the end of August, this brought the year-to-date number of days at or above 90.0 degrees F (32.2 degrees C) to 68 for Denver, which is just shy of the annual record of 73 days that occurred in 2012 (period of record 1872-2020). For the summer season, Cheyenne, WY observed its warmest summer on record, with an average temperature of 69.9 degrees F (21.1 degrees C). This new record just slipped by the previous record, which occurred in 2012 with an average temperature of 69.8 degrees F (21.0 degrees C) (period of record 1872-2020).
- August was a dry month for much of the High Plains. The majority of the region had below-normal precipitation, with only a few isolated areas observing above-normal precipitation. The driest areas of the region, which were portions of Colorado, Wyoming, and Nebraska, received less than 25 percent of normal precipitation. A few isolated areas received less than 2 percent of normal precipitation. These conditions, combined with above-normal temperatures, led to further development and intensification of drought conditions in these areas. In fact, by the end of August, over 98 percent of Colorado, and nearly three-quarters of Wyoming, were experiencing drought. Additionally, many locations ranked in the top 10 driest Augusts on record. Some of those locations included: Scottsbluff, NE (2nd driest); Rawlins, WY (2nd driest); Grand Island, NE (3rd driest); Cheyenne, WY (4th driest); and Alamosa, CO (6th driest). There were also several locations that ranked in the top 10 driest summers on record, including Casper, WY (driest); Rawlins, WY (driest); Scottsbluff, NE (3rd driest); Omaha, NE (4th driest); and Lander, WY (7th driest). Casper, WY received only 0.37 inches (9 mm), which broke the previous record of 0.39 inches (10 mm) in the summer of 1971 (period of record 1939-2020). Meanwhile, Rawlins, WY only picked up 0.18 inches (5 mm), which broke the previous record of 0.33 inches (8 mm) in the summer of 2016 (period of record 1951-2020). Although many locations were dry, there were a few spots in the High Plains region that did receive above-normal precipitation in August. These areas were primarily confined to portions of North Dakota and South Dakota, with precipitation amounts of 125-150 percent of normal. However, precipitation was at least 200 percent of normal in southeastern North Dakota. An isolated area of west-central Kansas also had above-normal precipitation, with totals up to about 150 percent of normal. While it did not improve drought conditions, this precipitation did help prevent further degradations in this area. Although August was not particularly wet for most locations, it was a wet summer, overall, for Grand Forks, ND. This location had its 7th wettest summer on record, picking up 15.01 inches (381 mm) of precipitation, the majority of which fell during June and July. The wettest summer took place in 1944, when Grand Forks received 18.84 inches (479 mm) of precipitation (period of record 1893-2020).
- This month, drought conditions expanded and intensified in portions of the High Plains, but there were other parts of the region that experienced improvements. According to the U.S. Drought Monitor, the area experiencing drought (D1-D4) in the region increased by approximately 7.5 percent between July 28th and August 25th. A continuation of below-normal precipitation and above-normal temperatures in portions of Colorado, Wyoming, Nebraska, and the Dakotas led to worsening conditions in these areas. Exceptional drought conditions (D4) developed in a small area of eastern Colorado. Extreme drought conditions (D3) persisted over parts of north-central Wyoming throughout the month, with D3 conditions expanding across western Colorado. Severe drought (D2) was also introduced across central North Dakota and portions of Nebraska. D2 conditions also expanded across much of Colorado and southern Wyoming. Areas of moderate drought (D1) conditions were introduced to northwestern North Dakota and increased in coverage in portions of South Dakota and Wyoming. Abnormally dry conditions (D0) increased in coverage across portions of the High Plains region, including areas of Wyoming, Nebraska, North Dakota, and South Dakota. Across Kansas, D2 conditions remained the same, however there were some improvements as D0 and D1 conditions both decreased in coverage from late July to the end of August.
- According to the USGS WaterWatch, streamflows continued to vary across the region. Not surprisingly, areas of Colorado, southwestern Nebraska, and southern and western Wyoming had many locations where streamflows were below normal to much below normal. As drought conditions developed and/or persisted in these areas this summer, reservoirs, lakes, and ponds were also beginning to be impacted. For example, on August 24th, an emergency fish salvage began at the Jumbo Reservoir near Julesburg, Colorado, as the combination of drought and increased irrigation were expected to lower reservoir levels to a point that would endanger the entire fish stock. Meanwhile, above-normal to much above-normal streamflows were prevalent across northeastern Kansas, northern Nebraska, and eastern portions of the Dakotas.
- For more information, please visit the High Plains Regional Climate Center Home Page.
Southern Region (Information provided by the Southern Regional Climate Center)
- Temperatures for the month of August varied spatially across the Southern Region. Parts of northern and eastern Oklahoma, western and northern Arkansas, extreme northeastern Texas, and northwestern Tennessee experienced temperatures 2 to 4 degrees F (1.11 to 2.22 degrees C) below normal, while parts of central and western Tennessee, northern and central Louisiana, southern and eastern Texas, northern, central, and western Mississippi, and most of Oklahoma and Arkansas experienced temperatures 0 to 2 degrees F (0.00 to 1.11 degrees C) below normal. Conversely, parts of eastern and central Tennessee, eastern and southern Mississippi, western Oklahoma, southeastern, southern, and western Louisiana, and northern, eastern, and southern Texas experienced temperatures 0 to 2 degrees F (0.00 to 1.11 degrees C) above normal. Parts of southeastern Louisiana as well as southeastern, central, northern, and western Texas experienced temperatures 2 to 4 degrees F (1.11 to 2.22 degrees C) above normal. Parts of central, northern, and western Texas experienced temperatures 4 to 6 degrees F (2.22 to 3.33 degrees C) above normal, while parts of western Texas experienced temperatures 6 to 8 degrees F (3.33 to 4.44 degrees C) above normal. The statewide monthly average temperatures were as follows: Arkansas – 77.80 degrees F (25.44 degrees C), Louisiana – 82.30 degrees F (27.94 degrees C), Mississippi – 80.50 degrees F (26.94 degrees C), Oklahoma – 79.40 degrees F (26.33 degrees C), Tennessee – 76.40 degrees F (24.67 degrees C), and Texas – 84.30 degrees F (29.06 degrees C). The statewide temperature rankings for August were as follows: Arkansas (thirty-first coldest), Louisiana (fortieth warmest), Mississippi (fifty-second warmest), Oklahoma (thirty-fourth coldest), Tennessee (fifty-sixth warmest), and Texas (eleventh warmest). The region as a whole experienced its sixty-first warmest August on record. All state rankings are based on the period spanning 1895-2020.
- Precipitation values for the month of August varied spatially across the Southern Region. Parts of northeastern, western, and southwestern Oklahoma as well as northern, eastern, central, southern, and western Texas received 50 percent or less of normal precipitation. Parts of northern, central, southern, and western Texas received 25 percent or less of normal precipitation, while parts of central and western Texas received 2 percent or less of normal precipitation. In contrast, parts of western and south-central Louisiana, southwestern and northeastern Mississippi, eastern and northeastern Texas, southeastern Oklahoma, and most of Tennessee and Arkansas received 150 percent or more of normal precipitation. Parts of northeastern Mississippi, northwestern Louisiana, eastern and northeastern Texas, southeastern Oklahoma, and eastern, central, and western Arkansas received precipitation 200 percent or more of normal, while parts of western Arkansas and eastern Oklahoma received precipitation 400 percent or more of normal. The statewide precipitation totals for the month were as follows: Arkansas – 6.60 inches (167.64 mm), Louisiana – 5.42 inches (137.67 mm), Mississippi – 4.51 inches (114.55 mm), Oklahoma – 2.74 inches (69.60 mm), Tennessee – 5.43 inches (137.92 mm), and Texas – 1.25 inches (31.75 mm). The state precipitation rankings for August were as follows: Arkansas (seventh wettest), Louisiana (fortieth wettest), Mississippi (forty-second wettest), Oklahoma (sixty-first driest), Tennessee (fifteenth wettest), and Texas (eighteenth driest). The region as a whole experienced its twenty-ninth wettest August on record. All state rankings are based on the period spanning 1895-2020. Drought and Severe Weather:
- At the end of August, drought conditions both improved and deteriorated across the Southern Region. Exceptional drought conditions developed across western Texas. Extreme drought conditions persisted across southwestern Oklahoma and northern Texas, with new areas developing or expanding across northern and western Texas; however, the area of extreme drought in northwestern Oklahoma was removed. Severe drought classifications developed or expanded across southwestern and northwestern Oklahoma as well as northern, central, eastern, and western Texas. Moderate drought classifications decreased across northeastern Oklahoma and were eliminated in western Tennessee, but moderate drought conditions developed or expanded across western Oklahoma, northern, central, western, and eastern Texas, and northeastern Arkansas. There was a decrease in the overall area experiencing abnormally dry conditions, with conditions eliminated across eastern Tennessee, northwestern Arkansas, and northeastern Oklahoma. However, abnormally dry conditions persisted or expanded across parts of northeastern Arkansas, western Tennessee, northwestern and southwestern Mississippi, south-central Louisiana, northern, western, and southeastern Oklahoma, and south-central, eastern, and northern Texas.
- In August, there were approximately 368 storm reports across Texas, Oklahoma, Arkansas, Tennessee, Louisiana, and Mississippi. There were 11 tornado reports, 60 hail reports, and 297 wind reports. Arkansas tallied the most tornado reports (4), Oklahoma tallied the most hail reports (28), and Texas tallied the most wind reports (126). Texas tallied the most reports (155) while Louisiana tallied the fewest (18). Every state except for Oklahoma recorded at least 1 tornado report, while every state except for Tennessee recorded at least 1 hail report.
- Two tropical cyclones impacted the Southern Region in August. Hurricane Marco made landfall as a tropical storm on August 24, 2020 at the mouth of the Mississippi River in southeastern Louisiana. Three days later on August 27, 2020, Hurricane Laura made landfall in southwestern Louisiana as a strong Category 4 hurricane. Both Laura and Marco became the earliest L and M-named storms on record. While Marco’s impacts on the region were minimal, Laura was the second-strongest landfall in Louisiana on record by wind speed and the fourth-strongest landfall in Louisiana on record by minimum central pressure. Preliminary reports indicate 10 – 15 inches (254 – 381 mm) of rain fell in parts of Louisiana and Texas, while a peak wind gust of 133 mph (214.04 kph) was reported near Lake Charles, Louisiana. Additionally, a peak storm surge of approximately 17 feet (5.18 meters) was reported at Mermentau River, Louisiana.
- On August 1, 2020, a tornado was reported near Fincastle, Texas. Additionally, wind gusts of 60 mph (96.56 kph) were reported near Coahoma, Texas and Fort Cobb, Oklahoma.
- On August 2, 2020, hail larger than golf balls was reported near Glade, Mississippi. Additionally, a wind gust of 98 mph (157.72 kph) was reported near White River Lake, Texas, while a wind gust of 76 mph (122.31 kph) was reported near Victoria, Texas. Also, a wind gust of 73 mph (117.48 kph) was reported near Marrero, Louisiana.
- On August 6, 2020, a wind gust of 73 mph (117.48 kph) was reported near Stinnett, Texas.
- On August 10, 2020, there were approximately 33 wind reports across Oklahoma, Tennessee, and Texas. A wind gust of 73 mph (117.48 kph) was reported near Silverton, Texas, while a wind gust of 72 mph (115.87 kph) was reported near Camargo, Oklahoma.
- On August 11, 2020, a wind gust of 62 mph (99.78 kph) was reported near Plainview, Texas.
- On August 12, 2020, a wind gust of 67 mph (107.83 kph) was reported near Palo Duro, Texas, while a wind gust of 63 mph (101.39 kph) was reported near Tulsa, Oklahoma.
- On August 13, 2020, a wind gust of 70 mph (112.65 kph) was reported in Fort Smith, Arkansas.
- On August 14, 2020, a wind gust of 67 mph (107.83 kph) was reported near Palo Duro Reservoir, Texas, while a wind gust of 65 mph (104.61 kph) was reported near Goodwell, Oklahoma.
- On August 15, 2020, baseball-sized hail was reported near Vinita, Oklahoma. Additionally, a wind gust of 73 mph (117.48 kph) was reported near Avant, Oklahoma, while wind gusts of 63 mph (101.39 kph) were reported near Bogalusa, Louisiana and Gulfport, Mississippi.
- On August 16, 2020, an EF-1 tornado was reported near Mobeetie, Texas. There were approximately 81 wind reports across Louisiana, Mississippi, Oklahoma, and Texas, 25 of which were measured in excess of 60 mph (96.56 kph). A wind gust of 86 mph (138.40 kph) was reported near Seymour, Texas, while a wind gust of 80 mph (128.75 kph) was reported near Burneyville, Oklahoma. Additionally, a wind gust of 64 mph (103.00 kph) was reported at the Lakefront Airport in New Orleans, Louisiana.
- On August 17, 2020, a wind gust of 100 mph (160.93 kph) was reported near Van Horn, Texas.
- On August 18, 2020, a wind gust of 65 mph (104.61 kph) was reported near Cross, Texas.
- On August 21, 2020, wind gusts of 86 mph (138.40 kph) and 85 mph (136.79 kph) were reported at two separate weather stations near San Angelo, Texas.
- On August 26, 2020, two tornadoes were reported in southern Louisiana, one near Paincourtville and the other near Lake Arthur.
- On August 27, 2020, five tornadoes were reported in Arkansas (4) and Mississippi (1).
- On August 28, 2020, two tornadoes were reported in Tennessee, one near Viola and the other near Baxter.
- On August 29, 2020, there were 41 wind reports across Arkansas, Oklahoma, Tennessee, and Texas. Wind gusts of 70 mph (112.65 kph) were reported near Amarillo, Texas and Henrietta, Texas. Additionally, a wind gust of 68 mph (109.44 kph) was reported near Grandfield, Oklahoma. Lime-sized hail was reported near Amarillo, Texas.
- On August 31, 2020, lime-sized hail was reported near the towns of Tryon, El Reno, and Norman, Oklahoma. A wind gust of 75 mph (120.70 kph) was reported near Pawnee, Oklahoma, while a wind gust of 68 mph (109.44 kph) was reported near Colorado City, Texas.
- For more information, please visit the Southern Regional Climate Center Home Page.
Western Region (Information provided by the Western Region Climate Center)
- Across much of the West, extremely hot and dry conditions prevailed during August with scores of daily minimum and maximum temperature records broken across the region—including a scorching 130°F (54.4°C) observed at Furnace Creek in Death Valley, CA. If verified, the observation would represent the third hottest temperature ever recorded. In terms of average temperatures for the month, temperatures falling within the top-10th percentile warmest or record warmest were observed across the Four Corners states, California, Nevada, as well as areas of Idaho, Montana, and Wyoming. In addition to the prolonged heatwave, wildland firefighters struggled to contain numerous large wildfires in northern California and western Colorado. Precipitation for the month was below normal across most of the West, particularly in the Four Corners states where monsoon rainfall accumulations for the summer were generally less than half of normal. By the end of August, 67% of the West was experiencing drought according to the U.S. Drought Monitor—with the Four Corners states experiencing the most severe drought conditions including impacts within the agricultural and water resources sectors.
- Extreme heat, rolling blackouts, severe thunderstorms, wildfires, mandatory evacuations, and dense smoke were the dominant storyline in California during August. For August, the Sacramento Executive Airport broke records (dating back to 1941) for its highest average temperature (79.5°F; 26.4°C) and its highest average minimum temperature (63.4°F; 17.4°C). Further south in the Mojave Desert, Barstow broke records (dating back to 1943) for its highest average maximum temperature (108.3°F; 42.4°C) and its highest average temperature (92.3°F; 33.5°C). In mid-August, a rare, intense dry thunderstorm event (associated with remnant moisture from Post-Tropical Storm Elida) impacted central and northern California—including the southern San Francisco Bay Area where lightning ignited fires in the Santa Cruz Mountains. During a three-day period (8/16–19), 8,532 lightning strikes were detected—igniting 362 new fires in central/northern California, according to Predictive Services California (Northern Operations). The ensuing complex of lighting-ignited fires spread very rapidly because of the dry vegetation and strong, gusty winds associated with the storms including a 68-mph gust reported at the Atlas Peak RAWS fire-weather station in the foothills of Napa Valley, CA adjacent to the LNU Lightning Complex fire.
- In the Pacific Northwest, most of the region experienced below-normal precipitation for August with the exception of areas on the Olympic Peninsula including Quillayute, WA, that observed 4.2 in (107 mm; 169% of normal) of rain for the month. Elsewhere in the region, some isolated shower and thunderstorm activity was observed in portions of Idaho and Oregon, but accumulations for the month were generally less than 0.5 in (13 mm). Average temperatures were above normal across most of the region with areas in southeastern Oregon as well as southern/central Idaho experiencing temperatures that either broke records for the month or fell within the top-10th percentile warmest on record. Additionally, numerous daily high temperature records were broken in August including in Boise, ID—reaching 103°F (39.4°C) on August 16 and in Stanley, ID (6,249ft; 1905m) on August 1 that soared to 92°F (33.3°C).
- In the Four Corners states, the continued weak monsoon and record-breaking heat led to further intensification of drought conditions regionally. In Arizona, both Phoenix and Tucson broke records for the highest average maximum temperature for the month with Phoenix logging an average high temperature of 110.7°F (4.7°C) and Tucson at 105.2°F (40.7°C). In western Colorado, large wildfires scorched more than 200,000 acres including the Pine Gulch Fire that became the largest wildfire in the state’s history—burning nearly 150,000 acres by the end of August. In New Mexico, the state’s largest reservoir, Elephant Butte, dipped well below normal levels at 9% of normal compared to 39% of normal at the same time last year.
- In Alaska, warmer-than-normal temperatures prevailed across much of the state during August with the greatest departures observed along the North Slope, central Interior, and the Pribilof Islands. On St. Paul Island, the airport reported an average temperature for August of 53°F (11.7°C), a +5.8°F (+2.3°C) departure from normal. Precipitation for the month was well above normal in the eastern Interior and Panhandle where Ketchikan observed an impressive 22.85 in (580 mm; 233% of normal). On Kodiak Island, dry conditions continued with the January-August period being the 7th driest on record. In the Aleutian Islands, the city of Unalaska observed 120-mph wind gusts and damage during an intense and unusual summer storm event.
- In the Hawaiian Islands, average temperatures were near to slightly above normal for August while precipitation was below normal across the entire island chain. On the windward side of Big Island, Hilo International AP reported 4.25 in of rain (108 mm; 43% of normal) while Kona International AP on the leeward side reported 0.53 in (13 mm; 38% of normal). On Maui, Kahului AP logged 0.03 in (0.8 mm; 6% of normal) for August and broke daily high- temperature records on August 11, 26, 28—all of 94°F (34.4°C). Significant Events for August 2020
- Massive wildfire outbreak in California:According to the National Interagency Coordination Center (Sept 1), a cumulative 1,370,707 acres burned in the Northern California geographic area with more than 13,000 firefighters and support personnel deployed to the region.
- Weak monsoon season in the Four Corners states: Numerous locations observed their top-five driest July through August period on record including Boulder, CO (4th); Grand Junction, CO (1st); Pueblo, CO (4th); Farmington, NM (4th); Flagstaff, AZ (4th); and Tucson, AZ (4th).
- For more information, please go to the Western Regional Climate Center Home Page.