National Overview

May Highlights

May Temperature
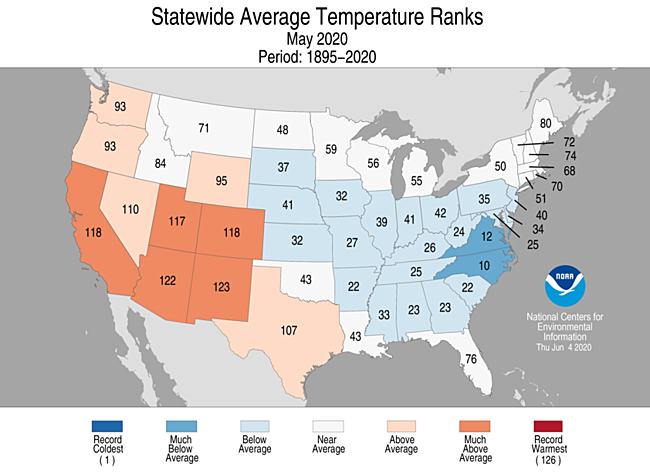
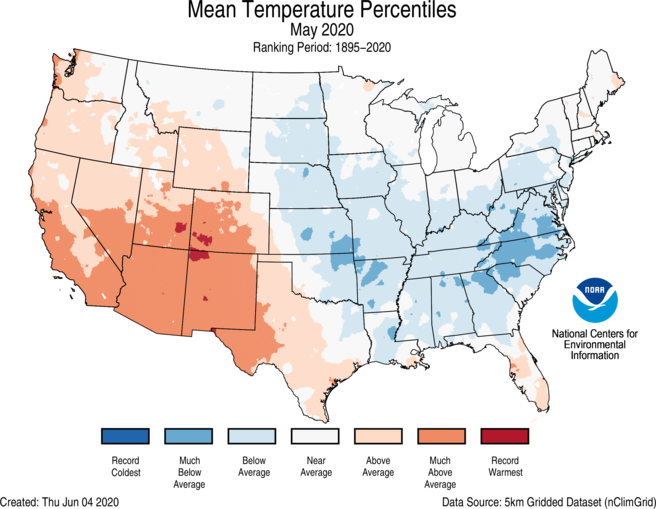
- The average contiguous U.S. temperature during May was 60.8°F, 0.6°F above the 20th century average and ranked in the middle third of the 126-year period of record.
- A ridge of high pressure over Alaska as well as the West Coast during May 6-14 and a trough over the East Coast were the primary drivers for the warm West, cold East pattern of temperatures observed during May.
- Below-average temperatures extended from the Plains to the East Coast. North Carolina had its coldest May since 2005 and ranked 10th coldest on record.
- Above-average May temperatures prevailed from the Pacific Northwest to Texas and across parts of Florida. New Mexico ranked fourth warmest while Arizona ranked fifth warmest.
- Portions of the Northeast experienced a wide range of temperatures during May as low temperatures in the teens and 20s near the beginning of the month gave way to high temperatures in the middle 90s by month’s end.
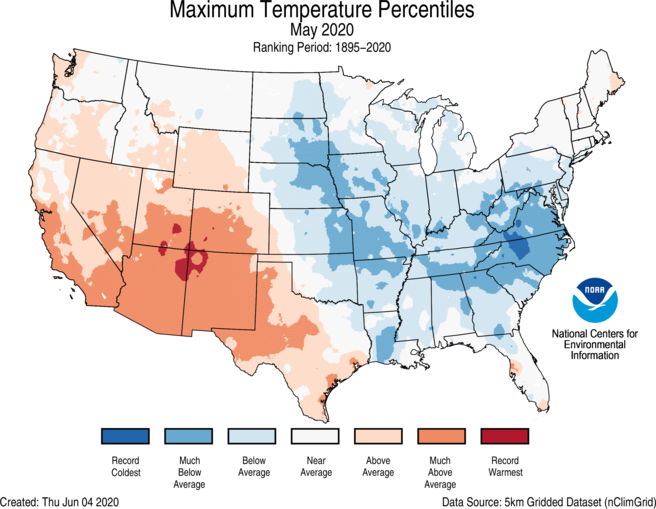
- The contiguous U.S. average maximum (daytime) temperature during May was 73.3°F, 0.4°F above the 20th century average, ranking in the middle one-third of the record. Above-average to record-warm maximum temperatures were observed from the West to the western Gulf Coast. Below-average daytime temperatures occurred from the central and northern Plains to the East Coast.
- The contiguous U.S. average minimum (nighttime) temperature during May was 48.3°F, 0.9°F above the 20th century average, ranking among the warmest one-third of the record. Above-average minimum temperatures were observed from the Rockies to the West Coast. Below-average minimum temperatures were observed across portions of the Plains, Southeast, and Mid-Atlantic.
- The Alaska average May temperature was 43.3°F, 5.5°F above the long-term mean and the fourth warmest May on record for the state.
- Bering Sea ice average extent during May was the highest since 2013, but only 71 percent of the 1981-2010 average.
- Widespread 8-10°F above-average temperatures were present along the Seward Peninsula.
- Nome, with one of the longest climate records in the state, experienced its warmest May on record, breaking the previous record set back in 1983 by nearly 2°F.
- May 2020 was second warmest at Bethel and third warmest at Northway.
- Based on data records as of June 8, there were 3,469 record warm daily high (1,428) and low (2,041) temperature records during May, which is nearly a one-to-one ratio with the 3,429 record cold daily high (1,740) and low (1,689) temperature records.
- Based on NOAA's Residential Energy Demand Temperature Index (REDTI), the contiguous U.S. temperature-related energy demand during May was 124 percent of average and the 40th highest value in the 126-year period of record.
May Precipitation
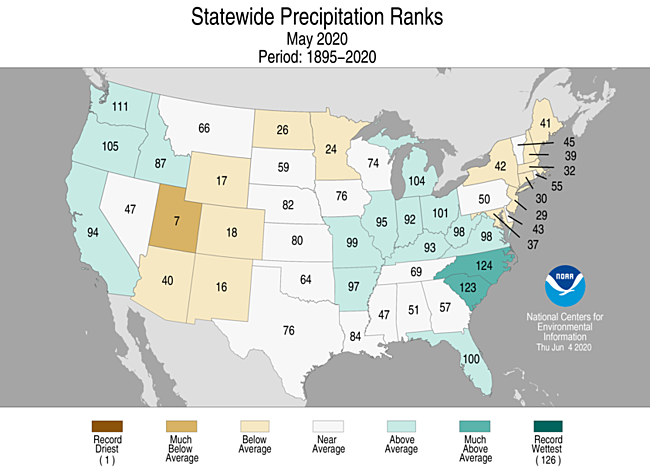
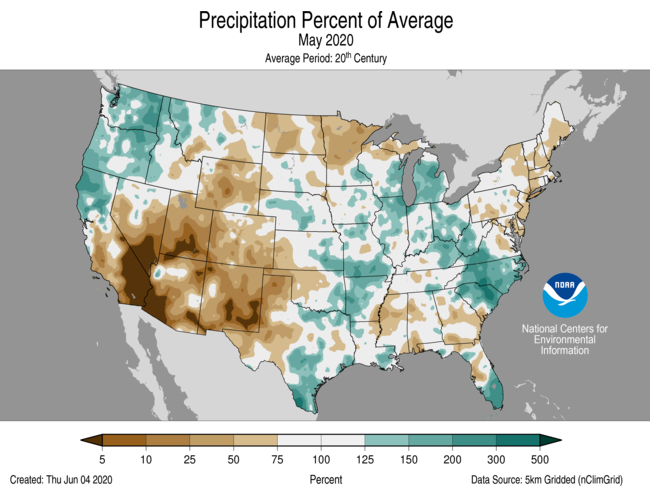
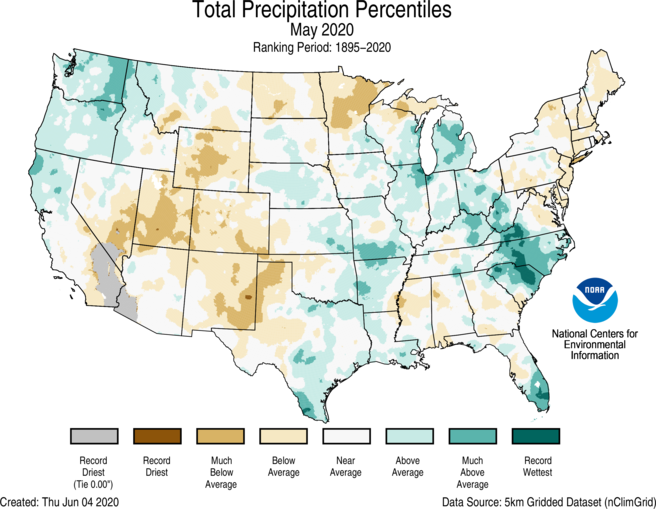
- The May precipitation total for the contiguous U.S. was 3.04 inches, 0.13 inch above average and ranked in the middle one-third of the historical period of record.
- Above-average precipitation was observed across the Northwest and from parts of the western Gulf Coast to the Great Lakes and to the Carolinas. North Carolina ranked third wettest for May while South Carolina ranked fourth wettest on record.
- Below-average precipitation was observed across portions of the Southwest, Rockies, Northern Tier as well as parts of the Northeast and South. Utah ranked seventh driest during May.
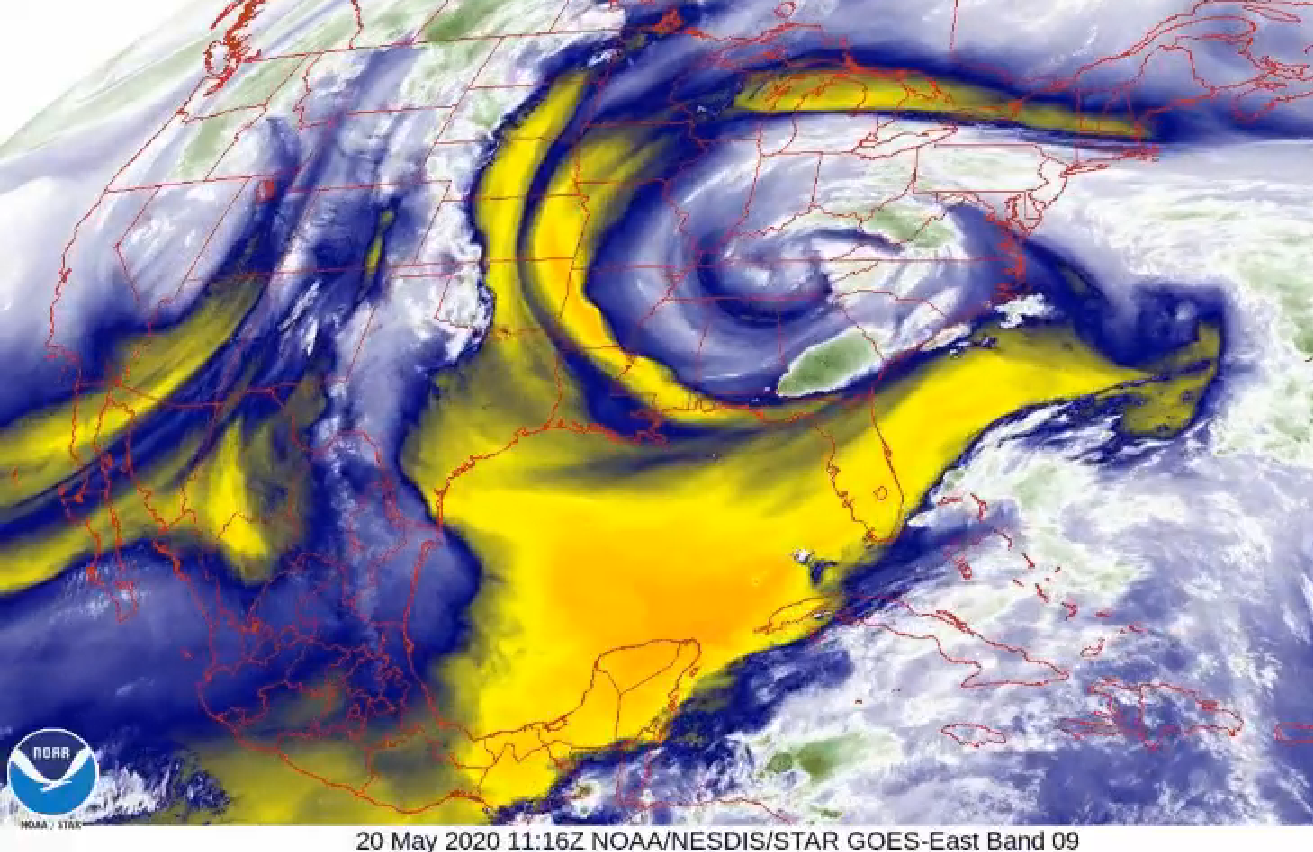
- Deep tropical moisture, advected from the Gulf of Mexico, brought heavy rainfall and flooding across parts of the Midwest and Southeast during May. A low-pressure system, cut off from the main flow of the jet stream, meandered from the Midwest to the Appalachians over the course of several days in mid-May.
- Chicago received 9.51 inches of precipitation during May — 250 percent of average for the month and the wettest May on record for the Windy City.
- On May 14, Chicago had its wettest May day on record, receiving 3.53 inches and breaking the previous record of 3.45 inches set on May 29, 1981.
- Since 1871, May rainfall exceeded 8 inches only three times — 2018, 2019 and now in 2020.
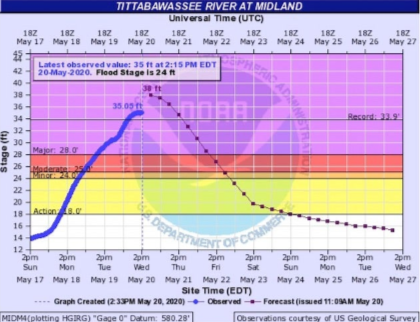
- Catastrophic failures at the Edenville and Sanford dams led to flash flooding along the entire Tittabawassee River near Midland, Michigan on May 19 following heavy rainfall received over the previous week. Approximately 10,000 residents were hastily evacuated as the river rose to record levels.
- As the cut-off low drifted towards the Southeast, steady rainfall from May 18-21 caused flooding from Ohio to the Carolinas.
- Widespread 4-8 inch rainfall totals on May 25-26 across southern Florida, associated with Tropical Storm Bertha, brought flooding to Miami and its suburbs.
- Miami reported 7.40 inches of rain on May 26 — the third largest 1-day May total for the city and the 10th largest 1-day total observed for any month on record.
- Miami had its wettest May on record with 18.89 inches, breaking the record of 18.54 inches from May 1968.
- A southward dip in the jet stream across the eastern U.S. during early May contributed to late-season snowfall. Pockets of 6 to 12 inches of snow fell from Vermont to Maine on May 8-9 and were accompanied by record-cold low temperatures across much of the East.
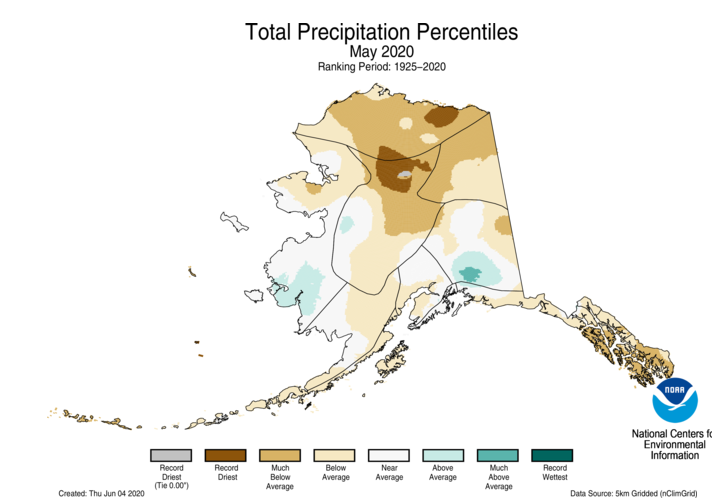
- Alaska ranked sixth driest on record for May. Much of the North Slope, Central Interior, Northeast Interior and the Panhandle regions had much-below- to record-low precipitation for the month.
- According to the June 2 U.S. Drought Monitor report, 19.9 percent of the contiguous U.S. was in drought, up 5 percent from the end of April. Drought intensified across the West, central Rockies and Plains and also developed across parts of Minnesota, North Dakota, Puerto Rico and Hawaii. Recent heavy rainfall helped improve drought conditions across Florida, Louisiana and Texas during May.
Other Notable Events
- May had the fewest number of severe weather reports since May 2014 as well as the fewest number of tornadoes and EF2+ tornadoes reported since at least 1970.
- Tropical storms Arthur and Bertha formed on May 16 and 27, respectively, which is a record sixth consecutive season for at least one named storm to form in the North Atlantic Basin before the official start of the hurricane season on June 1.
Spring Highlights

March-May Temperature
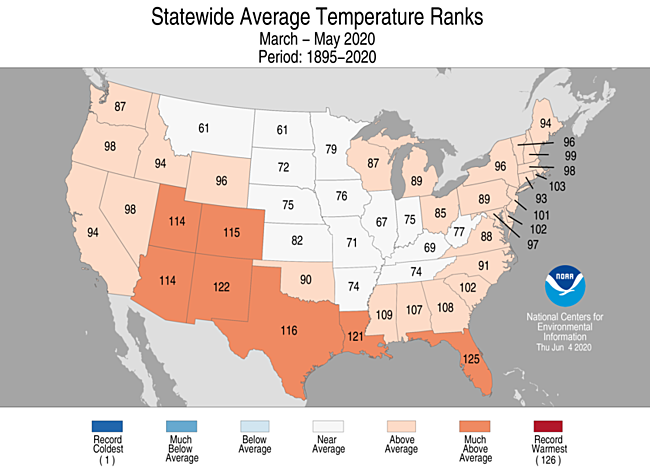
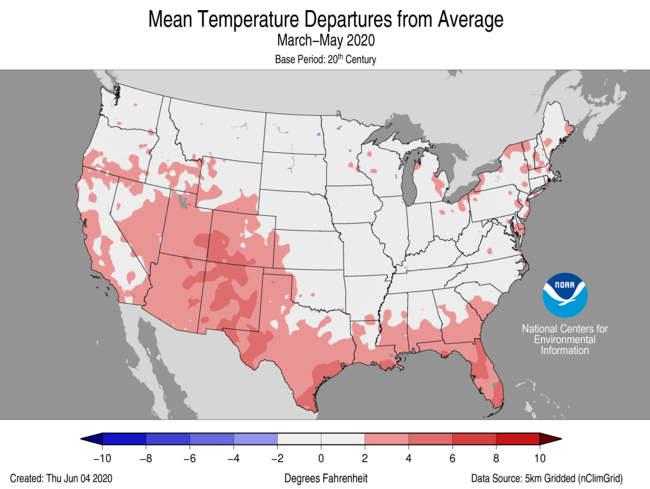
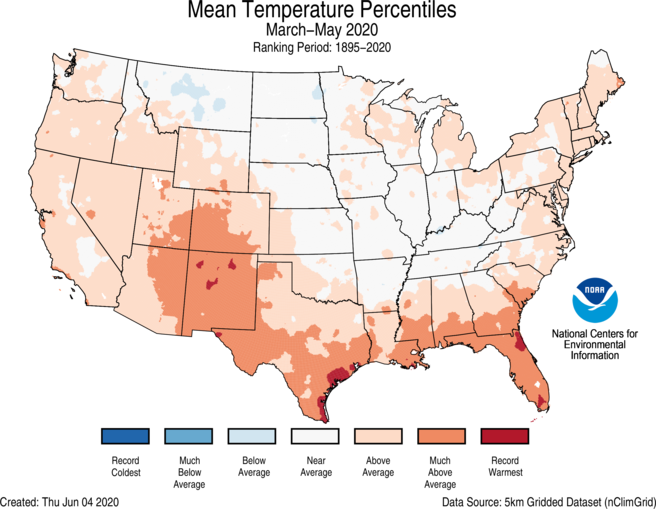
- The spring (March-May) average contiguous U.S. temperature was 52.6°F, 1.7°F above average and ranked in the warmest third of the record.
- Above- to much-above-average temperatures were observed from the West Coast to the Deep South, across the Southeast and into New England and the Great Lakes. Florida ranked second warmest for spring while New Mexico ranked fifth warmest and Louisiana sixth warmest. No state across the Lower 48 ranked below average for the season.
- The Alaska spring temperature was 27.5°F, 3.5°F above the long-term average, ranking in the warmest third of the record for the state. Much-above-average temperatures were observed across much of the Aleutians, West Coast and North Slope divisions while near-average temperatures occurred across most of the Southeast Interior and Panhandle divisions.
- The contiguous U.S. average maximum (daytime) temperature during March-May was 64.6°F, 1.4°F above the 20th century average, ranking among the warmest one-third of the record. Above-average conditions were observed across much of the West, Gulf Coast, and parts of the Northeast. Below-average daytime temperatures were seen across portions of the northern Plains, mid-Mississippi Valley, and the Appalachians.
- The contiguous U.S. average minimum (nighttime) temperature during March-May was 40.6F, 1.9°F above the 20th century average, ranking 13th warmest. Above-average temperatures were observed across most of the West, Southwest, South and from the Mississippi River to the East Coast. Only small areas of below-average nighttime temperatures can be seen in parts of the northern Rockies. New Mexico ranked warmest for overnight temperatures during spring.
- Based on REDTI, the contiguous U.S. temperature-related energy demand during the spring season was 52 percent of average and was the 14th lowest value on record.
March-May Precipitation

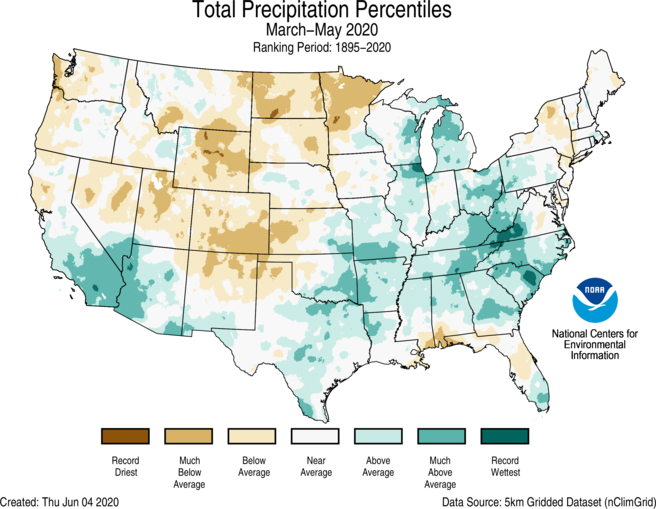
- The spring precipitation total was 8.40 inches, 0.46 inch above average, and ranked among the wettest one-third of the 126-year period of record.
- Above-average spring precipitation was observed across parts of the Southwest and from Texas to the Great Lakes and into the Southeast and Mid-Atlantic states. South Carolina ranked eighth wettest for the season.
- Below-average precipitation during March-May was observed across parts of the Pacific Coast, Northern Tier, central and southern Rockies and in parts of the Northeast and Gulf Coast. Colorado and North Dakota both ranked ninth driest for the spring season.
- Despite a dry May, Alaska had a relatively wet March and April. For the spring season, precipitation was above average across most of mainland Alaska and below average across the Aleutians, along the Gulf of Alaska coast and into the Panhandle.
- Kodiak had its driest spring since 1972.
Extremes
-
The U.S. Climate Extremes Index (USCEI) for the spring season was three percent above average and ranked in the middle third of the 111-year period of record. Despite the near-average national value, there were elevated extremes in the spatial extent of warm minimum temperatures as well as wet PDSI. The USCEI is an index that tracks extremes (falling in the upper or lower 10 percent of the record) in temperature, precipitation and drought across the contiguous United States.
- On the regional scale, the Central and Southeast regions had a CEI value that ranked in the top one-third for the season. The Central Region experienced elevated extremes in wet PDSI and days with precipitation while the Southeast Region was impacted by above-average extremes in both maximum and minimum temperatures, wet PDSI, and days with precipitation. In contrast, the West and Northwest had well-below-average extremes for the season. The Northwest had the second lowest extremes footprint on record — 1979 was lower. The West Region spring CEI was 10th lowest on record.
Year-to-Date Highlights
January-May Temperature
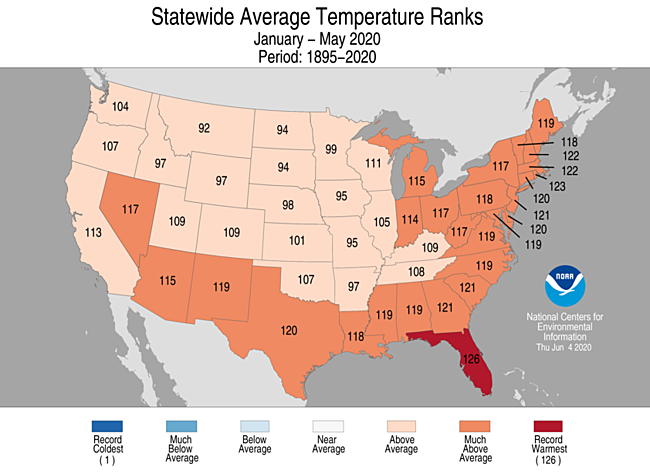
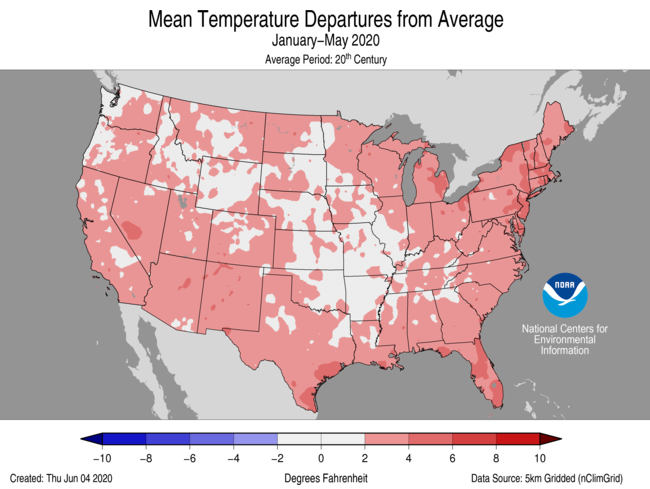
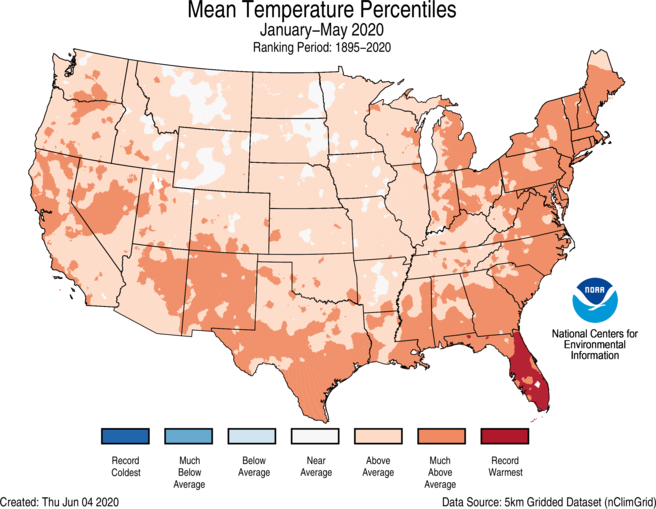
- The year-to-date (January-May) average contiguous U.S. temperature was 45.9°F, 2.6°F above average, ranking ninth warmest on record.
- Above-average to record-warm temperatures for the year-to-date period occurred across most of the contiguous U.S. Florida ranked warmest on record for the January-May period. Six additional states along the East Coast had a year-to-date temperature that ranked among the warmest six on record. No state ranked near- or below-average for this period.
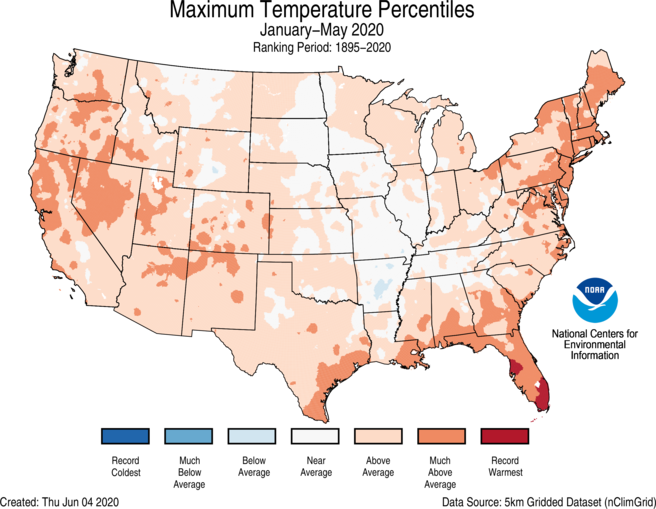
- The contiguous U.S. average maximum (daytime) temperature during January-May was 57.2°F, 2.2°F above the 20th century average, ranking in the warmest third of the historical record. Above-average conditions were observed across most of the Lower 48 with pockets of near-average temperatures across the Plains and mid-Mississippi River Valley. Florida ranked second warmest for daytime temperatures during this four-month period.
- The contiguous U.S. average minimum (nighttime) temperature during January-May was 34.6°F, 2.9°F above the 20th century average, ranking in the warmest one-third of the record. Above-average to record-warm conditions blanketed nearly the entire Lower 48. Florida again ranked second warmest on record with 16 additional states ranking in the top five.
- The Alaska year-to-date temperature was 15.6°F, 0.2°F below average, ranking near-average. Below-average temperatures were observed across parts of the interior regions as well as Cook Inlet. Above-average temperatures occurred across much of the Aleutians. When averaged over the first five months of the year, a large portion of Alaska experienced near-average temperatures.
- Based on REDTI, the contiguous U.S. temperature-related energy demand during January-May was 35 percent of average and was the sixth lowest value on record.
January-May Precipitation

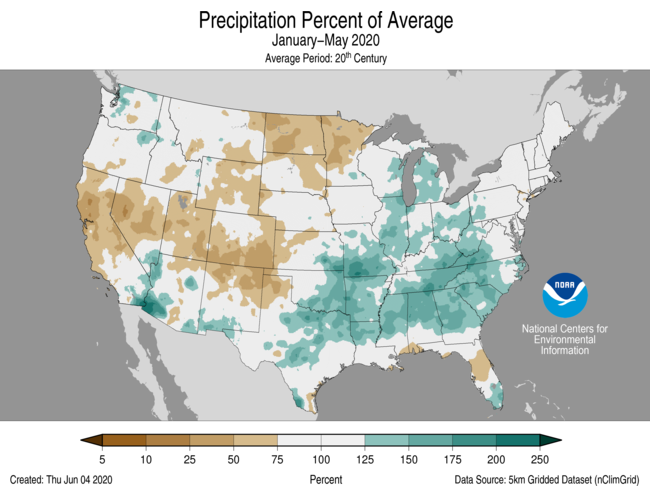
- The year-to-date national precipitation total was 13.60 inches, 1.21 inch above average, ranking in the wettest third of the January-May record.
- Above-average precipitation prevailed across much of the eastern half of the contiguous U.S. and in pockets of the Northwest and Southwest during the first five months of 2020. Tennessee ranked wettest on record while South Carolina and North Carolina ranked third wettest.
- Below-average precipitation for the year-to-date period occurred from northern California to the central Rockies and into the Northern Tier as well as across portions of the Northeast and Gulf Coast. North Dakota ranked sixth driest while Utah and Colorado ranked seventh and ninth driest, respectively.
Extremes
-
The U.S. Climate Extremes Index (USCEI) for the year-to-date period was 39 percent above average and ranked in the highest one-third of the 111-year period of record. Extremes in warm minimum temperatures, wet PDSI, and days with precipitation were the major contributors to this elevated CEI value. The USCEI is an index that tracks extremes (falling in the upper or lower 10 percent of the record) in temperature, precipitation and drought across the contiguous United States.
- On the regional scale, The Southeast ranked highest on record for this five-month period while the Central Region ranked third highest and the Northeast ranked fifth highest. Most of the elevated to record-levels in extremes were due to large regions of warm maximum and minimum temperatures, as well as wet PDSI and days with precipitation. In contast, the Northwest had below-average extremes for this year-to-date period ranking 12th lowest on record.
Regional Highlights
These regional summaries were provided by the six Regional Climate Centers and reflect conditions in their respective regions. These six regions differ spatially from the nine climatic regions of the National Centers for Environmental Information.
Please note: Due to a data access interruption during a server migration, the regional climate centers' analyses below were based on incomplete data available at the time. As a result, some of their statewide values may not exactly match what is reported in the report above, and associated tools.
Northeast Region (Information provided by the Northeast Regional Climate Center)
- May was another colder-than-normal month in the Northeast with an average temperature of 55.2 degrees F (12.9 degrees C), 1.1 degrees F (0.6 degrees C) below normal. Nine of the twelve Northeast states were colder than normal, with average temperatures ranging from 2.4 degrees F (1.3 degrees C) below normal in West Virginia to 0.4 degrees F (0.2 degrees C) above normal in New Hampshire. Four major climate sites recorded their coldest May temperature on record between May 8 and 10: Binghamton, New York; Harrisburg, Pennsylvania; Kennedy Airport, New York; and LaGuardia Airport, New York. Binghamton also tied its lowest maximum temperature for May with a high of 35 degrees F (2 degrees C). On May 26, Scranton, Pennsylvania, tied it hottest May day on record with a high of 93 degrees F (34 degrees C). The following day, on May 27, Burlington, Vermont, recorded its hottest May day on record with a high of 95 degrees F (35 degrees C), beating the old record of 93 degrees F (34 degrees C) from May 18, 2017, and May 22, 1977. The site also recorded its warmest minimum temperature for May with a low of 72 degrees F (22 degrees C) on May 27 and 28. The old record of 70 degrees F (21 degrees C) was recorded three times, most recently on May 18, 2017. Caribou, Maine, tied its warmest minimum temperature for May on May 29 with a low of 69 degrees F (21 degrees C). Spring averaged out to be 46.0 degrees F (7.8 degrees C), 0.5 degrees F (0.3 degrees C) warmer than normal. All twelve states were warmer than normal with average temperatures ranging from 0.2 degrees F (0.1 degrees C) above normal in Connecticut and West Virginia to 0.8 degrees F (0.4 degrees C) above normal in Delaware and New Hampshire.
- The Northeast experienced a drier-than-normal May, seeing 3.24 inches (82.30 mm) of precipitation, 80 percent of normal. Eleven of the twelve Northeast states were drier than normal with precipitation ranging from 63 percent of normal in Connecticut, Massachusetts, and New Jersey to 115 percent of normal in West Virginia. Charleston, West Virginia, had its wettest May on record with 8.93 inches (226.82 mm) of precipitation, beating the old record of 8.76 inches (222.50 mm) from May 2001. Spring was slightly drier than normal in the Northeast with 11.01 inches (279.65 mm) of precipitation, 98 percent of normal. Ten of the twelve states were drier than normal, with precipitation ranging from 84 percent of normal in New Jersey to 127 percent of normal in West Virginia, the state’s 11th wettest spring on record. Charleston, West Virginia, logged its wettest spring on record with 19.14 inches (486.16 mm) of precipitation, besting the old record of 18.75 inches (476.25 mm) set in May 1908.
- The Northeast started May free of abnormal dryness and drought but increasing precipitation deficits and below-normal streamflow led to the introduction of abnormal dryness in northern New York in mid-May and in western Maine and southern New Hampshire in late May. The U.S. Drought Monitor released on May 28 showed 5 percent of the Northeast as abnormally dry. Dry conditions in Maine during May contributed to an increased number of wildfires, including 50 during Memorial Day weekend. Maine has seen over 500 wildfires this year, more than the state saw in all of 2019. Ipswich and Georgetown, Massachusetts, enacted mandatory water restrictions effective June 1 due in part to below-normal precipitation and below-normal streamflow on the Ipswich and Parker Rivers.
- From May 8 to 11, the polar jet stream plunged south and Arctic air spilled into the Northeast. Low temperatures in the coldest locations ranged from 15 degrees F (-9 degrees C) to 30 degrees F (-1 degrees C), as much as 30 degrees F (17 degrees C) colder than normal. A few sites had their coldest May temperature on record, while several others ranked it among their ten coldest. High temperatures struggled to make it to 50 degrees F (10 degrees C) in the region on May 9 (and on May 11 in West Virginia), running as much as 30 degrees F (17 degrees C) below normal. Several sites ranked their high temperatures among their 10 coldest for May. The cold temperatures, in combination with strong winds, damaged vegetable crops in Delaware. Much of the region also saw some snowfall. Elkins, West Virginia, saw an inch of snow for only the second time in May. This made it the site’s snowiest May day and snowiest month of May on record. Concord, New Hampshire, saw measurable snow in May for the first time in over 50 years, while Burlington, Vermont, tied its third latest measurable snow on record. Other sites saw only a trace, but for Islip, New York, it made May a snowier month than February. In fact, according to the National Weather Service, it was the latest occurrence of snow on record for the New York City area climate sites, which saw a trace. A few sites in Pennsylvania including Philadelphia, Harrisburg, and Pittsburgh did not reach 80 degrees F (27 degrees C) until May 15 or 17, making it one of the ten latest dates on record. On May 15, severe thunderstorms in New York and New England produced an EF-1 tornado and straight-line winds of up to 100 mph (45 m/s), which downed trees, some of which fell on buildings and vehicles. Just over two weeks after experiencing record or near-record cold temperatures, portions of the region, particularly New York, New England, and northern Pennsylvania, experienced unusually mild temperatures from May 26 to 29. The warmest locations saw high temperatures ranging from 88 degrees F (31 degrees C) to 95 degrees F (35 degrees C), around 20 degrees F (11 degrees C) above normal. Several sites, including Burlington, Vermont; Erie, Pennsylvania; and Syracuse, New York, recorded one of their three hottest May days on record. It was the third earliest occurrence of a day above 90 degrees F (32 degrees C) in Buffalo, New York. In addition, low temperatures ranked among the ten warmest on record for May at sites such as Burlington, Vermont; Albany, New York; and Dulles Airport, Virginia. Three of the five warmest minimum temperatures on record for May at Caribou, Maine, occurred from May 27 to 29. Also of note, on May 28, Caribou recorded a dewpoint of 70 degrees F (21 degrees C) for the first time in May, according to the National Weather Service. An EF-1 tornado snapped and uprooted numerous trees in Warren County, New York, on May 29. Almost the entire Northeast saw below-normal snowfall during spring and the snow season (October through May). Seven major climate sites including Philadelphia, Pennsylvania; Baltimore, Maryland; and Atlantic City, New Jersey, tied their record for least snowy spring, while another 14 of the major climate sites ranked this spring among their 20 least snowy. It was only the second time since 1885 that Philadelphia recorded no snowfall during spring. Allentown, Pennsylvania, and Harrisburg, Pennsylvania, had their least snowy seasons on record, while another 20 major climate sites ranked this season among their 20 least snowy on record. Philadelphia and Washington, D.C., saw less than an inch of snow for the season for only the third time since 1885. The snowy exception was northern Maine, where Caribou recorded its 10th snowiest spring and its sixth snowiest season.
- For more information, please visit the Northeast Regional Climate Center Home Page.
Midwest Region (Information provided by the Midwest Regional Climate Center)
- May precipitation regionwide was 4.54 inches (115 mm), which was 0.34 inches (9 mm) above normal. The rainfall was between 75 and 125 percent of normal for more than half of the Midwest. There were drier areas with less than 75 percent of normal precipitation scattered across six states with the driest area in northern and central Minnesota where totals were less than half of normal. Wetter areas, with more than 125 percent of normal, were scattered across all nine states in the region. The wettest areas, with more than twice the normal precipitation, were located in southern Missouri, northeastern Illinois, and central Lower Michigan. Some of the heaviest rain fell from the 17th to the 19th of the month with some areas receiving over six inches (152 mm) in that 3-day span. Spring precipitation was generally above normal except in the northwestern quarter of the region. For the region, precipitation of 11.22 inches (285 mm) was 1.16 inches (29 mm) above normal. Statewide totals ranged from the 16th driest spring in Minnesota to the 10th wettest spring in Ohio.
- May temperatures were cooler than normal for nearly all of the region. Temperatures averaged 57.8 degrees F (14.3 C), 1.6 degrees F (0.9 C) below normal. Some northern regions were near normal while some areas to the west and south were 2 to 4 degrees F (1 to 2 C) below normal. Very cold temperatures in the first half of the month were somewhat offset by warmer conditions later in the month. Temperatures dropped below freezing throughout the upper Midwest and Great Lakes, with areas as far south as Missouri receiving a freeze in early May. One of the coldest mornings was on May 9th, when temperatures dropped below 20 degrees F (-7 C) in northeastern Minnesota and Upper Michigan. More than 1,000 daily record low temperatures were tied or broken through mid-May across the region. Spring temperatures were very close to normal across nearly the entire Midwest. Warm conditions in March were almost exactly offset by the cooler conditions in April and May. Regional temperatures were just 0.3 degrees F (0.2 C) cooler than normal for the season.
- Significant rainfall in Lower Michigan led to a catastrophic dam breach near Midland, Michigan on May 19th. Heavy rain during the 3-day period from May 17th to 19th, along with structural deficiencies in the upstream Edenville Dam, led to a swell of water on the Tittabawassee River. A crest of over 35 feet (10.7 m) was recorded near Midland, breaking the previous record of 33.9 feet (10.3 m). The city of Midland reported that it evacuated nearly 11,000 residents in less than 12 hours with no loss of life.
- Cold temperatures from May 8th to 10th led to snowfall in the Great Lakes Region. Amounts over an inch (3 cm) fell in northern Minnesota, while lake-effect snow led to amounts over 2 inches (5 cm) in parts of Michigan. Light snow also fell along Lake Erie in Ohio.
- Farmers made the most of their days in the field, as planting was largely ahead of schedule across the Midwest according to USDA NASS. Weekly crop progress reports showed corn and soybean planting well above the 5-year average, especially in Iowa, where corn was 96 percent planted and soybeans were 86 percent planted in the May 17th report. As of the May 31st report, every state was at, or ahead of, the 5-year average for corn and soybeans with the exception of Kentucky corn.
- While abnormally dry conditions expanded in the Midwest in May, the region remained drought-free throughout the month. As of the May 26th U.S. Drought Monitor, the region had recorded 29 consecutive weeks without drought. This was the second longest period in the history of the U.S. Drought Monitor (2000-2020), where the longest period was 32 weeks from January 1st to August 6th, 2019. Since the beginning of 2019, 61 of 74 weeks were completely free of drought in the Midwest.
- Severe weather was less prevalent than usual in the Midwest in one of the historically most active months of the severe weather season. More than 600 reports of strong winds, large hail and tornadoes were reported across the region. This was less than half the number of reports across the region in 2019. Colder weather in the first half of May limited thunderstorm activity, and only 5 to 7 days during the month produced widespread severe weather. Tornado reports were also about a third of 2019’s May total. All of these tornadoes were reported as weak EF-0 or EF-1 tornadoes.
- For further details on the weather and climate events in the Midwest, see the weekly and monthly reports at the Midwest Climate Watch page.
Southeast Region (Information provided by the Southeast Regional Climate Center)
- Temperatures ranged from below average to average across much of the Southeast region during May, with near average temperatures observed across much of the Florida peninsula and above-average temperatures across Puerto Rico. Monthly mean temperatures were within 2 degrees F (1.1 degrees C) of normal for approximately 60 percent of the 201 long-term (i.e., period of record equaling or exceeding 50 years) stations across the region. There were 22 stations that observed monthly mean temperatures that were ranked within their five coldest values on record, including Stuart, VA (1913-2020; 3rd coldest). In contrast, San Juan, PR (1898-2020) observed its warmest May on record. Maximum temperatures ranged from 5 degrees F (2.7 degrees C) above normal in Aibonito, PR (1906-2020) to 8.3 degrees F (4.6 degrees C) below normal in Carlisle, SC (1893-2020). Daily temperature minimums ranged from 2.7 degrees F (1.5 degrees C) above normal in Clayton, AL (1928-2020) to 5.9 degrees F (3.3 degrees C) below normal in Fairhope, AL (1917-2020). The coldest weather of the month across the Southeast occurred on the 9th and 10th, as the circulation around a departing mid-latitude cyclone ushered in unseasonably cold, dry air from Canada. Daily minimum temperatures fell below 40 degrees F (4.4 degrees C) across portions of every state north of Florida. Mt. Mitchell, NC (1925-2020) reported the second coldest May minimum temperature on record at 14 degrees F (-10 degrees C). In contrast, the warmest weather of the month occurred from the 23rd through the 25th, as the circulation around the Bermuda High, situated off the Atlantic coast, transported warm, humid air over much of the Southeast region. Daily maximum temperatures exceeded 85 degrees F (29 degrees C) across much of the region, with portions of central Florida reaching 95 degrees F (35 degrees C) or higher.
- Precipitation varied across the region for May, with the driest locations found across much of Alabama, central Georgia, eastern Virginia, the panhandle of Florida, and Puerto Rico. Monthly precipitation totals ranged from 70 to less than 25 percent of normal across these locations. Indeed, St. Thomas, USVI (1953-2020) only observed a trace of precipitation, which was more than 3 inches (76 mm) below average, making this the driest May on record. In contrast, the wettest locations were located across western Virginia, most of North Carolina, South Carolina, and southeastern Florida. Precipitation totals ranged from 150 to 300 percent of normal. Ten long-term stations (i.e., period of record equaling or exceeding 50 years) observed their wettest May on record, including Miami, FL (1895-2020), which received 18.89 inches (480 mm) of precipitation, over 13 inches (330 mm) above normal. From the 19th through the 21st, a slow-moving upper-level low ushered in a deep stream of moisture from the southeast across southwestern Virginia, and the western Carolinas, with 72-hour precipitation totals exceeding 8 inches (203 mm) and numerous reports of localized flooding. Roanoke, VA (1912-2020) measured 8.32 inches (211 mm) of rain from May 19-21, their third heaviest three-day rainfall on record. Roanoke, VA also observed its longest streak of 3 consecutive days with at least 2 inches (51 mm) of precipitation. The Roanoke River crested almost 6 feet above flood stage on May 21, sending water rushing onto some roadways and deeming them impassable. Some residents in Roanoke were asked to evacuate due to concerns that the Spring Valley dam could fail. On the morning of May 18th, Tropical Storm Arthur, the first named storm of the 2020 hurricane season, made its closest approach to the Outer Banks of North Carolina. Carteret County, NC observed over 4 inches (102 mm) of rain from Arthur. On May 27th, Tropical Storm Bertha made landfall on the South Carolina coast, just east of Charleston. The system weakened rapidly and moved northwest through the region. The precursor disturbance to Bertha however, caused a significant, multi-day rainfall event across South Florida, with accumulations of more than 8 inches (203 mm) across several locations. On May 26th, Miami, FL (1895-2020) observed a 24-hour rainfall total of 7.4 inches (188 mm), making it the 3rd wettest May day on record. Blacksburg, VA (1953-2020) reported a trace of snow, only the 3rd time for the month of May since 1953.
- There were 310 reports of severe weather across the Southeast during May, which is 70 percent of the median monthly frequency of 440 reports during 2000-2018. There were 8 confirmed tornadoes reported for the month (2 EF-0, 5 EF-1, and 1 EF-2), a little less than the monthly average of 11. The strongest of these tornadoes occurred with a supercell thunderstorm that formed over Chester County, SC on May 5th. Maximum wind speed was estimated at 115 mph (51 m/s). This tornado produced significant tree damage, destroyed a house and a vehicle when trees fell on them. Fortunately, no injuries or fatalities were reported. Another tornado developed over the Miami Everglades RV Resort on May 25th, with winds reported at 90 mph (40 m/s). Several campers were tipped over and trees were damaged. No injuries were reported, however. There were 15 reports of hail for the month, with the largest being tea-cup sized (3.00 inches) in Lake Mary, FL. This is the 18th tea-cup or larger sized hail in the state since 1950, and only the 4th in the month of May. There were 222 wind reports for the month, which is less than the average (287 reports). Damaging straight line winds and associated gustnado was observed in Lancaster County, SC on May 5th, with the strongest reported gust at 105 mph (47 m/s). While much of the damage was based on straight line winds, there was evidence of an embedded gustnado based on the tree fall pattern. The damage was primarily to trees, with many uprooted and some snapped. No injuries or fatalities were reported. Unfortunately, there were 2 lightning deaths in the region for the month. The first was a 32-year old man, on May 5th in Chester County, SC. The second was a 41-year old man, on May 27th in Port St. Lucie, FL.
- Drought has improved across portions of Florida for the month of May. Moderate drought (D1) reduced in coverage across central Florida, but increased across the Florida Panhandle. Although the pocket of severe drought (D2) is gone in the southwestern part of the state, it has emerged in the panhandle. By the end of the month the pocket of moderate drought (D1) remains along the Gulf Coast of Alabama along with an emerging pocket of severe drought (D2). Abnormally dry conditions (D0) expanded in Puerto Rico, with an area of moderate drought (D1) developing in southern Puerto Rico. The dry conditions at the beginning of the month led to the outbreak of numerous wildfires across Florida. One of the largest fires burned over 8,600 acres in Collier County and forced a portion of I-75 to close. Multiple residences were destroyed from this fire, and many residents were told to evacuate the area. The lack of rainfall in the Panhandle of Florida lead to poor grazing conditions. However, excess rainfall in the southern peninsula caused minor flooding of pastures. Some watermelon producers reported downy mildew issues due to the rain. Citrus grove activities continued, as normal and beneficial rainfall was received throughout the region. The warm weather paired with scattered thunderstorms lead to the appearance of flies on cattle throughout the state of Georgia. Producers in the southern counties of Georgia reported concerns that increased moisture from the rainfall will lead to lower germination rates and increased risk for crop disease. dry conditions in Alabama enabled farmers to make good progress in planting cotton, peanuts, and soybeans. South Carolina reported water damage to some strawberry crops, as the heavy rainfall slowed fieldwork and caused minor flooding in some fields.
- For more information, please visit the Southeast Regional Climate Center Home Page.
High Plains Region (Information provided by the High Plains Regional Climate Center)
- There was a stark contrast in temperatures across the High Plains region this month, with the dividing line between above- and below-normal temperatures occurring roughly along a line from north-central Wyoming through southwestern Kansas. Temperatures in areas east of this line were largely below normal, with widespread temperature departures up to 4.0 degrees F (2.2 degrees C) below normal. Areas to the west, however, were quite warm, with temperature departures up to 6.0 degrees F (3.3 degrees C) above normal. In the warmer areas, some locations ranked in the top 10 warmest Mays on record. Meanwhile, much of the High Plains region was dry this month, which contributed to the development or expansion of abnormally dry and drought conditions in many areas. These dry conditions had mixed impacts across the region. Winter wheat conditions continued to decline in some areas, especially in eastern Colorado. According to the June 2nd USDA Weekly Weather and Crop Bulletin, 41 percent of Colorado’s winter wheat crop and 25 percent of Kansas’ winter wheat crop were rated poor to very poor. There have been reports of abandoned wheat fields in both states. Pastures and rangelands have also been impacted by the dry conditions. According to Grass-Cast, even if above-normal precipitation were to occur during the summer months, grassland production would still be below normal for the season in Colorado, eastern Wyoming, and portions of western Kansas. As for positive impacts, producers were able to make significant planting progress due to the dry conditions. In fact, at the end of May, corn planting was ahead of the 5-year average in Colorado, Kansas, Nebraska, and South Dakota. Planting progress was behind in North Dakota, however, largely due to wet soils and unharvested crops from 2019. Corn planting was 15 percent behind the 5-year average, while soybean planting was 29 percent behind the 5-year average in the state.
- Temperatures varied across the High Plains during the month of May, with below-normal temperatures across roughly the eastern half of the region, and above-normal temperatures across the western half. The dividing line between the above- and below-normal temperatures generally extended from north-central Wyoming through southwestern Kansas. Although temperature departures did reach upwards of 6.0 degrees F (3.3 degrees C) below normal in some isolated areas in the east, this was not enough for widespread records to occur. To the west, however, where temperature departures were up to 6.0 degrees F (3.3 degrees C) above normal, many locations ranked in the top 10 warmest Mays on record. One of these locations was Alamosa, CO, which is located in south-central Colorado, just to the southwest of the Great Sand Dunes National Park and Preserve. With an average temperature of 57.7 degrees F (14.3 degrees C), Alamosa had its warmest May on record. The previous record occurred in both May 1996 and May 1984 with an average monthly temperature of 55.2 degrees F (12.9 degrees C) (period of record 1906-present). Interestingly, only two days during the month of May 2020 were below normal in Alamosa - May 21st and May 25th. Other locations that ranked in the top 10 warmest Mays on record included Pueblo, CO (6th warmest); Colorado Springs, CO (9th warmest); and Grand Junction, CO (9th warmest). While Denver, CO did not rank in the top 10 warmest Mays, Denver did observe its first 90.0 degrees F (32.2 degrees C) day three weeks earlier than average.
- Overall, May was a dry month across the High Plains region, with only a few areas receiving near normal to above-normal precipitation. Much of Wyoming, southern and western Colorado, western Kansas, and western North Dakota had precipitation totals of less than 50 percent of normal, which contributed to the degradation of drought conditions in these areas. May precipitation deficits were in excess of 1.50 inches (38 mm) in parts of east-central Wyoming and southwestern North Dakota. The dry conditions led to several locations ranking in the top 10 driest Mays on record. For instance, Lander, WY, which has a period of record extending back to 1892, tied for its driest May on record with only 0.06 inches (2 mm) of precipitation. May is typically the wettest month of the year in Lander, so it will be difficult to overcome deficits in the short term. Other locations ranking in the top 10 included Casper, WY (driest); Pueblo, CO (5th driest); Grand Junction, CO (10th driest); and Sheridan, WY (10th driest). Although dry conditions were widespread, there were some areas that received above-normal precipitation, such as central and northern Nebraska, central South Dakota, and eastern Kansas. In these areas, precipitation totals were up to 200 percent of normal. One particularly wet location was Parsons, KS, which is located in the southeast corner of the state. The Parsons 2 NW COOP station received 12.66 inches (322 mm) of precipitation this month, which was 6.73 inches (171 mm) above normal, or 213 percent of normal precipitation. Although this was enough to rank as the 4th wettest May on record, last year’s record-setting amount of 19.27 inches (489 mm) firmly held (period of record 1925-present). A nearby Kansas Mesonet station, called Parsons, received slightly more precipitation, with 13.72 inches (348 mm). Interestingly, May was a quiet month for severe weather, not just for the High Plains region, but for the nation as a whole. According to the National Weather Service, 2020 was the first year in which the Storm Prediction Center did not issue a Day 1 outlook for a moderate or high risk for severe weather in the month of May (records extend back to 1995). May 2020 also yielded the fewest severe weather reports since 2014, nationally. Here in the High Plains region, there were 362 reports of high winds, large hail, and tornadoes this May, which was about half of the most recent 5-year average of 697 (2015-2019).
- This month, drought conditions continued to expand and intensify across portions of the High Plains region. According to the U.S. Drought Monitor, the area experiencing drought (D1-D4) in the region increased about 8 percent between April 28th and May 26th. This increase was due to the development and/or expansion of drought in Colorado, western Kansas, far southwestern Wyoming, and an area extending from west-central North Dakota into northern South Dakota. Across southern portions of the region, warm, dry conditions contributed to the expansion and intensification of drought across the southern half of Colorado and western Kansas. Drought now encompasses approximately 65 percent of Colorado and 27 percent of Kansas. The most dramatic change to occur during the month was the development of extreme drought (D3) conditions across portions of southwestern Kansas and southern and eastern Colorado. In some of these areas, burn bans are in effect and there have been reports of cattle sell-offs. In other areas of the region, there was a mix of degradations and improvements. For instance, a large area of abnormally dry conditions (D0) was removed from central South Dakota, but D0 expanded across portions of western and northern Wyoming. An area of D1 also developed in western North Dakota and northern South Dakota. Conditions will be monitored closely through the summer.
- At the beginning of June, snowpack was below normal for most basins in Colorado and Wyoming, with the exception of western Wyoming, where snowpack was near to above normal. Above-normal temperatures have contributed to increased runoff, with some areas experiencing much above normal or high streamflows for this time of the year. Just outside the High Plains region in Montana, for instance, unseasonably warm conditions have led to record or near-record flooding along some tributaries of the Missouri River. As of May 31st, mountain SWE was 84 percent of normal above Fort Peck and 83 percent of normal in the reach from Fort Peck to Garrison, according to the U.S. Army Corps of Engineers. Monthly streamflows were generally near to above normal across the region, with some exceptions in areas of western and southern Colorado and portions of the Republican River in Nebraska.
- For more information, please visit the High Plains Regional Climate Center Home Page.
Southern Region (Information provided by the Southern Regional Climate Center)
- Temperatures for the month of May exhibited a west-to-east pattern across the Southern Region, with above-normal temperatures in the west and below-normal temperatures in the east. Parts of northern and central Arkansas, central Louisiana, northern, central, and southern Mississippi, northeastern Oklahoma, and western, central, and eastern Tennessee experienced temperatures 2 to 4 degrees F (1.11 to 2.22 degrees C) below normal. Parts of eastern Texas as well as central and eastern Oklahoma, along with most of Arkansas, Louisiana, Mississippi, and Tennessee, experienced temperatures 0 to 2 degrees F (0.00 to 1.11 degrees C) below normal. Parts of southeastern Louisiana, southwestern and western Oklahoma, and southern, southeastern, central, western, and northern Texas experienced temperatures 0 to 2 degrees F (0.00 to 1.11 degrees C) above normal, while parts of extreme western Oklahoma as well as northern and western Texas experienced temperatures 2 to 4 degrees F (1.11 to 2.22 degrees C) above normal. The statewide monthly average temperatures were as follows: Arkansas – 66.60 degrees F (19.22 degrees C), Louisiana – 72.80 degrees F (22.67 degrees C), Mississippi – 70.00 degrees F (21.11 degrees C), Oklahoma – 67.10 degrees F (19.50 degrees C), Tennessee – 63.80 degrees F (17.67 degrees C), and Texas – 74.40 degrees F (23.56 degrees C). The statewide temperature rankings for May were as follows: Arkansas (twenty-second coldest), Louisiana (forty-fifth coldest), Mississippi (thirty-fifth coldest), Oklahoma (forty-third coldest), Tennessee (twenty-fifth coldest), and Texas (twenty-first warmest). The region as a whole experienced its forty-first coldest May on record. All state rankings are based on the period spanning 1895-2020.
- Precipitation values for the month of May varied spatially across the Southern Region. Parts of southeastern Arkansas, northeastern Louisiana, central Mississippi, western Oklahoma, and northern and western Texas received 50 percent or less of normal precipitation. Parts of extreme western Oklahoma as well as northern and western Texas received 25 percent or less of normal precipitation, while parts of western Texas received 5 percent or less of normal precipitation. In contrast, parts of northern and western Arkansas, northwestern and southeastern Louisiana, southern Mississippi, extreme eastern Tennessee, eastern and southwestern Oklahoma, and southern, north-central, and eastern Texas received 150 percent or more of normal precipitation. Parts of northern Arkansas, southeastern Louisiana, and southern Texas received precipitation 200 percent or more of normal, while parts of southern Texas received precipitation 300 percent or more of normal. The statewide precipitation totals for the month were as follows: Arkansas – 6.85 inches (173.99 mm), Louisiana – 5.71 inches (145.03 mm), Mississippi – 3.65 inches (92.71 mm), Oklahoma – 4.65 inches (118.11 mm), Tennessee – 4.50 inches (114.30 mm), and Texas – 3.50 inches (88.90 mm). The state precipitation rankings for May were as follows: Arkansas (thirtieth wettest), Louisiana (forty-third wettest), Mississippi (forty-seventh driest), Oklahoma (sixty-third wettest), Tennessee (fifty-eighth wettest), and Texas (fifty-first wettest). The region as a whole experienced its fifty-fourth wettest May on record. All state rankings are based on the period spanning 1895-2020.
Drought and Severe Weather
- At the end of May, drought conditions both improved and deteriorated across the Southern Region. Extreme drought conditions were no longer present across southern and southeastern Texas. Severe drought classifications improved across southern Texas and southeastern Louisiana, but extreme western Oklahoma experienced an expansion and severe drought conditions developed in southern Mississippi and northern Texas. Moderate drought classifications decreased across southern Texas and coastal Louisiana, but moderate drought conditions developed or expanded across western and northern Texas, western and north-central Oklahoma, and southern Mississippi. There was an increase in the overall area experiencing abnormally dry conditions, despite the improvement of abnormally dry conditions across southern Texas and southern Louisiana. This is because the area experiencing abnormally dry conditions increased across western Oklahoma, western and northern Texas, and southern Mississippi.
- In May, there were approximately 1,051 storm reports across Texas, Oklahoma, Arkansas, Tennessee, Louisiana, and Mississippi. There were 53 tornado reports, 446 hail reports, and 552 wind reports. Texas tallied the most tornado (22), hail (249), and wind (205) reports. Unsurprisingly, Texas tallied the most reports (476) while Louisiana tallied the fewest (57). Every state except for Mississippi reported tornadoes while Oklahoma and Texas both tallied more hail reports than wind reports.
- On May 2, 2020, a wind gust of 71 mph (114.26 kph) was reported near Fort Stockton, Texas.
- On May 3, 2020, there were 104 severe weather reports across Arkansas and Tennessee. One person was killed and three people were injured by trees felled by strong winds across Tennessee. Tennis ball-sized hail was reported near Mountain Home, Arkansas. A wind gust of 71 mph (114.26 kph) was reported near Nashboro Village, Tennessee, while wind gusts of 70 mph (112.65 kph) were reported near Lebanon, Tennessee and Dover, Tennessee.
- On May 4, 2020, there were 111 severe weather reports across Arkansas, Oklahoma, Tennessee, and Texas. One person was injured near Ridgely, Tennessee due to strong winds. An EF-0 tornado was reported near Winchester, Tennessee. There were several reports of large hail (greater than tea-cup size), with the largest report indicating softball-sized hail near Shady Grove, Arkansas. A wind gust of 72 mph (115.87 kph) was reported near Burneyville, Oklahoma, while wind gusts of 70 mph (112.65 kph) were reported near Dyersburg, Tennessee and Sanger, Texas.
- On May 5, 2020, an EF-1 tornado was reported near Ragley, Louisiana.
- On May 7, 2020, there were 106 severe weather reports across Arkansas, Louisiana, Oklahoma, and Texas. There were several reports across Texas and Oklahoma of hail baseball-sized or larger, with the largest report indicating hail slightly larger than teacups near Loco, Texas. A wind gust of 90 mph (144.84 kph) was reported near Wolf Creek Park, Texas, while a wind gust of 75 mph (120.70 kph) was reported near Lane, Oklahoma.
- On May 8, 2020, a tornado was reported near Mamou, Louisiana, while a wind gust of 63 mph (101.39 kph) was reported near Lake Charles, Louisiana.
- On May 11, 2020, tennis ball-sized hail was reported near Fort Stockton, Texas. Also, a wind gust of 68 mph (109.44 kph) was reported near Pampa, Texas.
- On May 12, 2020, there were three tornado reports in south-central Texas near the communities of Dale, Texas and Paige, Texas as well as near Buescher State Park, Texas.
- On May 13, 2020, a landspout tornado was reported near Coyanosa, Texas. Tennis ball-sized hail was reported near Gardendale, Texas. Additionally, there were wind gusts of 70 mph (112.65 kph) near Whitharral, Texas; Graham, Texas; and Mangum, Oklahoma.
- On May 14, 2020, tennis ball-sized hail was reported near Harmon, Oklahoma.
- On May 15, 2020, there were two tornado reports near Keefeton, Oklahoma and Davidson, Oklahoma as well as one tornado report near Mauriceville, Texas. Four people were injured near Owens, Texas due to strong winds. A wind gust of 76 mph (122.31 kph) was reported near Velma, Oklahoma.
- On May 16, 2020, there were 15 tornado reports across Arkansas (8), Texas (6), and Oklahoma (1). Additionally, a wind gust of 78 mph (125.53 kph) was reported at Realitos Peninsula, Texas.
- On May 17, 2020, there were seven tornado reports in Louisiana. One person was killed and 9 people were injured in Acadia Parish, Louisiana as a result of one of these tornadoes.
- On May 20, 2020, teacup-sized hail was reported near Broadview, Texas while baseball-sized hail was reported near Woodrow, Texas. Additionally, a wind gust of 65 mph (104.61 kph) was reported near Tankersley, Texas.
- On May 21, 2020, softball-sized hail was reported near San Angelo, Texas. Additionally, a wind gust of 81 mph (130.36 kph) was reported near Marshall, Oklahoma while a wind gust of 73 mph (117.48 kph) was reported near Lahoma, Oklahoma.
- On May 22, 2020, there were eight tornado reports across Oklahoma (4) and Texas (4). Softball-sized hail was reported near Davidson, Oklahoma while a giant hailstone of 5.33 inches was reported near Burkburnett, Texas. Additionally, a wind gust of 75 mph (120.70 kph) was reported near Durant, Oklahoma.
- On May 23, 2020, there were three tornado reports in Texas. Hail slightly larger than teacup-sized was reported near Silverton, Texas, damaging numerous vehicles. A wind gust of 65 mph (104.61 kph) was reported near Meers, Oklahoma while a wind gust of 64 mph (103.00 kph) was reported near Jayton, Texas.
- On May 24, 2020, an EF-1 tornado was reported near Helotes, Texas. Tennis ball-sized hail was reported near Temple, Texas. A wind gust of 79 mph (127.14 kph) was reported near Putnam, Oklahoma.
- On May 25, 2020, there were seven tornado reports across Oklahoma (5), Arkansas (1), and Texas (1). Lime-sized hail was reported near Roma, Texas. Additionally, a wind gust of 70 mph (112.65 kph) was reported near Colcord, Oklahoma.
- On May 27, 2020, there were 116 severe weather reports across Arkansas, Louisiana, Mississippi, and Texas. One tornado was reported near Hempstead, Texas. Baseball-sized hail was reported near Georgetown, Texas while tennis ball-sized hail was reported near San Antonio, Texas. A wind gust of 80 mph (128.75 kph) was reported near Fredericksburg, Texas while a wind gust of 72 mph (115.87 kph) was reported at Jackson International Airport, Mississippi.
- On May 28, 2020, lime-sized hail was reported near Ingram, Texas. Additionally, a wind gust of 70 mph (112.65 kph) was reported near Junction, Texas.
- On May 29, 2020, a tornado was reported near San Leon, Texas.
Western Region (Information provided by the Western Region Climate Center)
- During the month, areas of above-normal precipitation were observed in northern California, Oregon, Washington, Idaho, and Montana while hot and dry conditions prevailed further south in the Four Corners states (Arizona, Colorado, New Mexico, Utah) as well as in southern portions of Nevada and California. Average temperatures for the month were above normal across the southern tier of the region with areas of record-breaking heat in Arizona and Colorado, while cooler-than-normal temperatures prevailed across portions of Idaho and Montana. For the Water Year (starting October 1), much of the West experienced below-normal precipitation with exceptionally dry conditions (<50% of normal precipitation) in parts of northern California, central Nevada, and southern Colorado. Conversely, Water-Year-to-Date precipitation (October-May) was well above normal across much of the Desert Southwest with areas of the Mojave, Sonoran, and Chihuahuan deserts falling into the top 10% wettest on record for the period.
- In California, warm and dry conditions prevailed across southern California and the Central Valley, while parts of the Sierra Nevada and northern California coast saw above normal precipitation for the month. In the Sierra Nevada foothills, the town of Colfax observed 4.31 in of precipitation (109 mm; 217% of normal) while the coastal city of Eureka, California in Humboldt County logged 4.73 in (120 mm; 266% of normal)—making it the 7th wettest May on record dating back to 1886. Despite this month’s beneficial rainfall in northern California, significant precipitation deficits (October 1 to May 31) remain with areas of northwestern California experiencing the largest shortfalls—with some areas having deficits exceeding 25 inches (635 mm). According to the May 26 U.S. Drought Monitor (USDM) map, 47% of the state of California was in drought with areas in northwestern California experiencing “Severe” (D2) and “Extreme” (D3) drought conditions. With California entering its dry season (June-August) and the seasonal forecast outlooks calling for a high probability (>60%) of above normal temperatures, drought conditions are expected to persist. As of May 31, the state’s two largest reservoirs, Shasta and Oroville, were at 91% and 81% of historical averages, respectively.
- In the Pacific Northwest, much of the region experienced above-normal precipitation with areas of northeastern Oregon and eastern Washington experiencing precipitation accumulations that ranked in the top 10% (wettest) for the month of May. In northeastern Oregon, the town of Meacham, situated in the Blue Mountains, logged 6.26 in of rain (159 mm; 191% of normal) while the observing station at the Priest River Experimental Station in the Idaho Panhandle observed 6.16 in (156 mm; 235% of normal)—with measureable precipitation recorded on 17 days during the month. As of May 1, numerous drainage basins (6-digit HUC) in the region were reporting below-normal SWE including the Upper Columbia (69%), Yakima (81%), Deschutes (52%), Southern Oregon Coast (45%), Oregon Closed Basins (56%), John Daly (47%), Klamath (34%), Middle Snake-Boise 73%, Middle Snake-Powder (84%), Lower Snake (88%), Upper Snake (71%), and Salmon (85%) basins.
- In the Intermountain West, drier-than-normal conditions prevailed for a second consecutive month across the Four Corners states and much of Nevada. In southern Nevada, McCarren International Airport (AP) in Las Vegas received no precipitation (normal May precipitation is 0.12 in; 3 mm) for the month and tied for the driest May on record. In southern Colorado and northern New Mexico, areas of drought expanded and intensified during May in response to a combination of below-normal seasonal snowpack levels and unseasonably warm temperatures that triggered an early snowpack melt-out in the lower and mid-level elevations in areas of the San Juan and Rio Grande river basins. Average temperatures, across the Four Corners states and Nevada, were above normal with mean temperatures for the month falling in the top 10% warmest on record in some areas. Furthermore, areas of southeastern Arizona and southwestern Colorado experienced some record-breaking heat including at Safford, Arizona that had its hottest May on record with an average temperature of 78.3°F (25.7°C)—a +4.5°F (+2.5°C) departure from normal. Likewise, the Cortez Municipal AP (Colorado) logged its hottest May on record with an average temperature of 59.8°F (15.4°C; +4.2°F [+2.3°C] departure).
- In Alaska, warmer-than-normal temperatures prevailed across the state during May including on Kodiak Island that broke a single-day high temperature record reaching 68°F (20°C) as well as logging its 6th warmest May on record (dating back to 1931). Precipitation for the month was generally below normal across most of the state with St. Paul Island, in the Pribilof Islands, having its driest May on record (dating back to 1892) with no measureable precipitation.
- In the Hawaiian Islands, averages temperature were near to slightly above normal for May while precipitation was below normal on Oahu, Molokai, and the windward sides of Maui and the Big Island. Elsewhere, precipitation was near to slightly above normal. On the windward side of Big Island, Hilo International AP reported 3.45 in of rain (88 mm; 42% of normal) while Kona International AP on the leeward side reported 2.58 in (66 mm; 129% of normal) for the month.
Significant Events
- Drought conditions intensify in parts of the West: As of the end of May, 39% of the West was experiencing drought conditions—a 9% increase from the end of April, according to the USDM. Areas experiencing the most severe drought conditions in the region include southern Colorado, northern New Mexico, northwestern California, and southwestern/north-central Oregon.
- Record-breaking heat on the Seward Peninsula of Alaska: Nome, Alaska observed its warmest May on record (dating back to 1900) with an average temperature of 45.7°F (7.6°C)—a +8.9°F (+5°C) departure from normal.