January Highlights
January Temperature
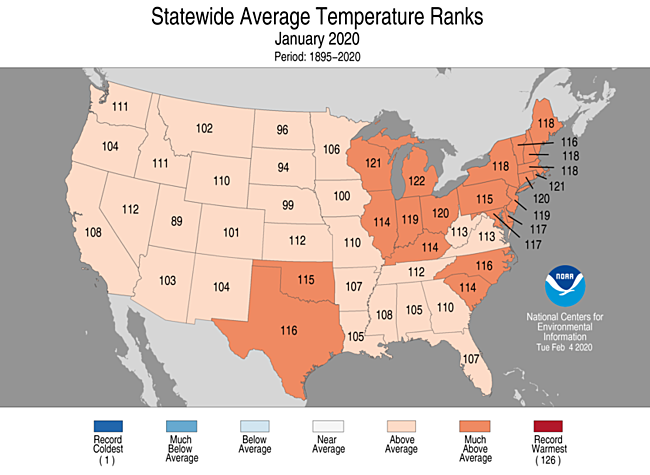
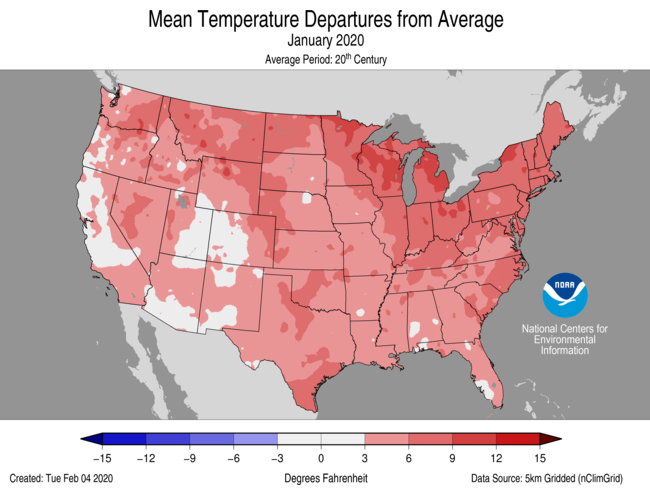
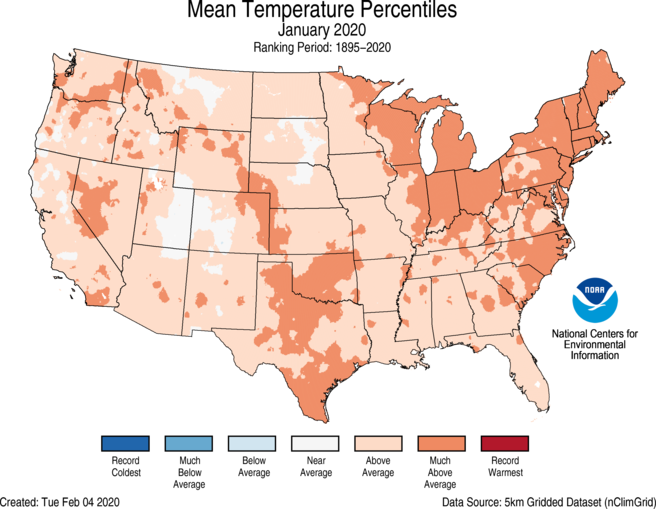
- For January, the average contiguous U.S. temperature was 35.5°F, 5.4°F above the 20th century average, ranking fifth warmest in the 126-year record. This was the ninth consecutive January with temperatures at least nominally above the 20th century average for the month.
- Much-above-average temperatures were observed across much of the Great Lakes and Northeast as well as parts of the Mid-Atlantic, Southeast, the southern Plains and West. Michigan ranked fifth warmest, while Wisconsin and Rhode Island ranked sixth warmest. No state in the Lower 48 ranked average or below average for the month.
- Temperatures during the first part of winter were warm enough across the Great Lakes to keep surface water temperatures above freezing across a large portion of the basin. As a result, lake-effect snow events become possible much later in the season than on average, which can lead to higher seasonal snowfall totals. Basin-wide ice cover spiked briefly at the end of January — approximately 35 percent of average for this time of year. Lake Erie, which averages just over 50 percent ice coverage at the end of January, was only 0.4 percent frozen on January 31.
- In stark contrast to the record warmth experienced during 2019, the Alaska average January temperature was −6.2°F, 8.4°F below the long-term mean. This tied with 1970 as the 13th coldest January on record for the state and the coldest January since 2012.
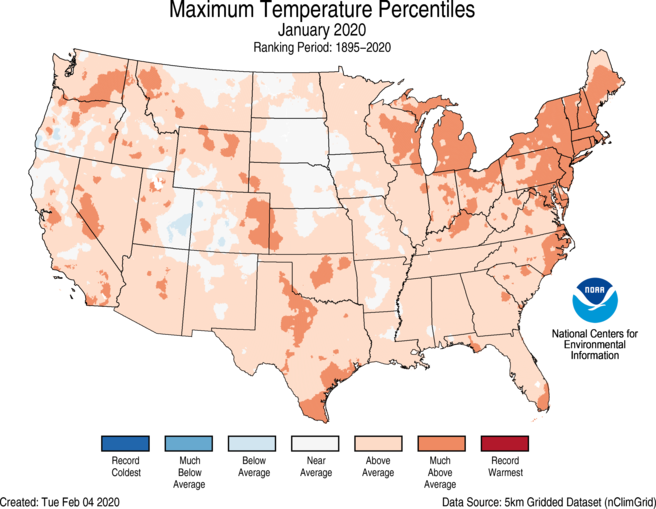
- The nationally averaged maximum temperature (daytime highs) was warmer than average during January at 45.1°F, 4.6°F above average, ranking as the tenth warmest January in the 126-year record. Parts of the West, High Plains, Great Lakes and Northeast had temperatures which were much-above-average for the month. Only a small pocket of below-average maximum temperatures was evident across the Four Corners region.
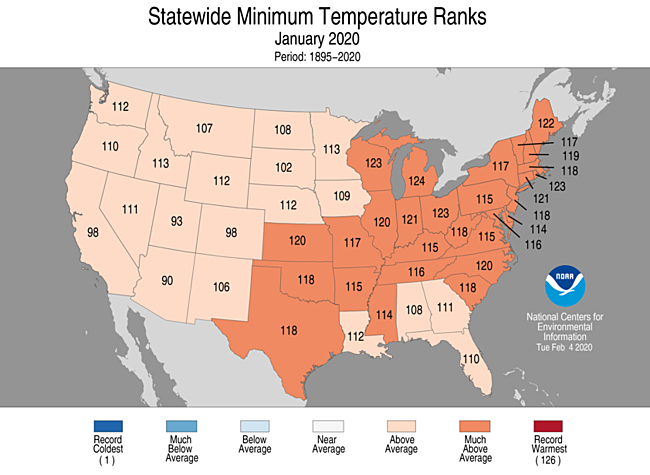
- The nationally averaged minimum temperature (overnight lows) during January was 26.0°F, 6.2°F above average and ranked as the third highest January average in the 126-year record and the warmest overnight low temperatures since the record warm January of 2006. Twenty-eight states ranked much-above-average with Michigan ranking third warmest and Wisconsin, Ohio and Rhode Island ranking fourth warmest minimum temperature for the month. No state ranked below-average for minimum temperatures during January.
- Warm records in January outpaced cold records by a twelve-to-one margin. As of February 6, there were 3,731 warm daily high (1,381) and low (2,350) temperature records tied or broken during January. There were approximately 299 daily cold high (209) and low (90) temperature records set during the month.
- Based on NOAA's Residential Energy Demand Temperature Index (REDTI), the contiguous U.S. temperature-related energy demand during January was 29 percent below average and ranked as the 3rd lowest value on record.
January Precipitation
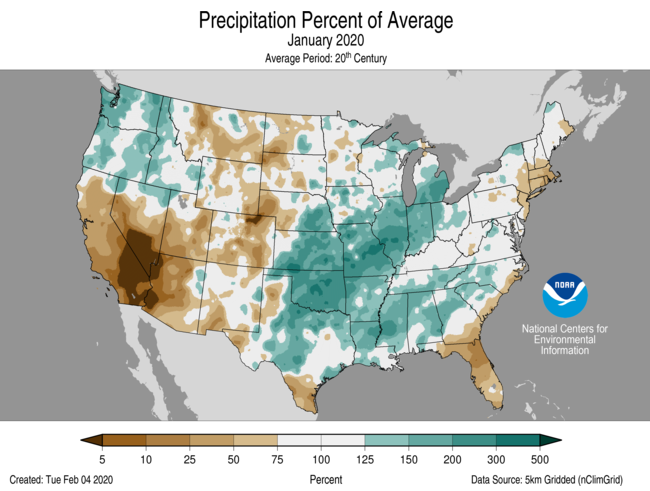
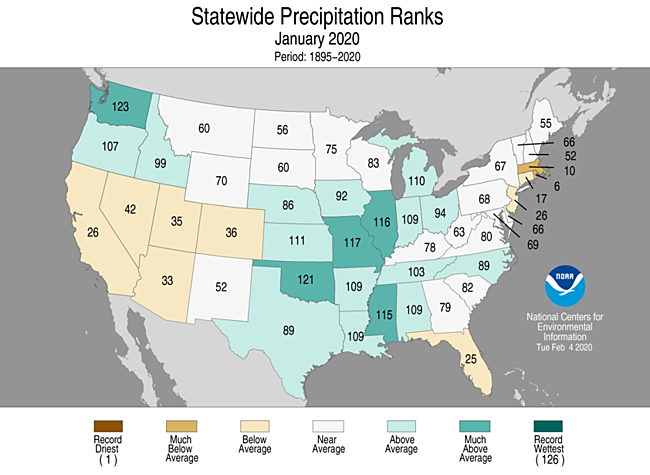
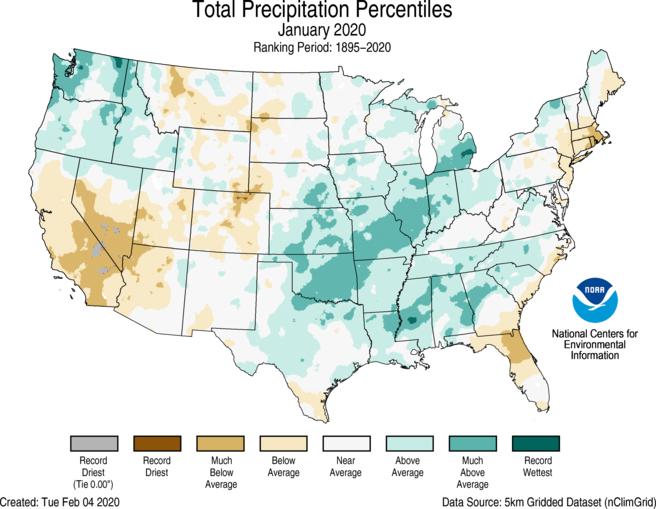
- The January precipitation total for the contiguous U.S. was 2.70 inches, 0.39 inch above average, and ranked in the middle third of the 126-year period of record.
- During January, much-above-average wetness was observed across the Pacific Northwest as well as portions of the central and southern U.S. The state of Washington ranked fourth wettest while Oklahoma ranked sixth wettest on record.
- According to the U.S. Army Corps of Engineers, the Great Lakes continue to be at or near or record water levels during January. A record wet 2019 around the Great Lakes contributed to these high water levels, which are not expected to receed for many months. If precipitation across this region remains above average, it will take even longer for the lake levels to fall. Lake Superior, Lake Michigan and Lake Huron set records for high water level during January.
- Below-average precipitation occurred across much of the Southwest, Florida and portions of the High Plains and Northeast. Rhode Island ranked sixth driest and Massachusetts ranked tenth driest for January.
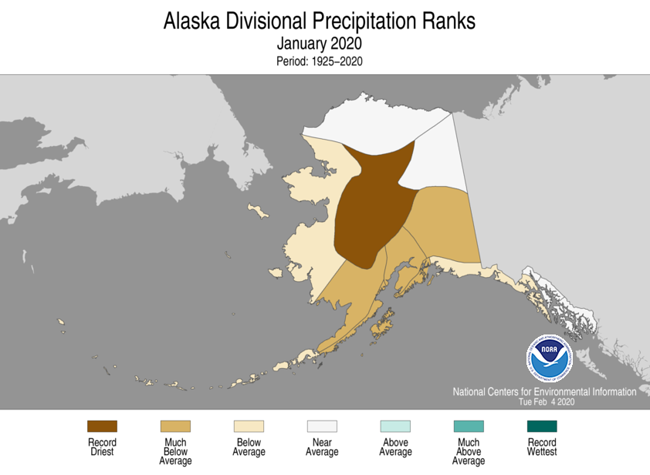
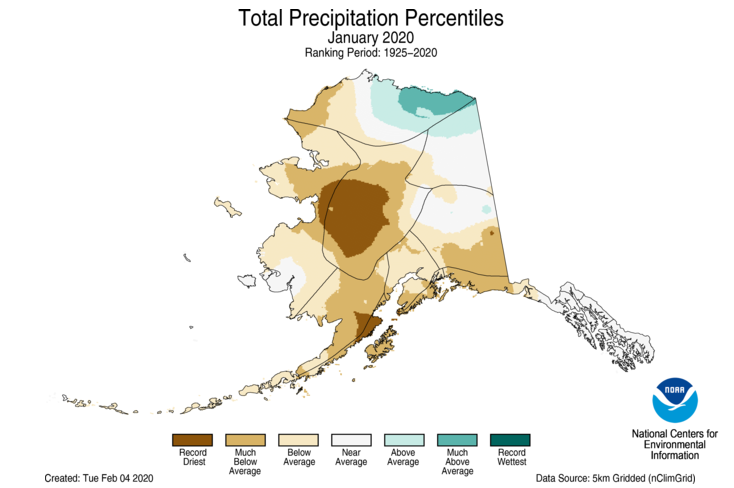
- Alaska had its 14th driest January since records began in 1925 and the driest January since 2006. The Central Interior division was record dry for the month. Despite the below-average statewide precipitation, snowfall was plentiful across the Panhandle and other near-coastal locations.
- According to the January 28 U.S. Drought Monitor report, approximately 11 percent of the contiguous U.S. was in drought, which is similar to the coverage at the end of December. Drought conditions expanded and shifted slightly across parts of Oregon, the state of Washington and Idaho. Improvements occurred across portions of the Southwest and Hawaii, while drought was eliminated in Alaska and Puerto Rico during January.
Regional Highlights
These regional summaries were provided by the six Regional Climate Centers and reflect conditions in their respective regions. These six regions differ spatially from the nine climatic regions of the National Centers for Environmental Information.
Northeast Region (Information provided by the Northeast Regional Climate Center)
- The Northeast had its 10th warmest January since 1895. The region’s average temperature of 29.9 degrees F (-1.2 degrees C) was 6.7 degrees F (3.7 degrees C) warmer than normal. This January ranked among the fifteen warmest Januarys on record for all twelve Northeast states: Rhode Island, sixth warmest; Connecticut, seventh warmest; New Jersey, eighth warmest; Maine, Massachusetts, New Hampshire, and New York; ninth warmest; Delaware and Maryland, 10th warmest; Vermont, 11th warmest; Pennsylvania, 12th warmest; and West Virginia, 14th warmest. State departures ranged from 6.0 degrees F (3.3 degrees C) above normal in Delaware and Maryland to 7.2 degrees F (4.0 degrees C) above normal in Connecticut, Rhode Island, and Vermont. On January 12, Boston, Massachusetts; Bridgeport, Connecticut; and Providence, Rhode Island, had their warmest January day on record.
- The Northeast wrapped up January with 2.88 inches (73.15 mm). of precipitation, which was 93 percent of normal. Ten of the twelve states were drier than normal, with January precipitation ranging from 37 percent of normal in Rhode Island to 106 percent of normal in West Virginia. This January ranked as the sixth driest on record for Rhode Island, the 10th driest for Massachusetts, and the 17th driest for Connecticut.
- The U.S. Drought Monitor released on January 2 showed less than 1 percent of the region as abnormally dry. This included a small area in eastern Maryland and southern Delaware. Several factors, including persistent precipitation deficits, below-normal streamflow, and below-normal soil moisture, led to the expansion of abnormal dryness in Maryland and Delaware during the first three weeks of January. Rainfall during the last week of the month allowed for minor improvements. The U.S. Drought Monitor released on January 30 showed 2 percent of the region was abnormally dry.
- Unusually mild temperatures were reported across the region on January 11 and 12. High temperatures ranged from 50 to 80 degrees F (10 to 27 degrees C) in many areas. On January 11, Charleston, West Virginia, reported a high of at least 80 degrees F (27 degrees C) for only the second time on record in the month of January. On January 12, Boston, Massachusetts; Providence, Rhode Island; and Bridgeport, Connecticut, had their warmest January day on record with highs of 74 degrees F (23 degrees C), 70 degrees F (21 degrees C), and 69 degrees F (21 degrees C), respectively. In fact, it was the first time on record that Providence reported a high of 70 degrees F (21 degrees C) in the month of January. Numerous other sites such as Pittsburgh, Pennsylvania; Albany, New York; and Wilmington, Delaware, had one of their top 10 warmest January days on record. Low temperatures were also mild, ranking among the 10 warmest on record for January at several sites including Beckley, West Virginia, and Islip, New York. In addition to the unusual warmth on January 11, strong to severe thunderstorms, with wind gusts up to 63 mph (28 m/s), downed trees and powerlines and caused some damage to buildings in West Virginia. At the opposite end of the region, northern Maine saw mixed precipitation, with Caribou having its eighth snowiest January day on January 12. A storm on January 25 dropped up to 3 inches (76 mm) of rain on the region. Some of the greatest amounts were in southeastern Pennsylvania and Delaware where some roads were flooded. Several higher-elevation locations in Pennsylvania, as well as northern Maine, saw freezing rain accumulation of up to 0.40 inches (10 mm), leading to hazardous travel. The first inch of snow typically falls in late December in Washington, D.C.; Wilmington, Delaware; and Philadelphia, Pennsylvania, and in early January in Atlantic City, New Jersey. With mild temperatures in December and January, the first inch of snow had not arrived at these sites as of January 31, around a month late. When (or if) it does fall, the first inch of snow will rank among the ten latest on record for all four sites.
- For more information, please visit the Northeast Regional Climate Center Home Page.
Midwest Region (Information provided by the Midwest Regional Climate Center)
- January precipitation was well above normal for much of the Midwest. Precipitation averaged 2.80 inches (71 mm), which was 1.03 inches (26 mm) above normal, ranking as the 17th wettest January on record (1895-2020) for the region. Only scattered areas in Minnesota, Wisconsin, Michigan, Ohio, and Kentucky had slightly below-normal precipitation, while a wide swath across southern and central Missouri, the southern half of Illinois, and into southern Indiana had more than two inches (51 mm) of precipitation above the normal. Large areas of Missouri, Illinois, and southern Michigan had more than twice the normal totals for January. Statewide, Missouri had its 10th wettest January and Illinois had its 11th wettest. Indiana and Michigan also ranked among their top-20 wettest January totals as well.
- Temperatures were warmer than normal across the Midwest in January. Departures from normal ranged from 1 to 3 degrees F (0.6 to 1.7 C) above normal in the west to 6 to 8 degrees F (3.3 to 4.4 C) above normal in the east. Cooler temperatures just after the middle of the month were more than offset by very warm conditions in the first half of the month and warm conditions to end the month. Fewer than 20 daily record low temperatures were set in January while more than 500 daily record highs were set. Regional temperatures averaged 27.6 degrees F (-2.4 C), 5.5 degrees F (3.1 C) above normal, and ranked as 9th warmest since 1895. Statewide temperature ranks included Michigan at 5th warmest, Wisconsin 6th, Ohio 7th, Indiana 8th, and both Illinois and Kentucky 13th warmest in their respective histories. Minimum temperatures ranked as the 4th warmest for the region with statewide rankings ranging from 3rd (Michigan) to 14th warmest (Minnesota) in the nine Midwest states.
- Snow totals in January were mostly above normal in Minnesota, Wisconsin, Iowa, Upper Michigan, and parts of Illinois and Missouri. The rest of the Midwest, including Indiana, Ohio, Kentucky, Lower Michigan, and parts of Illinois and Missouri were below normal. The westernmost edge of Upper Michigan was well below normal, unlike the areas around it. Most of the Ohio River Valley had little or no snow (less than 1 inch or 3 cm) in January compared to the normal of 2 to 6 inches (5 to 15 cm). No measurable snow fell in Evansville, Indiana, Lexington, Kentucky, and Paducah, Kentucky. A large portion of the Midwest snow that fell came in just two storm systems. One on January 17th and 18th brought snow across the upper Midwest, and the other on January 22nd through 25th spread snow from northern Missouri to Upper Michigan.
- Severe thunderstorms struck the southern third of the region on the 10th and 11th. More than 100 severe weather reports were logged on those days. Tornadoes were reported in Missouri, Illinois, Kentucky, and Ohio. In both Missouri and Kentucky verified EF-1 rated tornadoes caused damages to trees and outbuildings. Large hail was also reported on the 10th in Missouri and a lone report of large hail on the 13th came from Kentucky.
- The storm that brought severe weather on the 10th and 11th also brought heavy rains which brought minor to moderate flooding to the Missouri, Mississippi, Wabash, and Ohio rivers along with their tributaries. Soils were at or near saturation in much of the region heading into winter and remained so through January. This wetness, and the high river flows, increases the risk of spring flooding.
- For further details on the weather and climate events in the Midwest, see the weekly and monthly reports at the Midwest Climate Watch page.
Southeast Region (Information provided by the Southeast Regional Climate Center)
- Temperatures were much above average across the Southeast and Puerto Rico for the month of January. Monthly mean temperatures were over 5 degrees F (2.8 degrees C) above normal in more than half of the 187 long-term (i.e., period of record equaling or exceeding 50 years) stations across the region. None of the stations reported below average mean temperatures for the month. Pelion, SC (1947-2020), and Buxton, NC (1957-2020) both observed their second warmest January on record. However, not a single station had mean temperature values that ranked as first warmest. While maximum temperatures were generally 3 to 6 degrees F (1.6 to 3.3 degrees C) warmer than average, minimum temperatures throughout the region ranged from around 5 to 8 degrees F (2.8 to 4.4 degrees C) above average, consistent with general trends seen in the region over time. Juncos, PR (1931-2020) observed its warmest January for average monthly minimum temperature at 68.1 degrees F (20.1 degrees C). The warmest weather of the month occurred on the 11th-12th, as unusually warm and humid air surged northward ahead of an approaching cold front. Daytime maximum temperatures reached or exceeded 76 degrees F (24.4 degrees C) across portions of every state. Fort Myers, FL (1902-2020) reported a daytime maximum temperature of 88 degrees F (31 degrees C), which surpassed the previous daily record of 85 degrees F (29 degrees C) set in 2013. In contrast, the coldest weather of the month occurred on January 21st – 22nd, as a continental high pressure system ushered in unseasonably cold air from the northwest. Daily minimum temperatures fell below 32 degrees F (0 degrees C) across portions of every state, including Florida. Miami, FL (1895-2020) reported a daily minimum temperature of 40 degrees F (4.4 degrees C), which was the coldest morning in Miami since December 2010. Lakeland, FL (1948-2020) reported a daily minimum temperature of 31 degrees F (-0.6 degrees C), and Cross City, FL (1948-2020) reported a daily minimum of 27 degrees F (-2.8 degrees C).
- Precipitation varied widely across the Southeast during January. A region of above normal precipitation stretched from northern Virginia, southward through western North Carolina, western South Carolina, northern Georgia, and northern Alabama. Precipitation in this region was generally 130 to 200 percent of normal. There were 3 long-term stations that observed more than 10 inches (254 mm) of precipitation for January, including Haleyville, AL (1902-2020; 6th wettest January) at 10.85 inches (276 mm), Russellville, AL (1953-2020; 3rd wettest January) at 10.39 inches (264 mm), and Atmore, AL (1940-2020; T-4th wettest January) at 10.21 inches (259 mm). Puerto Rico also reported above normal precipitation, with San Juan, PR (1898-2020; 4th wettest January) observing 9.08 inches (231 mm) of rain. On January 2nd, a slow-moving low pressure system produced over 3 inches (76 mm) of rainfall across portions of Alabama. As a result, Tuscaloosa, AL (1948-2020) observed its 3rd wettest maximum daily precipitation for January at 3.25 inches (83 mm), and Huntsville, AL (1894-2020) observed its 6th wettest maximum daily precipitation for January at 3.42 inches (87 mm). In contrast, unusual dryness was found across the East Coast of Virginia, the Carolinas, Georgia, and most of Florida, where the precipitation values ranged from 90 to less than 50 percent of normal. Jacksonville, FL (1871-2020) only reported 0.18 inches (4.6 mm) of precipitation for the month, which was about 3 inches (76 mm) below normal. Some light snowfall was reported across portions of the northern tier, with Blacksburg, VA (1952-2020) observing 2.5 inches, Washington Dulles, VA (1962-2020) observing 2.3 inches, and Roanoke, VA (1912-2020) observing 1.6 inches. On January 31st, parts of North Carolina and South Carolina reported a trace of snow as a cold front pushed through the region. As a result, Charlotte, NC (1878-2020) continues its record of reporting at least a trace of snow every winter season since 1878. Beech Mountain, NC (1991-2020) recorded the highest snowfall total in the region for the month, at 13.9 inches.
- There were 372 severe weather reports across the Southeast during January, which is over 600 percent of the median monthly frequency of 56 reports during 2000-2018. There were 14 confirmed tornadoes reported for the month (5 EF-0, 6 EF-1, and 3 EF-2), more than double the monthly average of 6. About 9 of these tornadoes were associated with a line of thunderstorms that developed ahead of a cold front, which moved into west central Alabama on January 11th. The most damaging tornado was rated an EF-2 with winds of 134 mph (60 m/s) and occurred in Pickens County, AL. At least 22 homes sustained varying degrees of damage. Three fatalities occurred in two manufactured homes, which had home frames that were found a considerable distance away from the home sites. Seven injuries were also reported with this tornado. Another EF-2 tornado with winds of 130 mph (58 m/s) was reported in Kershaw County, SC the same day. This tornado heavily damaged a high school, however no injuries were reported. There were no reports of hail for the month. There were 355 wind reports for the month. A thunderstorm wind of 75 mph (34 m/s) in Greene County, AL blew a very large tree down onto the water main in Forkland, and many thousands of gallons of water spilled out of the water tower. On January 13th, a microburst in Sampson County, NC damaged a school. Damage in the form of snapped and uprooted trees to the west of the school structure, along with the more significant roof uplift and partial outer wall collapse of the school’s gymnasium occurred in a clear fan-like fashion. Maximum wind speed was estimated at 85 mph (38 m/s), and three injuries were associated with the microburst. On January 24th, a downburst produced straight-line wind damage in Chesterfield County, SC. A mobile home, just north of the town of Patrick, was pushed off its supports and partially flipped. Maximum wind speed was estimated at 75 mph (34 m/s), and six injuries were associated with the downburst.
- Overall drought conditions have not changed for the month of January, with no areas of severe drought (D2). There continues to be a pocket of moderate drought (D1), ringed by an area of dry conditions (D0), in the Panhandle of Florida. Abnormally dry conditions (D0) have expanded through southern Florida, southern Alabama, and the coasts of the Carolinas. Puerto Rico no longer has moderate drought (D1) however, a few pockets of abnormally dry conditions (D0) remain. Strawberry growers in Florida indicated higher than normal fungal disease pressure due to the warmer temperatures this month, and were in need of drier, cooler weather. The cold front during the last week of the month affected many vegetable crops in the southern part of the state. Strong winds associated with the front knocked off vegetable blossoms and eroded yield potential. Cooler temperatures were beneficial to the citrus crop, however, helping to achieve cold hardiness for future cold snaps in Florida. Some parts of Alabama received excess rainfall, saturating cropland and pastures. Wheat and winter forages were in good condition; however, many producers were still facing impending hay shortages due to drought conditions in the fall. Consistent rains kept producers out of onion fields in Georgia, where they would normally be making fertilizer and fungicide applications. Wet conditions have caused some late weed control issues in small grains, as well. Hay supplies were short in many areas of Georgia due to drought conditions last fall. Fruit and nut crops are in need of additional chill hours. The warm temperatures though much of January pushed wheat growth ahead of normal in North Carolina, and blueberry and strawberry blossom production way ahead of normal. Early blossoming blueberry varieties could potentially suffer crop loss.
- For more information, please visit the Southeast Regional Climate Center Home Page.
High Plains Region (Information provided by the High Plains Regional Climate Center)
- It was another mild month for the High Plains region. Temperature departures in the range of 2.0-4.0 degrees F (1.1-2.2 degrees C) above normal were widespread across much of the region. While there were some isolated areas where departures exceeded 6.0 degrees F (3.3 degrees C) above normal, very few locations ranked in the top 10 warmest Januarys on record. Other areas of the region were largely near normal, with western Colorado and pockets of North Dakota, South Dakota, Wyoming, and northern Nebraska having monthly temperatures that were slightly below normal. The past month brought above-normal precipitation to much of the southern and eastern portions of the High Plains, with more variable precipitation across the remainder of the region. A series of storm systems tracked across the High Plains region towards the middle and end of the month. These systems brought an extended period of widespread precipitation to much of the region; however, temperatures remained just warm enough for much of the precipitation to fall as a wintry mix of snow, sleet, freezing rain, and rain. This created significant travel issues as the mixed bag of precipitation led to icy and slushy roads across Kansas and Nebraska. Further north across North Dakota and South Dakota, slightly colder air allowed for more of the precipitation to fall as snow, which led to higher snow totals and travel disruptions from blowing and drifting snow.
- With planting season around the corner, there are many concerns across the region. For instance, many fields remain unharvested, especially in North Dakota, and fields that went unplanted last year may have weed issues this year. With extremely wet conditions already in place, it may be difficult to get into the fields for spring planting activities. Conditions should be monitored closely through the late winter and spring. For the latest information on the extremely wet conditions that are present across much of the Missouri River Basin, please see this briefing: https://www.weather.gov/media/crh/MissouriBasin.pdf.
- The winter season continued to be relatively mild across the High Plains through January. Temperatures throughout the region were, for the most part, above normal over the past month, with departures generally ranging from 2.0-4.0 degrees F (1.1-2.2 degrees C) above normal. Some locations had departures that were slightly higher. This was the second month in a row that above-normal temperatures dominated the High Plains region as a whole. The largest departures occurred across northeastern Colorado, northern and eastern Wyoming, and portions of Kansas. There were, however, a few cooler spots in the High Plains during the month of January. Near-normal to slightly below-normal temperatures were observed in areas of North Dakota, South Dakota, western Colorado, and Wyoming. Similar to December, most areas experienced a relatively mild month as a whole; however, the warmest areas only ranked in the top 20 warmest Januarys on record. Although the month was mild, it was not one for the record books. For instance, an unseasonably warm air mass at the beginning of the month brought temperatures that were over 15.0 degrees F (8.3 degrees C) above normal to western and southern portions of the region. However, this was not enough to break records. One of these locations was Scottsbluff, Nebraska, which recorded a high temperature of 57.0 degrees F (13.9 degrees C) on January 4th. Although unseasonably warm for this time of the year, this fell short of the daily record of 64.0 degrees F (17.8 degrees C), which occurred in 1927 (period of record 1893-2020).
- Precipitation varied across the High Plains region this month. Above-normal precipitation occurred across eastern and southern portions of the region, where totals were in excess of 200 percent of normal, with isolated areas up to 400 percent of normal. Meanwhile, a larger area of below-normal precipitation occurred across much of Colorado, northern and southeastern Wyoming, the panhandle of Nebraska, and western North Dakota and South Dakota. Precipitation in these areas was less than half of normal; however, these deficits are not large for this time of the year. Ultimately, several locations across the region ranked in the top 20 wettest Januarys on record, but few ranked in the top 10. One exception was Wichita, Kansas, which had its 7th wettest January on record with 2.37 inches (60 mm) of liquid equivalent precipitation. Although ranking in the top 10, this was far from the 1949 record amount of 6.29 inches (160 mm) (period of record 1889-2020). On the other side of the spectrum, Laramie, Wyoming tied with 2013 for its driest January on record with only a trace amount of precipitation observed for the entire month (period of record 1948-2020). Taking a closer look at the month, January started relatively quiet for much of the region, but became more active during the middle and end. During the third week of the month, a series of storm systems tracked across the High Plains. The first of several storms arrived on the 17th and 18th, with additional disturbances moving through the remainder of the week, bringing an extended period of mixed precipitation including snow, sleet, freezing rain, and rain to much of Kansas and Nebraska. Although the mixed precipitation limited overall accumulations in southern areas of the region, very slick and slushy road conditions impacted interstates such as I-80 in Nebraska and I-70 in Kansas. Further north, the January 17-18 storm brought mixed precipitation in addition to blizzard conditions to portions of eastern South Dakota and North Dakota. In anticipation of the storm, flights were delayed or cancelled, and many schools closed early. Travel conditions deteriorated quickly, closing portions of I-29 and I-90 in South Dakota and I-29 and I-94 in North Dakota, and “no travel advisories” impacted several communities in both states. Ultimately, many locations received about 4.0-8.0 inches (10-20 cm) of snow from this storm.
- Mountain snowpack remained in good shape this month across much of Colorado and Wyoming. By the end of January, Colorado’s statewide Snow Water Equivalent (SWE) was 109 percent of median, while Wyoming’s was 108 percent of median. Basins in western Wyoming that had below-normal snowpack in December improved, with only one basin in the state with SWE below 90 percent. Meanwhile, across the Upper Missouri Basin, mountain SWE was still near to slightly above normal. As of February 2nd, mountain SWE was 98 percent of average above Fort Peck and also 98 percent of average in the reach from Fort Peck to Garrison, according to the U.S. Army Corps of Engineers. At the end of the month, plains snowpack was present across eastern portions of the region, as well as southwestern Kansas. SWE varied from a trace to about 6.0 inches (25 mm).
- Drought conditions improved slightly across western portions of the High Plains region during the month of January. According to the U.S. Drought Monitor, the area experiencing drought (D1-D4) in the High Plains region remained nearly unchanged since the end of December. As of late January, around 12 percent of the High Plains was in drought. Although the area in drought remained about the same, the area in severe drought (D2) fell by about 3 percent over the course of the month. Many improvements occurred during January, especially in western and southern Colorado where a sizeable reduction of severe drought (D2) conditions occurred due to ample snowfall. With this reduction, just over 1 percent of the region remained in D2 at the end of the month. Meanwhile, across southwestern Kansas, moderate drought (D1) and severe drought (D2) decreased very slightly as well. Abnormally dry conditions (D0) expanded to include portions of northwestern Kansas, northeastern Colorado, southwestern Nebraska, and northern Wyoming. A small pocket of moderate drought (D1) remained in place across central Kansas throughout the month. The remainder of the region continued to remain free of drought (D1-D4) and abnormally dry (D0) conditions. As of the January 28th release of the U.S. Drought Monitor, both Nebraska and South Dakota have been drought-free for more than a year.
- For more information, please visit the High Plains Regional Climate Center Home Page.
Southern Region (Information provided by the Southern Regional Climate Center)
- Temperatures for the month of January were above normal across the Southern Region. Parts of western Oklahoma, western Texas, and southern Louisiana experienced temperatures 0 to 2 degrees F (0.00 to 1.11 degrees C) above normal. Parts of western, southern, and eastern Oklahoma; northern, western, and eastern Texas; central and northern Louisiana; central, northern, and western Arkansas; and southern and western Mississippi experienced temperatures 2 to 4 degrees F (1.11 to 2.22 degrees C) above normal. Parts of western, central, southern, and eastern Oklahoma; northern, central, southern, and eastern Texas; northern, western, and southeastern Louisiana; southern, eastern, northern, and western Arkansas; southern, central, and northern Mississippi; and eastern, central and western Tennessee experienced temperatures 4 to 6 degrees F (2.22 to 3.33 degrees C) above normal. Parts of central Oklahoma, southern and southeastern Texas, northeastern Louisiana, eastern Arkansas, western, eastern, and northeastern Mississippi; and west-central, east-central, and eastern Tennessee experienced temperatures 6 to 8 degrees F (3.33 to 4.44 degrees C) above normal. The statewide monthly average temperatures were as follows: Arkansas – 43.80 degrees F (6.56 degrees C), Louisiana – 53.80 degrees F (12.11 degrees C), Mississippi – 50.00 degrees F (10.00 degrees C), Oklahoma – 42.20 degrees F (5.67 degrees C), Tennessee – 42.90 degrees F (6.06 degrees C), and Texas – 50.80 degrees F (10.44 degrees C). The statewide temperature rankings for January were as follows: Arkansas (twentieth warmest), Louisiana (twenty-first warmest), Mississippi (nineteenth warmest), Oklahoma (twelfth warmest), Tennessee (fifteenth warmest), and Texas (tenth warmest). All state rankings are based on the period spanning 1895-2020.
- Precipitation values for the month of January were primarily above normal across the Southern Region, but dry regions were present. Parts of southeastern Louisiana as well as parts of southern, northern, and western Texas received 50 percent or less of normal precipitation. Parts of southern and western Texas received 25 percent or less of normal precipitation, while parts of far southern and far western Texas received 2 percent or less of normal precipitation. In contrast, parts of central, northern, and eastern Texas; northern and central Louisiana, central and northern Mississippi, southern, central, and eastern Tennessee, and most of Oklahoma and Arkansas received 150 percent or more of normal precipitation. Parts of central and eastern Texas, western, central, and eastern Oklahoma, northwestern Arkansas, northeastern Louisiana, central and northeastern Mississippi, and southern and southeastern Tennessee received precipitation 200 percent or more of normal, while parts of western Oklahoma and northern Texas received precipitation 400 percent or more of normal. The statewide precipitation totals for the month were as follows: Arkansas – 6.22 inches (157.99 mm), Louisiana – 7.45 inches (189.23 mm), Mississippi – 8.73 inches (221.74 mm), Oklahoma – 3.44 inches (87.38 mm), Tennessee – 6.49 inches (164.85 mm), and Texas – 1.89 inches (48.01 mm). The state precipitation rankings for January were as follows: Arkansas (eighteenth wettest), Louisiana (eighteenth wettest), Mississippi (twelfth wettest), Oklahoma (sixth wettest), Tennessee (twenty-fourth wettest), and Texas (thirty-eighth wettest). All state rankings are based on the period spanning 1895-2020.
- At the end of January, drought conditions both improved and deteriorated across the Southern Region. Extreme drought conditions persisted across southern Texas with smaller areas developing along the southern border, while areas in central Texas experienced removal of extreme drought conditions. Severe drought classifications were still present in central and southern Texas as well as extreme western Oklahoma, while new areas developed in southern, southeastern, and eastern Texas. However, severe drought conditions were removed in southwestern Oklahoma and southwestern Arkansas. Moderate drought classifications decreased across extreme western Oklahoma, northern and west-central Texas, northeastern and northwestern Louisiana, and southwestern Arkansas, while new areas developed in eastern, southern, and southeastern Texas. There was an increase in the overall area experiencing abnormally dry conditions despite improvement across northern Texas, southwestern and extreme western Oklahoma, and central Arkansas. This was due to an increase in abnormally dry conditions across western, central, southern, and eastern Texas, southern Louisiana, and southern Mississippi.
- In January, there were approximately 396 storm reports across Oklahoma, Texas, Arkansas, Tennessee, Louisiana, and Mississippi. There were 51 tornado reports, 20 hail reports, and 325 wind reports. Mississippi tallied the most tornado (17) and wind (92) reports, while Texas tallied the most hail reports (11). Mississippi tallied the most reports (109) while Oklahoma tallied the fewest (12). Every state reported tornadoes, three states (Arkansas, Oklahoma, and Texas) had at least 1 hail report, and every state had at least 1 wind report. 392 of the 396 total reports occurred over a span of 2 days (January 10 and 11).
- On January 10, 2020, there were an estimated 252 storm reports across Oklahoma, Texas, Arkansas, Tennessee, Louisiana, and Mississippi. There were 41 tornado reports, 20 hail reports, and 191 wind reports. One person was killed during a tornado near Nacogdoches, Texas while two people were killed during a tornado near Barksdale Air Force Base, Louisiana. Additionally, at least 10 people were injured during tornadoes reported in Texas, Louisiana, Arkansas, and Mississippi. Strong winds resulted in a fatality near Oil City, Louisiana, while three people in Mississippi were injured due to strong winds. A wind gust of 79 mph (127.14 kph) was reported near Tunica, Mississippi, while a wind gust of 77 mph (123.92 kph) was reported near San Antonio, Texas.
- On January 11, 2020, there were an estimated 140 storm reports across Texas, Arkansas, Louisiana, Mississippi, and Tennessee. There were 9 tornado reports and 131 wind reports. Four people were injured during a tornado near Krotz Springs, Louisiana. A wind gust of 79 mph (127.14 kph) was reported near Wears Valley, Tennessee, while a wind gust of 71 mph (114.26 kph) was reported near Mandeville, Louisiana.
- On January 28, 2020, an EF-0 tornado was reported near Ross, Texas.
- For more information, please visit the Southern Regional Climate Center Home Page.
- Drought and Severe Weather:
Western Region (Information provided by the Western Region Climate Center)
- Precipitation was above normal across most of the Pacific Northwest, northern Great Basin, and portions of the northern Rockies of western Montana, and northwestern Wyoming. In the Pacific Northwest, a series of atmospheric rivers (AR) impacted Oregon and Washington during the month bringing a mix of heavy rain and some snow to the lowlands as well as heavy snowfall to the higher elevations of the Olympic Mountains and Cascade Range. The series of storms led to significant improvement in snowpack conditions across the mountain ranges of central and northern Idaho, Oregon, and Washington as well provided for continued drought amelioration in the region. Elsewhere in the West, drier-than-normal conditions prevailed across much of the southern half of the region with areas of southern Nevada and southeastern California experiencing record-dryness. In California, snowpack conditions deteriorated by the end of the month with the snowpack at 70% of normal statewide while most basins in Arizona, Colorado, New Mexico, and Utah ended January at normal to above-normal levels.
- In the Pacific Northwest, wetter-than-normal conditions prevailed in January as a persistent ridge of high pressure situated off the coast of California steered storm systems into the region including several ARs that brought heavy precipitation, strong winds, river flooding, and landslides to parts of the region. On the Olympic Peninsula of western Washington, the observing station at the Quillayute Airport reported measureable precipitation every day in January totaling 30.78 in (782 mm – 211% of normal) – making it the wettest January on record dating back to 1966. The series of ARs also provided a significant boost to the region’s snowpack which was well below normal at the beginning of the month. By the end of month, the basins (6-Digit HUC) of Washington were reporting at 89-97% of normal while Oregon’s basins were ranging from 83-110% of normal. Average temperatures were above normal for the region (+5.0º F, +2.8º C) with the greatest anomalies observed in eastern portions of Oregon and Washington as well as in southern Idaho where Boise was +6.2° F (3.4°C) above normal for the month – making it the fifth warmest January on record.
- Across California and Nevada, below-normal precipitation was observed with the exception of extreme northern portions of both states. In the southern half of California and Nevada, percent of normal precipitation was less than half of normal with some areas in southeastern California and southern Nevada experiencing record-dryness including at McCarren International Airport in Las Vegas, Nevada which observed no precipitation during the month and tied for the driest January on record. According to the California Cooperative Snow Surveys summary by region, the percentage of normal SWE (snow water equivalent) on January 31 was as follows: Northern Sierra/Trinity 75%, Central Sierra 69%, and Southern Sierra 66%. Despite the decline in the Sierra Nevada snowpack by the end of January, California’s major reservoirs remained at normal to above-normal levels as compared to historical averages.
- In other areas of the Intermountain West, drier-than-normal conditions were observed in northern and western Arizona, southern Utah, central Colorado, southeastern Wyoming, and central Montana. In north-central Colorado, Ft. Collins and Greeley both experienced their second-driest January on record. As of January 31, region-level (2-Digit HUC) SWE (percent of normal) was as follows: Upper Colorado 112%, Lower Colorado 115%, Rio Grande 102%, and Missouri 106%.
- In Alaska, colder-than-normal temperatures prevailed across the state in January with the greatest temperature anomalies observed in the following climate divisions: Bristol Bay (-13.8º F, -7.7º C), Cook Inlet (-11.8º F, -6.6º C), and Northwest Gulf (-10.8º F, -6.0º C). Statewide, it was the 13th coldest January on record with an average temperature of -6.2º F (-21.2º C), which was 8.4º F (4.6º C) below normal. In the Interior, McGrath observed its fourth coldest January on record with an average temperature of -24.4º F (-31.3º C), which was 17.9° F (9.9° C) below average. In Southeast Alaska, the multi-year drought came to end, according to the U.S. Drought Monitor.
- In the Hawaiian Islands, wetter-than-normal conditions prevailed across most of the Big Island, particularly in the districts of South Hilo, Puna, and Kau. On the windward side of the Big Island, the observing station, Hilo 5 S, reported 27.09 in (688 mm – 214% of normal) while the USGS rain gauge at the Saddle Road Quarry logged a monthly total of 56.41 in (1432.8 mm – 539% of normal). Elsewhere, near normal to above-normal precipitation was observed on Kauai and portions of the windward side of Maui while Lanai and Molokai were below normal. Average temperatures were a few degrees above normal across most of the island chain with notable departures on the windward side Big Island and on Kauai where Hilo had its warmest January on record and Lihue had its third warmest. Significant Events for January 2020
- Heavy precipitation, flooding, and landslides in the Pacific Northwest: January 2020 was the 12th wettest on record for the Northwest Climate Region and the fourth wettest on record for the state of Washington. The heavy precipitation throughout the month saturated soils causing flooding of rivers flowing out the Cascades Range in Washington as well as triggering numerous landslides that affected highway travel in western Washington and northwestern Oregon.
- January Arctic se ice extent well below average: According to National Snow & Ice Data Center, the January sea ice extent ranked as the ninth lowest (81% of average) in the satellite record.
- For more information, please go to the Western Regional Climate Center Home Page.