National Overview

November Highlights
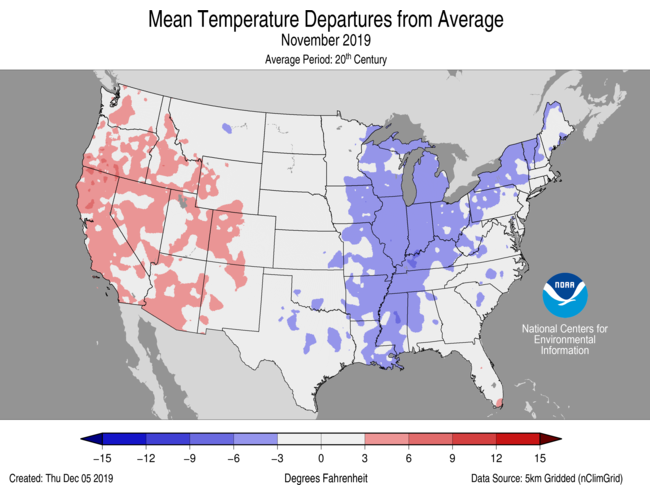
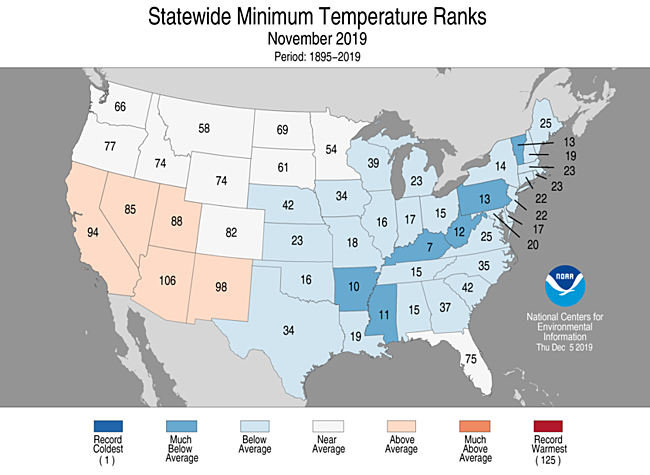
November Temperature
- The November contiguous U.S. average temperature was 41.2°F, 0.5°F below the 20th century average, ranking in the middle third of the November record.
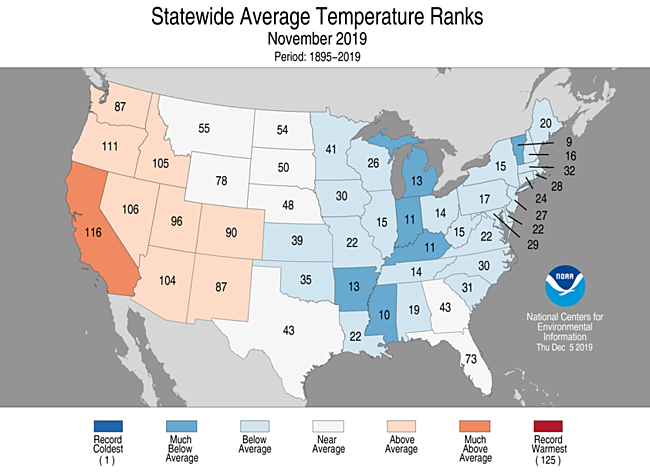
- Above- to much-above-average November temperatures were observed from the West Coast to the Rockies and across parts of southern Florida. California ranked tenth warmest and eight additional states across the West ranked above average for the month.
- Below- to much-below-average temperatures were present from the central U.S. to the East Coast. Average temperatures across Michigan, Indiana, Kentucky, Arkansas, Mississippi, and Vermont ranked among their coldest ten percent of Novembers on record.
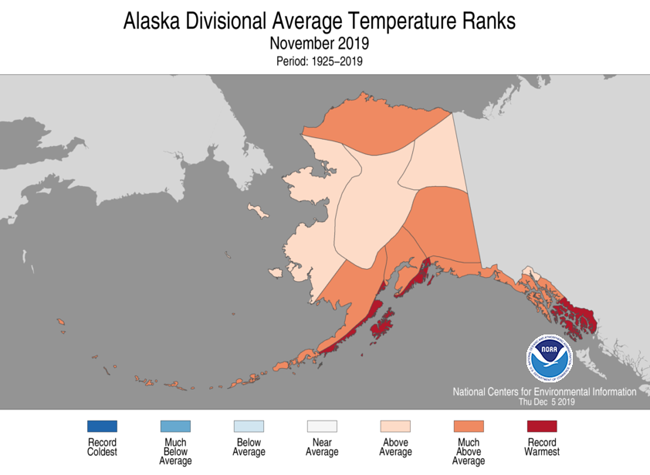
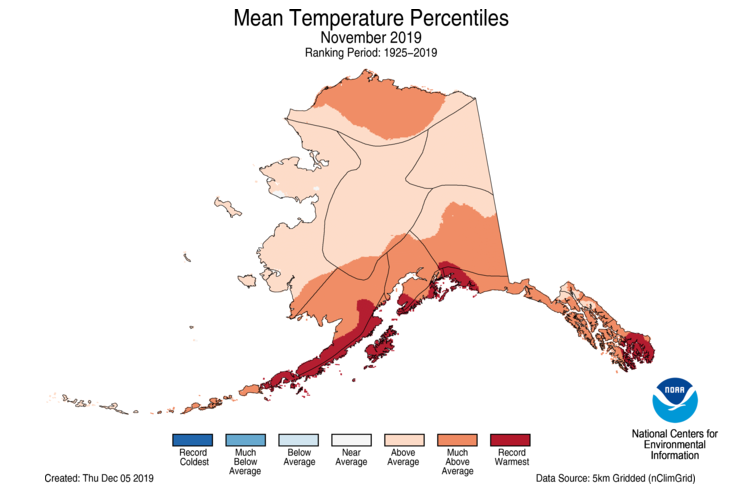
- The Alaska average November temperature was 19.9°F, 8.2°F above the long-term mean, ranking fourth warmest in the 95-year period of record for the state. Record warm conditions were observed across the Northwest Gulf and South Panhandle regions. Anchorage, Kodiak, Homer, and Cold Bay experienced their warmest November on record, while Utqiaġvik (Barrow) and King Salmon experienced their second warmest such month. Much of the state had monthly average temperatures well-above average for the month.
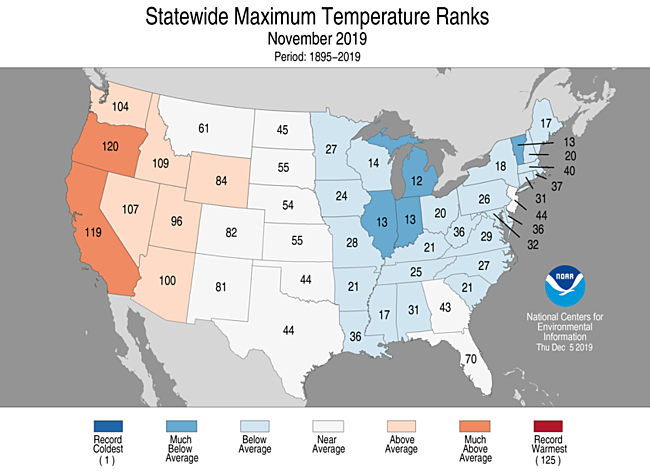
- The nationally averaged maximum temperature (daytime highs) was cooler than average during November at 52.5°F, 0.2°F below average, ranking in the middle third of the 125-year record. Oregon and California ranked sixth and seventh warmest for maximum temperatures in November, respectively, while parts of the Great Lakes and Northeast saw much-cooler than average daytime high temperatures.
- The nationally averaged minimum temperature (overnight lows) during November was 30.0°F, 0.7°F below average, ranking in the coolest third of the 125-year record. Six States from the lower Mississippi Valley into the Ohio Valley and the Northeast ranked in the coolest ten percent for November with above-average overnight low temperatures occurring in the West and Southwest.
- As of December 9, there were 5,272 cold daily high (2,451) and low (2,821) temperature records tied or broken during November. This is nearly four-times the number of warm records reported during the month. Approximately 1,391 daily warm high (737) and low (654) temperature records were set during the month.
- Based on NOAA's Residential Energy Demand Temperature Index (REDTI), the contiguous U.S. temperature-related energy demand during November was 31 percent above average and ranked 27th highest in the 125-year period of record.
November Precipitation
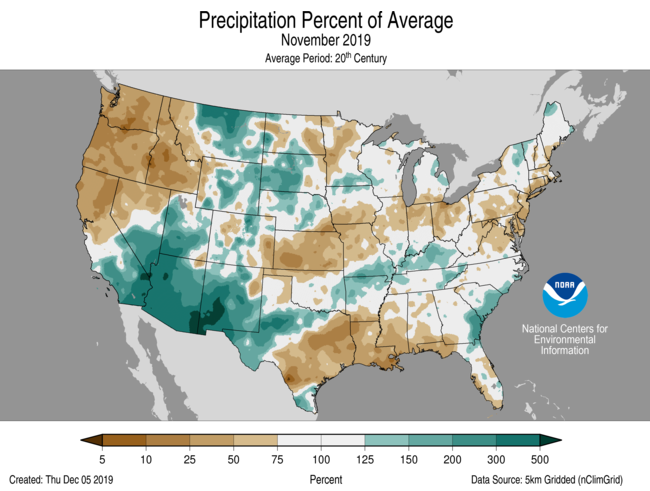
- The November precipitation total for the contiguous U.S. was 1.86 inches, 0.37 inch below average, ranking in the driest third of the 125-year period of record.
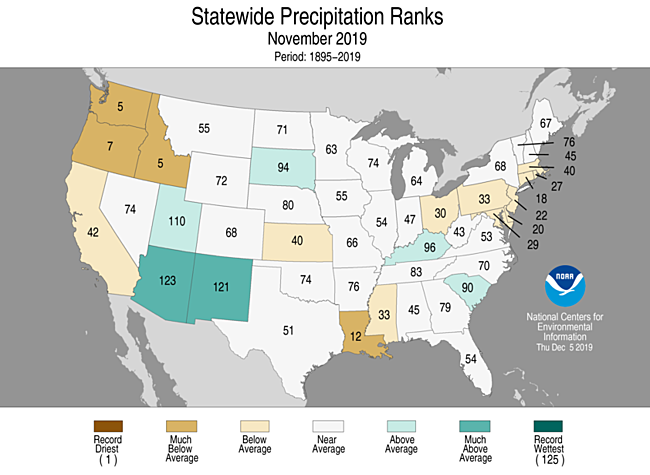
- Above-average precipitation was observed across the Southwest and parts of the Rockies, Great Plains, Ohio Valley, and coastal Southeast. Arizona ranked third wettest for November, while New Mexico ranked fifth wettest.
- A number of new rainfall records were set during November across Cochise, Pinal, Pima, and Graham Counties in southeast Arizona. The remnants of Tropical Storm Raymond and a mid-latitude low pressure system, which occurred during the last two weeks of the month, were major contributors to these record values.
- St. George, UT, had a record 155-day streak with no measurable precipitation beginning in mid-June 2019. On November 20, St. George received 1.29 inches of rainfall, breaking that dry streak and making November 2019 the wettest such month on record at this location.
- Below-average precipitation occurred across the Pacific Northwest, Deep South, and parts of the central Plains, Great Lakes, and mid-Atlantic to Northeast states. The states of Washington and Idaho ranked fifth driest, while Oregon ranked seventh driest for November.
- Between one and three feet of snow fell across portions of eight states the week of Thanksgiving impacting travel from California to New England.
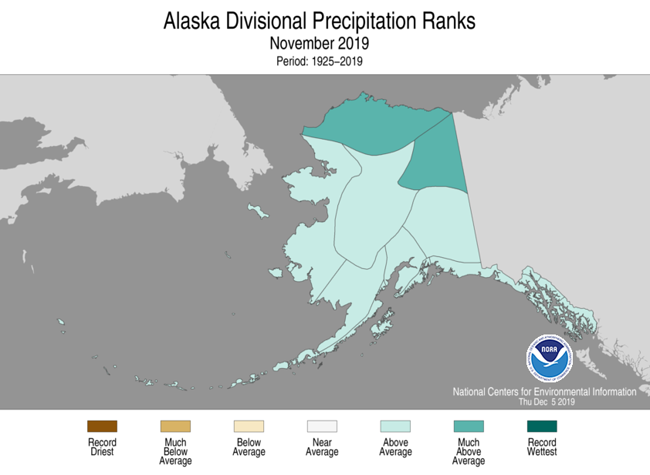
- In Alaska, it was the wettest November since 2005 at Ketchikan with 21.27 inches of precipitation reported. Much of the North Slope received record amounts of precipitation during the month. The Panhandle region received above-average precipitation over the last couple of months, which helped to alleviate some of the long-term severe drought conditions across the region.
- According to the December 3 U.S. Drought Monitor report, approximately 12 percent of the contiguous U.S. was in drought, down 6 percent from the end of October. Drought conditions expanded or intensified across parts of the southern to central Plains, southern Florida, Hawaii and southeastern Puerto Rico, while improvements were seen across the Southwest, Southeast, and parts of Texas, Ohio, and the mid-Atlantic region, as well as in the panhandle of Alaska.
Fall Highlights


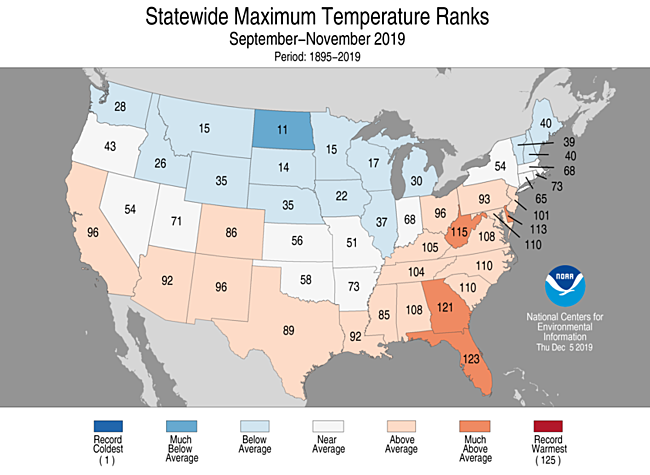
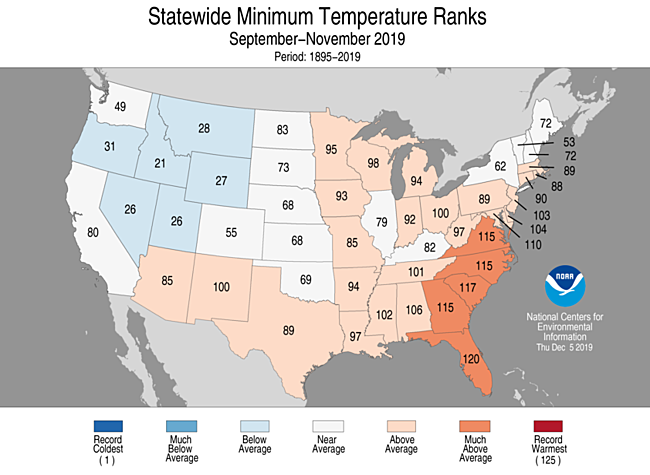
September-November Temperature
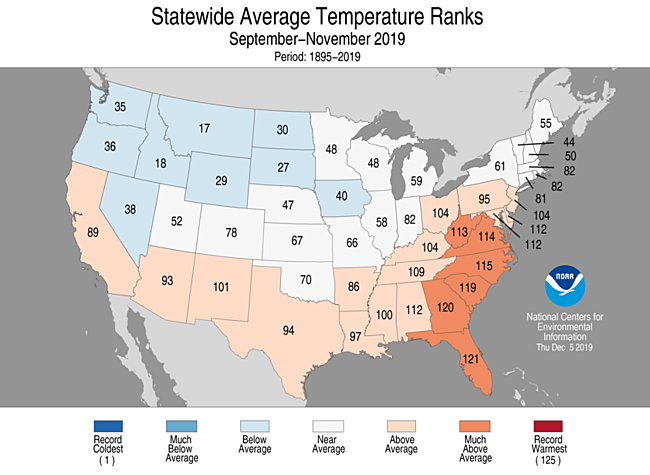
- During meteorological autumn (September-November), the average temperature for the Lower 48 was 53.9°F, 0.4°F above average, ranking in the middle third of the historical record.
- Above- to much-above-average autumn temperatures spanned from the West Coast to the Southwest and from the Gulf Coast to the mid-Atlantic region. Florida ranked fifth warmest while Georgia and South Carolina ranked sixth and seventh warmest, respectively.
- Below-average temperatures for autumn were observed from the Northwest into northern Plains and also across parts of New England. Montana and Idaho ranked 17th and 18th coldest on record, respectively.
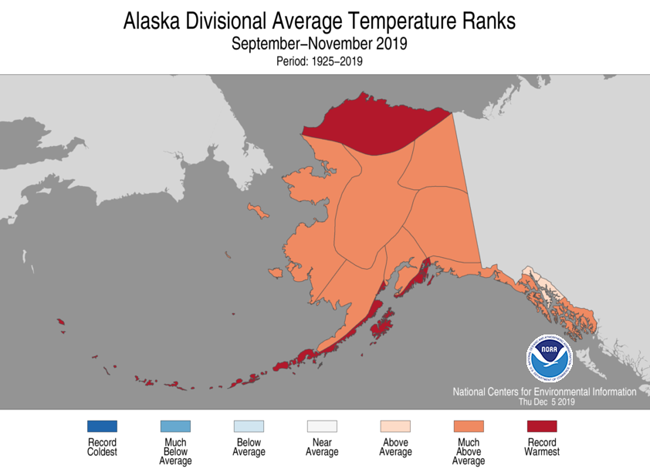
- The Alaska statewide average temperature for autumn was 31.7°F, 5.8°F above average and ranked as the fourth warmest such period on record. Record warm temperatures were observed across a large portion of the North Slope as well as the Aleutians and Northwest Gulf regions. Utqiaġvik had its warmest autumn on record with an average temperature of 28.8°F, 2.7°F warmer than the previous warmest autumn, in 2016.
- The contiguous U.S. average maximum (daytime) temperature during September-November was 65.8°F, which is virtually equivalent to the 20th century average, ranking in the middle third of the record. Above- to much-above-average maximum temperatures were observed from California into the Southwest and from Texas to Florida and into the mid-Atlantic. Florida's daytime high temperatures ranked third warmest for the autumn period. Below-average maximum temperatures were observed along the Northern Tier from Washington to the Great Lakes and into New England. North Dakota ranked 11th coldest during this season.
- The contiguous U.S. September-November minimum (nighttime) temperature was 42.0°F, 0.7°F above average, and ranked in the warmest third of the record. Above- to much-above-average minimum temperatures were observed across the South and from the Mississippi Valley to the East Coast. Florida ranked sixth warmest for overnight temperatures during autumn.
- Based on NOAA's Residential Energy Demand Temperature Index (REDTI), the contiguous U.S. temperature-related energy demand during September-November was 52 percent above average and ranked as the 11th highest value in the 125-year period of record.
September-November Precipitation
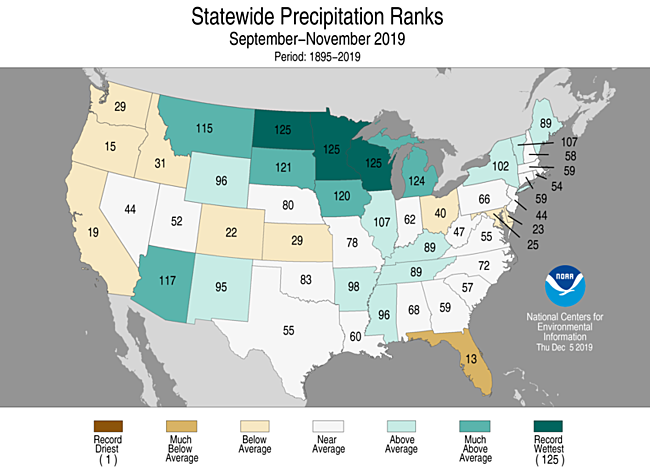
- The autumn precipitation total was 7.46 inches, 0.58 inch above average, ranking in the upper third of the historical record.
- Above- to much-above-average precipitation was observed from the northern Plains to the Great Lakes and across parts of the Southwest, Northeast, and mid-Mississippi Valley to Ohio Valley. North Dakota, Minnesota, and Wisconsin each had their wettest autumn on record with Michigan experiencing its second wettest such season on record. South Dakota, Iowa, and Arizona also ranked in the top ten wettest category.
- Much-below- to below-average precipitation was observed across parts of the West, central Rockies, central to southern Plains, and Ohio to mid-Atlantic coast, as well as Florida, where the autumn precipitation ranked as the 13th driest on record.
- Precipitation during autumn was much-above- to above-average across much of Alaska.
September-November Extremes
-
The U.S. Climate Extremes Index (USCEI) for autumn was below the long-term average and ranked in the middle third of the 110-year period of record. On a national scale, elevated extremes in wet PDSI were more widespread, while extremes in temperature were minimal, which contributed to this below-average value. The USCEI is an index that tracks extremes (falling in the upper or lower 10 percent of the record) in temperature, precipitation and drought across the contiguous United States.
- On the regional scale, extremes in wet PDSI contributed to above average CEI values across the Northeast, Upper Midwest, Ohio Valley, Northern Rockies and Plains, and the South. In addition, the Southeast experienced elevated extremes in warm maximum and minimum temperatures, while the Northern Rockies and Plains had double the average extent of extremes in cold maximum temperatures.
Year-to-Date Highlights
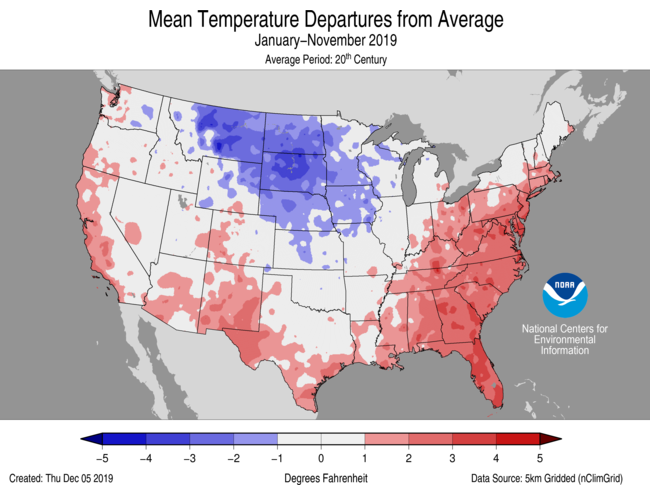

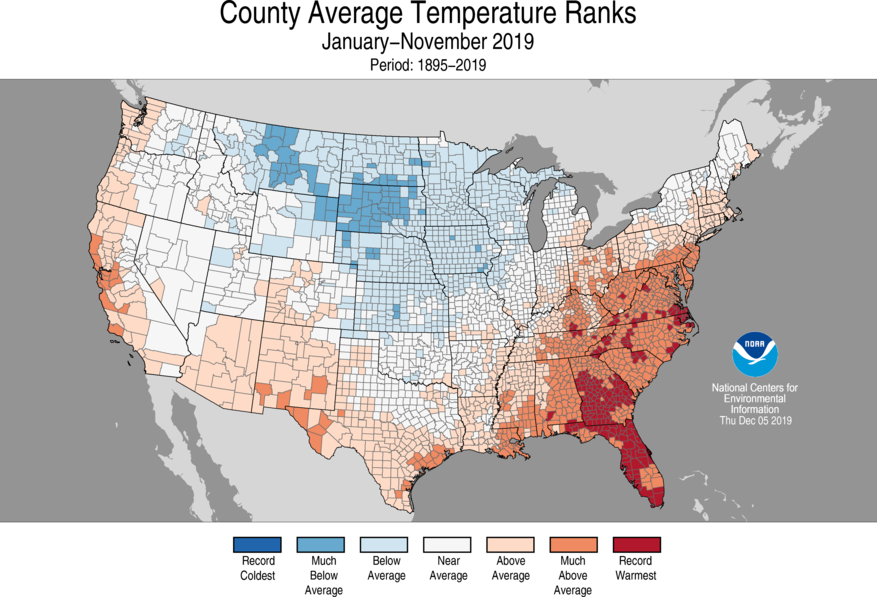
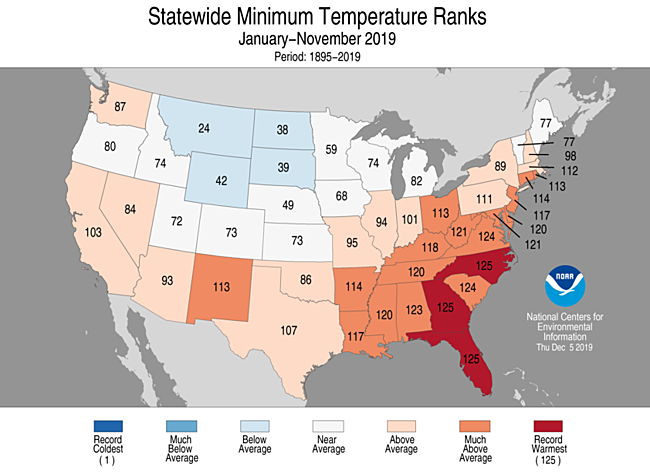
January-November Temperature
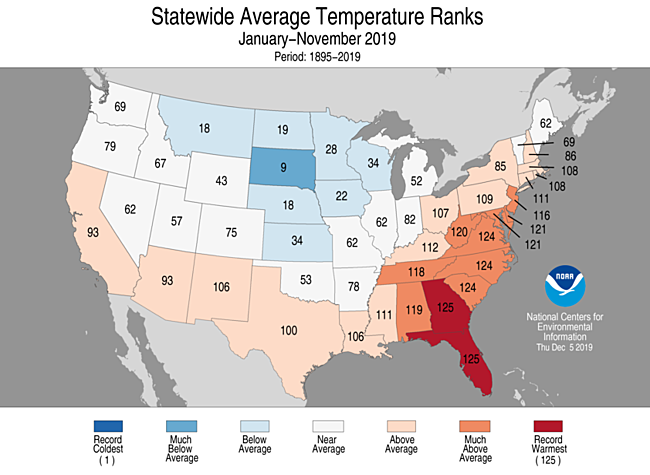
- For the year-to-date, the national temperature was 54.2°F, 0.4°F above average, ranking in the middle third of the historical record.
- Above- to much-above-average year-to-date temperatures were observed across portions of the West, Southwest, southern Plains, and from the Gulf of Mexico to parts of New England. The year-to-date average temperature for both Florida and Georgia ranked as the warmest such period on record while North Carolina, South Carolina, and Virginia ranked second warmest. Six additional Southeast and mid-Atlantic states had year-to-date temperatures in the top ten warmest category.
- Below- to much-below-average temperatures were observed across the northern and central Plains and Upper Midwest. South Dakota ranked ninth coldest for this year-to-date period.
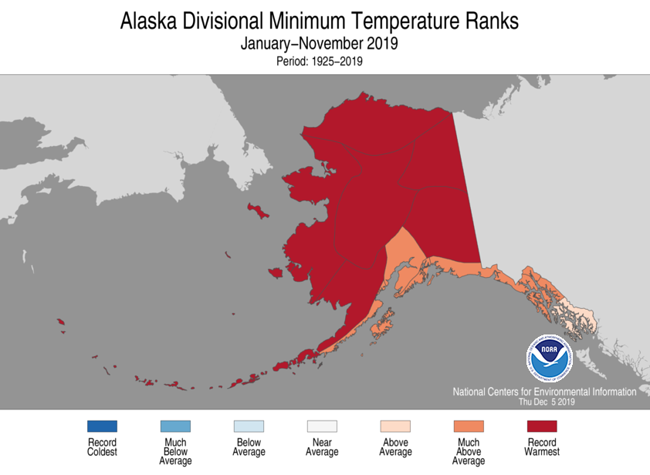
- Year-to-date statewide temperatures ranked record warm for Alaska, eclipsing the warmth of 2016 by 0.3°F. The average temperature for January-November was 34.5°F, which was 6.5°F above average.
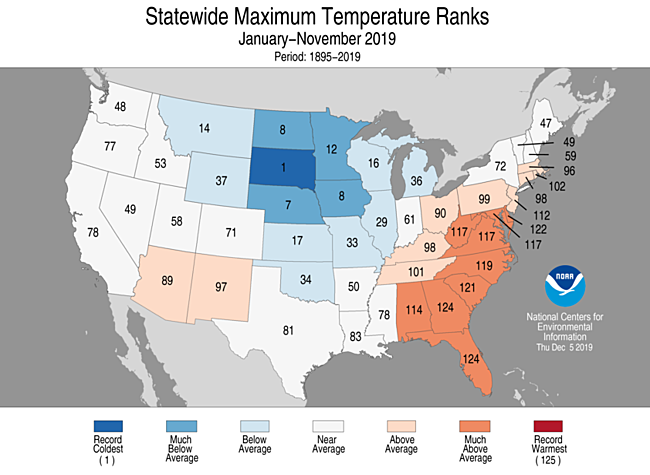
- The contiguous U.S. average maximum (daytime) temperature during January-November was 65.7°F, 0.2°F below the 20th century average, ranking in the middle third of the 125-year record. Above- to much-above-average maximum temperatures were observed across Arizona and New Mexico as well as across much of the Southeast, the mid-Atlantic, and parts of the Northeast. Below- to much-below-average maximum temperatures were observed across the northern and central Plains as well as the Great Lakes. South Dakota had average daytime temperatures for this year-to-date period which were record cold. Four additional states ranked in the bottom ten percent of maximum temperatures during this period.
- The contiguous U.S. January-November minimum (nighttime) temperature was 42.6°F, 1.0°F above average, and ranked in the upper third of the record. Above- to much-above-average minimum temperatures were observed from the West, to the South, and across the Southeast, Ohio Valley, and most of the East Coast. Minimum temperatures averaged across Florida, Georgia, and North Carolina were record warmest for this year-to-date period.
- Below-average overnight temperatures were observed across the Northern Rockies and Plains.
- Based on REDTI, the contiguous U.S. temperature-related energy demand during January-November was 17 percent above average and ranked in the lower third of the 125-year period of record.
January-November Precipitation
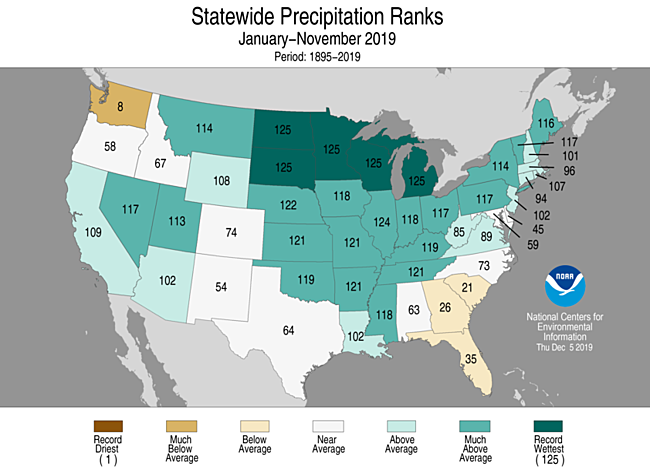
- The year-to-date precipitation total for the Lower 48 was 32.14 inches, 4.55 inches above average, ranking wettest on record. Six of the first eleven months of 2019 were wet for the contiguous U.S., as a whole, while regionally, parts of the northern Plains and Great Lakes were consistently wet throughout much of the year, contributing to the record wet accumulation for January–November.
- Above- to much-above-average January–November precipitation occurred in parts of the West as well as from the northern Rockies to the Gulf Coast and east into New England. North Dakota, South Dakota, Minnesota, Wisconsin, and Michigan ranked wettest on record for this year-to-date period. Sixteen other states ranked in the top ten wettest category.
- Below-average precipitation occurred across parts of the Southeast, southern Texas, New Mexico, and the coastal Northwest, with Washington state ranking eighth driest.
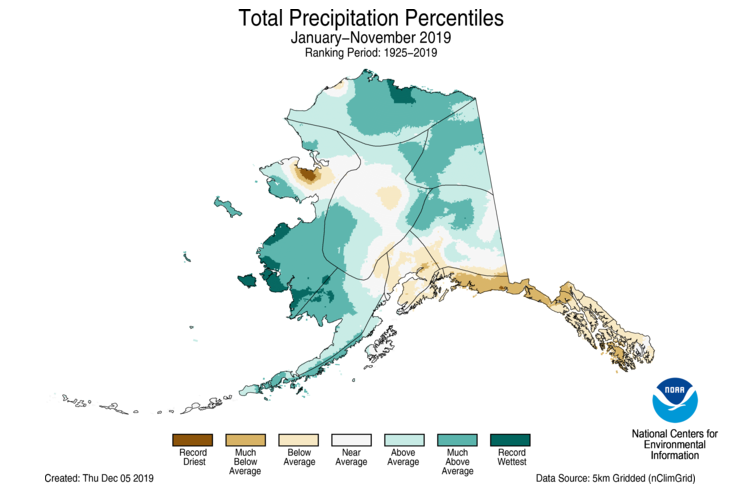
- January–November precipitation was wetter than average across much of southwestern Alaska as well as northern and eastern portions of the state. Drier-than-average conditions were present from the central Gulf to the Panhandle.
- The 12-month average precipitation across the contiguous U.S. for December 2018–November 2019 was 35.39 inches, 5.45 inches above average and the wettest December–November period on record. Four states ranked wettest for this 12-month period with 17 additional states, primarily across the central and eastern U.S., ranking top ten wettest for this period.
Extremes
- The USCEI for the year-to-date was 23 percent above average and ranked in the upper third of the 110-year period of record. Extremes in warm minimum temperatures, record wet PDSI, and 1-day precipitation contributed to this elevated value.
- On the regional scale, the Southeast experienced record- to near-record extent in warm maximum and minimum temperatures, whereas the Northern Rockies and Plains had a top ten extent for cold maximum temperatures averaged over the first eleven months of 2019. Record wet PDSI values were present across the Northeast, Ohio Valley, Upper Midwest and across the South.
Regional Highlights
These regional summaries were provided by the six Regional Climate Centers and reflect conditions in their respective regions. These six regions differ spatially from the nine climatic regions of the National Centers for Environmental Information.
Northeast Region (Information provided by the Northeast Regional Climate Center)
- The Northeast had its 15th coldest November on record with an average temperature of 35.0 degrees F (1.7 degrees C), which was 4.4 degrees F (2.4 degrees C) below normal. For the first time since March 2019, all twelve Northeast states had a below-normal monthly average temperature. Departures ranged from 5.5 degrees F (3.1 degrees C) below normal in Vermont to 3.3 degrees F (1.8 degrees C) below normal in Massachusetts. This November ranked among the 20 coldest on record for six states: Vermont, ninth coldest; New York, 15th coldest; West Virginia, 16th coldest; New Hampshire, 17th coldest; Pennsylvania, 18th coldest; and Maine, 20th coldest. With mild conditions in September and October but a cold November, the autumn season averaged out to near normal for the Northeast. The region’s average temperature of 50.0 degrees (10.0 degrees C) was 0.2 degrees F (0.1 degrees C) warmer than normal. The states were split, with five being colder than normal, five being warmer than normal, and two at normal. Departures ranged from 1.1 degrees F (0.6 degrees C) below normal in Vermont to 1.9 degrees F (1.1 degrees C) above normal in West Virginia. This autumn was the 13th hottest on record for West Virginia and the 15th hottest for Delaware and Maryland.
- November was a drier-than-normal month in the Northeast. The region received 2.92 inches (74.17 mm) of precipitation, which was 76 percent of normal. Precipitation for the twelve Northeast states ranged from 43 percent of normal in Delaware to 97 percent of normal in Vermont. This November ranked among the 20 driest on record for two states: Connecticut had its 18th driest and Delaware had its 20th driest. The Northeast experienced a dry September and November but a wet October. With that, the region averaged 10.98 inches (278.89 mm) of precipitation for autumn, which was 95 percent of normal. State precipitation ranged from 66 percent of normal in Delaware to 112 percent of normal in Vermont, making it the state’s 19th wettest autumn.
- The U.S. Drought Monitor released on November 7 showed lingering areas of abnormal dryness in West Virginia, Maryland, Delaware, southern Pennsylvania, New Jersey, and southeastern New York, totaling 5 percent of the Northeast. During November, dryness eased in New York and continued to improve in the other states. The U.S. Drought Monitor released on November 27 showed 2 percent of the region as abnormally dry.
- In the early morning hours of November 1, the temperature in Caribou, Maine, reached 68 degrees F (20 degrees C), tying the site’s hottest November temperature on record. A strong cold front blasted through shortly after, sending temperatures plummeting. Several sites experienced their first fall frost during the first eight days of November. This year’s frost was among the 10 latest on record for Albany and Syracuse, New York; Hartford, Connecticut; Dulles Airport, Virginia; and Allentown and Williamsport, Pennsylvania. However, LaGuardia Airport, New York, had its eighth earliest frost on record. A storm system brought snow to portions of the region on November 11 and 12. Due to the storm and lake-effect, Rochester, New York, received 14.0 inches (35.6 cm) of snow, which ranked as the site’s third snowiest two-day period for November. Islip, New York, reported measurable snow [0.1 inches (0.3 cm)] on November 12, almost a full month earlier than usual, which tied as the site’s fourth earliest measurable snow on record. Behind the storm system, more cold air poured into the region. On November 13, Watertown Airport, New York, tied its coldest November temperature on record (since 1949) with a low of -7 degrees F (-22 degrees C). It was also the earliest subzero temperature on record for the site. On November 17, Caribou had its earliest below-zero temperature with a low of -1 degree F (-18 degrees C), which also tied as the ninth coldest November temperature on record for the site. The following day, on November 18, Caribou had a low of 0 degrees F (-18 degrees C), and those back-to-back days were the earliest consecutive days of 0 degrees F (-18 degrees C) or colder on record. On November 27 and 28, wind gusts of up to 68 mph (30 m/s) downed trees and powerlines in the region. There were minor disruptions to Thanksgiving travel and celebrations due to power outages, closed roads, and flight delays.
- For more information, please visit the Northeast Regional Climate Center Home Page.
Midwest Region (Information provided by the Midwest Regional Climate Center)
- November precipitation in the Midwest had alternating bands of above- and below-normal precipitation. Two bands of above-normal precipitation stretched from west to east, one from southern Missouri to Kentucky and the other from the Iowa-Minnesota border to northern and central Michigan. Two bands of below-normal precipitation stretched from much of Missouri and Iowa into northern Ohio and from northern and central Minnesota into northern Wisconsin. Totals ranged from less than 50 percent of normal to more than 150 percent of normal. Regionwide the precipitation averaged 2.26 inches (57.4 mm) which was 0.52 inches (13.2 mm) below normal. Much of the November precipitation fell in the last 10 days of the month when more than 80 percent (168 of 204) of the daily precipitation records were recorded in November. Fall (September to November) precipitation was well above normal in the northern half of the region and mostly near normal in the southern half. Totals for the region averaged 11.56 inches (293.6 mm) in the fall which was 2.33 inches (59.2 mm) above normal and ranked as the 11th wettest in history (1895-2019). Minnesota and Wisconsin set new records for wettest November while Michigan (2nd) and Iowa (6th) also ranked among the wettest in their histories. This despite all Midwest states except Kentucky recording below-normal precipitation in November.
- November temperatures averaged below normal across the Midwest. Regionwide values were 33.6 degrees F (0.9 C) which was 4.9 degrees F (2.7 C) below normal. The coldest readings were in the center of the region, stretching from the southern half of Lake Michigan to western Kentucky. Very cold temperatures to start the month eased slightly before another cold snap from the 11th to the 16th followed by more seasonal temperatures and then a warm final week in November. For the month, more than 1700 record low daily temperatures were set with all but a dozen occurring by the 16th. The daily record lows were nearly evenly split between record low maximum and minimum temperatures. In contrast, there were fewer than 20 record high temperatures in November. Fall temperatures were within 2 degrees F (1 C) of normal across the Midwest. The average across the region was 50.5 degrees F (10.3 C) which was 0.3 degrees F (0.2 C) below normal. Warmth in September was largely offset by the cold in November.
- Snowfall in November was above normal across most of the Midwest and well above normal in the southeastern half of the region. Amounts of 1 to 3 inches (3 to 8 cm) were common across Iowa, Illinois, Indiana and Ohio, with 6 to 12 inches (15 to 30 cm) across southern Wisconsin, Lower Michigan and Minnesota. Lake-effect areas, especially in Upper Michigan, received 2 to 3 feet (61 to 91 cm) of snow during the month, with locally heavier amounts. The presence of snow in the Ohio River Valley was rare for November. A one-day snowfall total of over 1.0 inches (2.5 cm) occurred in Paducah, KY, Bowling Green, KY and Lexington, KY on November 11. A snowfall of that amount in November only occurs once or twice every ten years on average in these cities.
- Two significant storms impacted the Midwest over the Thanksgiving holiday weekend from November 26th to 30th. At the start of the holiday weekend, heavy snow fell across the Upper Midwest. Strong wind gusts over 50 miles per hour (80 km per hour) were also recorded on November 27th. These storms led to more than a foot of snow in parts of northern Minnesota, northern Wisconsin and the U.P. of Michigan. Then at the end of the weekend, heavy rain drenched the southern half of the region. More than four inches of rain fell across parts of Kentucky.
- Moderate drought areas in the southeastern Midwest at the end of October were reduced and then eliminated by the November 12th U.S. Drought Monitor. By the end of November, only a small area of southeastern Kentucky was considered abnormally dry and that area was also eliminated as of the December 3rd report.
- The slow harvest season continued well into November in the Midwest as the impacts of a delayed planting season continued. The soybean harvest neared completion by mid-November, but corn harvesting was 10 to 30 percent behind the five-year average by mid-month in every state except Kentucky according to USDA NASS. By the end of November, a third of the corn crop remained unharvested in Wisconsin and Michigan. Increased snowfall in the Upper Midwest hampered progress, while drier weather across the central Corn Belt allowed much of the harvest to wrap up by the end of the month.
- For further details on the weather and climate events in the Midwest, see the weekly and monthly reports at the Midwest Climate Watch page.
Southeast Region (Information provided by the Southeast Regional Climate Center)
- Temperatures were near average to above average in Florida and Puerto Rico during November, while below-average temperatures were observed across Alabama, Georgia, the Carolinas, and Virginia. Very few extremes in monthly mean temperature were recorded across the Southeast. Indeed, nearly 90 percent of the 197 long-term (i.e., period of record equaling or exceeding 50 years) stations observed November mean temperatures that were ranked outside their five warmest or coolest values on record. San Juan, PR (1898-2019) tied its second warmest November mean temperature on record at 82.1 degrees F (27.8 degrees C). The warmest weather of the month occurred on the 27th, as unusually warm and humid air surged northward ahead of an approaching cold front. Daytime maximum temperatures reached or exceeded 70 degrees F (21 degrees C) across portions of every state except Virginia. Asheville, NC (1869-2019) reported a daytime maximum temperature of 76 degrees F (24 degrees C), which was the warmest temperature of record for late November. In contrast, the coldest weather of the month occurred on November 12th - 14th, as a continental high pressure system ushered in unseasonably cold air from the northwest. Daily minimum temperatures fell below 32 degrees F (0 degrees C) across portions of every state, including Florida. Niceville, FL (1927-2019) reported a daily minimum temperature of 26 degrees F (-3 degrees C), and Mt. Mitchell, NC (1925-2019) reported a daily minimum of 1 degree F (-17 degrees C).
- Precipitation was variable across much of the Southeast region during November. The wettest locations were found in the eastern portions of the Carolinas, southeastern Georgia, and pockets of Alabama and Florida. Monthly precipitation totals ranged from 100 to 200 percent of normal in these areas. There were 5 long-term stations that observed more than 6 inches (152 mm) of precipitation for November, including Muscle Shoals, AL (1893-2019; T-4th wettest November) at 7.95 inches (202 mm), and Savannah, GA (1871-2019; 2nd wettest November) at 6.19 inches (157 mm). On November 15th and 16th, a slow-moving low pressure system produced over 3 inches (76 mm) of rainfall across portions of northeastern Florida and southeastern Georgia. As a result, Savannah, GA (1871-2019) and Jacksonville, FL (1871-2019 observed their second wettest maximum daily precipitation for November at 4.1 inches (104 mm) and 3.2 inches (81 mm) of rain, respectively. In contrast, unusual dryness was found in northern Virginia, western North Carolina southern Alabama and parts of the Florida Panhandle, where the precipitation values ranged from 70 to less than 25 percent of normal. Niceville, FL (1927-2019) only reported 0.96 inches (24 mm) of precipitation for the month, which was about 4 inches (102 mm) below normal. Puerto Rico also reported below normal precipitation, with Guayama (1911-2019) only observing 1.7 inches (43 mm) of rain. Some light snowfall was reported across portions of the northern tier, with Mt Mitchell (1925-2019) observing 1.6 inches (41 mm) and Richmond, VA (1871-2019) observing 0.9 inches (23 mm), on November 12th.
- There were only 13 severe weather reports across the Southeast during November, which is less than a quarter of the median monthly frequency of 55 reports during 2000-2018. There were 6 confirmed tornadoes reported for the month, half the monthly average of 11. Most of these tornadoes were ranked EF-0 and resulted in some minor damage to buildings and downed trees. The most damaging tornado was rated an EF-1 with winds of 95 mph (42 m/s) and occurred in Chesapeake, VA. On the morning of November 27th, a severe thunderstorm tracked across southern Alabama, and an area of rotation produced 3 weak EF-0 tornadoes, as the cell moved across Pike County and southwest Barbour County. No injuries or fatalities were reported with any of the tornadoes. There were 6 severe wind reports for the month, all associated with a squall line that came through Alabama on November 27th. There were also 2 reports of quarter-sized hail in Alabama.
- Overall drought conditions have improved for the month of November, with no areas of extreme drought (D3). By the end of the month, pockets of severe drought (D2) were observed in northern Georgia. Moderate drought (D1), ringed by an area of dry conditions (D0), decreased in coverage through western South Carolina, Georgia, central Alabama and northern Florida. Drought conditions were gone from Virginia and North Carolina, however abnormally dry conditions (D0) were reported throughout the interior of each state. Puerto Rico continues to have an area of dry conditions (D0) covering the southern area. Citrus-producing counties in Florida received little to no rainfall, as abnormally dry conditions covered the complete southern part of the state. Therefore, irrigation was run across this citrus growing region. In North Carolina, the harvest has been completed for most crops, though wet weather and high seed moisture content has slowed the field work. The early November freeze in Moore County, NC has damaged some of the recently planted strawberries. Farmers in Georgia are worried that there will not be enough hay due to the autumn drought, which caused some to feed early. The rains in November have provided better winter grazing for pastures in Alabama.
- For more information, please visit the Southeast Regional Climate Center Home Page.
High Plains Region (Information provided by the High Plains Regional Climate Center)
- The month of November brought wet and snowy conditions to portions of the region, especially late in the month. Two large storm systems tracked across the High Plains region during the last week of November. These systems brought widespread precipitation, including heavy snow, and strong winds to a large portion of the region. This created significant travel issues for many that were traveling for the Thanksgiving holiday. However, the month started off very dry for much of the region as the High Plains continued its relatively dry streak that began in late October. Despite the dryness, the two large systems that came through in the latter part of the month brought enough precipitation to compensate for the dryness experienced early in the month in some places. Drought conditions continued to expand across portions of Kansas and Colorado during the month, where precipitation remained well below normal. In general, temperatures were near normal during the month of November.
- Crop harvest remained well behind schedule across the northern areas of the High Plains region. Even with the help of drier conditions, especially during the first half of the month, farmers across North Dakota and South Dakota continued to struggle getting their crops out of the ground. Particularly hard hit were sugar beets, sunflowers, and corn. As of December 1st, only 36 percent of corn had been harvested in North Dakota, and 80 percent in South Dakota. Sunflower harvest was at 51 percent in North Dakota and 71 percent in South Dakota as of December 1st. The wet and snowy pattern that began in October led to incredibly wet soils that were too muddy or inundated to be able to harvest crops. Only as consistently colder temperatures began to freeze and harden the soil were some agriculture producers able to get back into the fields to harvest their crops. It is likely that some crops will not get harvested until spring, or perhaps not harvested at all, due to poor field conditions.
- Temperatures across much of the High Plains were generally near normal for the month of November, with departures within 2.0 degrees F (1.1 degrees C) of normal. There was, however, areas of the region that experienced greater departures. For instance, portions of central and southeastern Kansas had departures of 4.0-6.0 degrees F (2.2-3.3 degrees C) below normal. On the other hand, temperature departures of up to 6.0 degrees F (3.3 degrees C) above normal were observed further west across western areas of Colorado and Wyoming. With most areas experiencing a relatively mild month as a whole, there was not a significant number of monthly record high or record low temperatures.
- Although the month of November did not feature a large number of record monthly temperatures, a noteworthy, cold air mass in the middle of the month brought temperatures near 0.0 degrees F (-17.8 degrees C) in many spots and caused several locations to set new daily record lows. Some locations even recorded temperatures that were well below 0.0 degrees F (-17.8 degrees C). One location that experienced this cold blast was Wichita, Kansas, where temperatures bottomed out at a record low of 8.0 degrees F (-13.3 degrees C) on the 12th. This broke the old record of 9.0 degrees F (-12.8 degrees C), which occurred in 1911 (period of record 1888-present). As for fall temperatures on the whole, there were only a few noteworthy records. The following locations ranked among the top 10 of coolest falls: Rapid City, SD (3rd coolest); Casper, WY (6th coolest); and Pierre, SD (tied for 8th coolest). However, while there were few fall temperature records, the extremes of the season were masked because September temperatures were above normal for much of the region, while October temperatures were well below normal.
- Precipitation varied across the High Plains region during the month of November. Across western sections of the High Plains there were areas that observed widespread precipitation amounts of 150 percent of normal, with embedded pockets where amounts were up to 200 percent of normal. Meanwhile, in other parts of the region, precipitation amounts for the month were generally below normal with under 25 percent of normal precipitation being observed. Several locations in Wyoming and South Dakota ranked in the top 10 wettest Novembers on record, including Casper, WY (2nd wettest); Cheyenne, WY (5th wettest); Mobridge, SD (5th wettest); and Lander, WY (6th wettest). November was also a snowy month for some areas of the region. Several locations had monthly totals that ranked among the top 10 snowiest Novembers on record, such as Cheyenne, WY (6th snowiest); Hastings, NE (6th snowiest); Pierre, SD (6th snowiest); and Goodland, KS (10th snowiest).
- During the last week of the month, two large storm systems tracked across the High Plains. The first system arrived on the 26th and brought a swath of heavy snow and strong winds to portions of Colorado, much of Nebraska, and southeastern South Dakota. Snow totals from this system ranged from 4.0-12.0 inches (10-30 cm) in this area. Then, on the heels of the first system that week, on November 29-30, a particularly strong storm system brought heavy precipitation and strong winds to the northern High Plains. The combination of plentiful moisture and sub-freezing temperatures created significant snowfall over much of eastern Wyoming, northwestern Nebraska, South Dakota, and southern North Dakota. In these areas, snow totals were generally in the 6.0-18.0 inch (15-48 cm) range, with the exception of the Black Hills area of South Dakota where up to 30.0 inches (76 cm) of snowfall was observed. Very strong winds also occurred with this system, creating near whiteout conditions and prompting the issuance of blizzard warnings.
- Both systems created major travel issues as they hit in the middle of the Thanksgiving holiday week. The first storm system was responsible for closing I-80 in both directions in Nebraska from Kearney to York for several hours on the evening of the 26th due to snow covered roads and poor visibility. A very similar scenario occurred with the second system on the 29th as additional snowfall and very strong winds created whiteout conditions and prompted additional road closures.
- Mountain snowpack got off to a good start this month across all of Colorado and much of Wyoming. This has helped keep drought conditions from worsening and lowers concerns for low water levels. By the end of November snowpack was above normal across all of the basins in Colorado and almost all of the basins in Wyoming. Across the Upper Missouri Basin, mountain Snow Water Equivalent (SWE) was near to slightly above normal. As of December 1st, mountain SWE was 101 percent of normal above Fort Peck and 114 percent of normal in the reach from Fort Peck to Garrison, according to the U.S. Army Corps of Engineers. The month of November also brought plentiful snowfall to much of the Plains as well by the month’s end, with the highest snowpack found across much of Nebraska, Colorado, and Wyoming.
- Drought conditions continued to expand and intensify across southern and western portions of the High Plains region during the month of November. According to the U.S. Drought Monitor, the area experiencing drought (D1-D4) in the High Plains region increased from approximately 13 percent at the end of October to just over 15 percent by the end of November. This increase included the expansion of drought in areas of southern and western Colorado and southwestern Kansas where precipitation deficits have continued to worsen over the past several months.
- This month, abnormally dry conditions (D0) continued to expand across portions of western Kansas and into portions of southwestern Nebraska. D0 remained nearly unchanged in parts of southwestern Wyoming. Some improvement was observed over northern Colorado during the month, with a reduction of abnormally dry conditions in this area. Meanwhile, across southern Colorado and western Kansas, moderate drought (D1) expanded through the month of November, while severe drought (D2) also expanded across some portions of this same area. A small pocket of extreme drought (D3) also developed across southwestern Kansas during the month.
- The remainder of the region was free of drought and abnormally dry conditions. As of the November 26th release of the U.S. Drought Monitor, both Nebraska and South Dakota continued their streak of being drought-free all of 2019.
- For more information, please visit the High Plains Regional Climate Center Home Page.
Southern Region (Information provided by the Southern Regional Climate Center)
- Temperatures for the month of November were below normal across the Southern Region. Parts of western Tennessee, northeastern Arkansas, northern and southern Mississippi, and south-central Louisiana experienced temperatures 6 to 8 degrees F (3.33 to 4.44 degrees C) below normal. Parts of eastern, central, and western Tennessee; eastern, central, and western Arkansas; northern, central, and southern Mississippi, southern and central Louisiana; southwestern and northeastern Oklahoma; and central, eastern, and southern Texas experienced temperatures 4 to 6 degrees F (2.22 to 3.33 degrees C) below normal. Parts of eastern Tennessee, southern Mississippi, western and southern Arkansas, northern, western, and southeastern Louisiana, most of Oklahoma, and most of Texas experienced temperatures 2 to 4 degrees F (1.11 to 2.22 degrees C) below normal. Conversely, parts of western Texas experienced temperatures 0 to 2 degrees F (0.00 to 21.11 degrees C) above normal. The statewide monthly average temperatures were as follows: Arkansas – 46.20 degrees F (7.89 degrees C), Louisiana – 54.50 degrees F (12.50 degrees C), Mississippi – 49.90 degrees F (9.94 degrees C), Oklahoma – 46.30 degrees F (7.94 degrees C), Tennessee – 44.20 degrees F (6.78 degrees C), and Texas – 53.20 degrees F (11.78 degrees C). The statewide temperature rankings for November were as follows: Arkansas (fourteenth coldest), Louisiana (twenty-third coldest), Mississippi (tenth coldest), Oklahoma (thirty-sixth coldest), Tennessee (sixteenth coldest), and Texas (forty-fourth coldest). All state rankings are based on the period spanning 1895-2019.
- Precipitation values for the month of November were primarily below normal across the Southern Region. Parts of northern Oklahoma, southern Arkansas, southern and western Mississippi, northern, western, southern, and southeastern Louisiana, and eastern, central, and southern Texas received 50 percent or less of normal precipitation, while parts of western, southern, and southeastern Louisiana as well as eastern, central, and southern Texas received 25 percent or less of normal precipitation. In contrast, parts of north-central, western, and southern Texas; northern Arkansas, and eastern Tennessee received 150 percent or more of normal precipitation, while parts of north-central, southern, and western Texas received precipitation 200 percent or more of normal. The statewide precipitation totals for the month were as follows: Arkansas – 4.60 inches (116.84 mm), Louisiana – 1.64 inches (41.66 mm), Mississippi – 2.63 inches (66.80 mm), Oklahoma – 2.17 inches (55.12 mm), Tennessee – 4.50 inches (114.30 mm), and Texas – 1.33 inches (33.78 mm). The state precipitation rankings for November were as follows: Arkansas (fiftieth wettest), Louisiana (twelfth driest), Mississippi (thirty-third driest), Oklahoma (fifty-second wettest), Tennessee (forty-third wettest), and Texas (fifty-first driest). All state rankings are based on the period spanning 1895-2019. Drought and Severe Weather:
- At the end of November, drought conditions both improved and deteriorated across the Southern Region. Extreme drought conditions persisted across southern Texas, while areas in central and southern Texas experienced improvement. Severe drought classifications were still present in central and southern Texas as well as southwestern Oklahoma, while new areas developed in extreme western Oklahoma. However, severe drought conditions improved across eastern and southern Texas, and these conditions were removed in southeastern Tennessee. Moderate drought classifications decreased across eastern, central, and southern Texas; southwestern Arkansas, northwestern and northeastern Louisiana, and southeastern Tennessee, while new areas developed in extreme western and southwestern Oklahoma as well as northern and eastern Texas. There was an increase in the overall area experiencing abnormally dry conditions despite improvement across central Arkansas, southwestern Mississippi, and eastern Tennessee. This was due to an increase in abnormally dry conditions across western and southwestern Oklahoma; northern, western, and eastern Texas; and southwestern Arkansas.
- In November, there were a total of 36 storm reports across Oklahoma, Texas, Arkansas, Louisiana, and Mississippi. There were 9 tornado reports, 18 hail reports, and 9 wind reports. Louisiana tallied the most tornadoes (5), while Mississippi tallied the most hail (9) and wind (6) reports. Mississippi tallied the most reports (19), while Tennessee had zero reports. All 36 reports occurred over three days (15 on November 26, 4 on November 29, and 17 on November 30). Only two states (Louisiana and Mississippi) reported tornadoes, every state (with the exception of Tennessee) had at least 1 hail report, and three states (Louisiana, Mississippi, and Texas) had at least 1 wind report.
- On November 26, 2019, there were 15 severe weather reports across Louisiana and Mississippi, with 9 tornado reports and 6 wind reports. Two people were injured in Franklin Parish, Louisiana after a tornado rolled a trailer, injuring the occupants. Strong winds resulted in several homes reporting roof damage as well as the destruction of a barn near Dubbs, Mississippi.
- On November 29, 2019, hen egg-sized hail was reported near Inola, Oklahoma.
- On November 30, 2019, there were 17 severe weather reports across Arkansas, Texas, Louisiana, and Mississippi. A wind gust of 67 mph (107.83 kph) was estimated near Wills Point, Texas, resulting in roof damage. There were reports of trees blown down by strong winds near Calvin, Louisiana and Redwater, Mississippi.
- For more information, please visit the Southern Regional Climate Center Home Page.
Western Region (Information provided by the Western Region Climate Center)
- November was drier than normal for the Pacific Northwest extending south into northern California and Nevada. For much of the southern part of the region precipitation was well above normal with exceptionally wet conditions in southeast California, southern Nevada, Arizona and New Mexico. Temperatures were above normal across most of the region with the greatest departures observed in the higher elevations of the Sierra Nevada and Cascades due to extended periods of high pressure causing strong temperature inversions. Locations east of the Rocky Mountains experienced below-normal temperatures for the month.
- An active weather pattern persisted for nearly the entire month in Montana east of the Rocky Mountains leading to well above normal, and in some cases record breaking, precipitation in the region. Galta 16 SW, Montana saw its wettest November on record since 1949 with 2.57 inches (65.3 mm; 559% of normal) of precipitation – shattering the previous record of 1.58 inches (40.1 mm) set in 1966. With below-normal temperatures in the region, the monthly snowfall record at Galta was also broken with 26 inches (660 mm) reported. Further to the southeast, Fort Benton, Montana had its 8th wettest November since 1895 with 1.36 inches (34.5 mm; 257% of normal) of precipitation recorded.
- High pressure centered off the central coast of British Columbia persisted throughout the month causing below-normal precipitation in the Pacific Northwest. Record dryness occurred in Boise, Idaho with only 0.12 inches (3 mm; 9% of normal) of precipitation observed, which broke the record dating back to 1940. Seattle, Washington, where November is the wettest month of the year, logged 1.71 inches (43.4 mm; 26% of normal) of precipitation making it the 4th driest November since 1945. Likewise, the lack of precipitation led to below normal snowpack accumulations across parts of the Cascades where the snow water equivalent (SWE) was record low for the end of the month. Park Creek Ridge SNOTEL in the Upper Columbia River Basin, Washington, set a record low on November 30 with a SWE value of 1.2 inches (30.5 mm; 13% of normal) with measurements beginning in 1977.
- After an extended dry spell in the Four Corners region, active weather returned during the second half of November. St. George, Utah, ended a record 155-day dry streak on November 20 when 1.29 inches (32.8 mm) of rain fell making it the wettest November day on record since 1893. The same storm system brought heavy snowfall to the mountains northeast of St. George including at the Webster Flat SNOTEL which had its second greatest November 30 SWE value in 40 years at 8.8 inches (223.5 mm) which is 59% of the Water Year median peak that occurs in late March. Southern California, southern Nevada, and Arizona also benefitted from late November storms with stations in all three states setting monthly precipitation records. Notable was the 7.05 inch (179.1 mm; 712% of normal) monthly total at Coronado National Monument, Arizona where records date back to 1960.
- For the month, Northern California was the one location with numerous stations reporting in the top ten warmest average monthly temperatures and some records were also broken. Whiskeytown Reservoir reported a monthly average temperature of 59.8 °F (15.4 C), a +7.9 °F (4.3 C) departure from normal, which set a new record with data back to 1960. On the west slope of the northern Sierra Nevada, Blue Canyon saw its 7th warmest November at 50.4 °F (10.2 °C), 6.5 °F (3.6 °F) above normal, since records began in 1944. While some pockets of below-normal temperatures were found in the region, there were no notable anomalies or monthly record lows.
- In Alaska, above-normal temperatures persisted across the entire state. Southcentral, Kodiak Island, and the Kenai Peninsula saw the greatest departures with many monthly record high average temperatures set. Anchorage recorded a new record with a mean monthly temperature of 35.7 °F (2.1 °C), a +13.5 °F (7.5° C) departure from normal. Likewise, Kodiak set a new record with a mean monthly temperature of 42.6 °F (5.9 °C), a +8.7 °F (4.8 °C) departure from normal while Homer set a new record with a mean monthly temperature of 39.8 °F (4.3 °C)– a +10.3 °F (5.7 °C) departure from normal. Off the northwest coast of Alaska, the Chukchi Sea ice extent was the lowest on record for the month of November. For the Hawaiian Islands, most of the island chain saw below-average monthly precipitation with the exception of Kauai where many stations were 100-125% of normal. Maui was the driest of the islands where only 0.21 inches (5.3 mm) of precipitation was recorded at Kahului Airport, 10% of normal and the 6th driest on record. The continued dryness in Hawaii led to large areas of moderate to extreme drought in the U.S. Drought Monitor at the end of November. Significant Events for November 2019
- November 26-28: Strong winter storm impacts Thanksgiving travel in California:Strong winds, heavy rain, and mountain snow caused major travel delays throughout the state during some of the busiest travel days of the year. From the Grapevine and I-5 in southern California to I-80 in the northern Sierra Nevada, heavy snow caused many delays and several closures of the roads occurred during the storm event.
- November 29: Flash flood in Arizona:Heavy precipitation over a short time period caused many small streams and roadways to flood. A family of seven in a large vehicle attempted to cross recently flooded Tonto Creek in eastern Arizona after heavy rainfall. Of the seven, four were rescued while one remains missing and two were found dead on November 30.
- For more information, please go to the Western Regional Climate Center Home Page.