National Overview

June Highlights
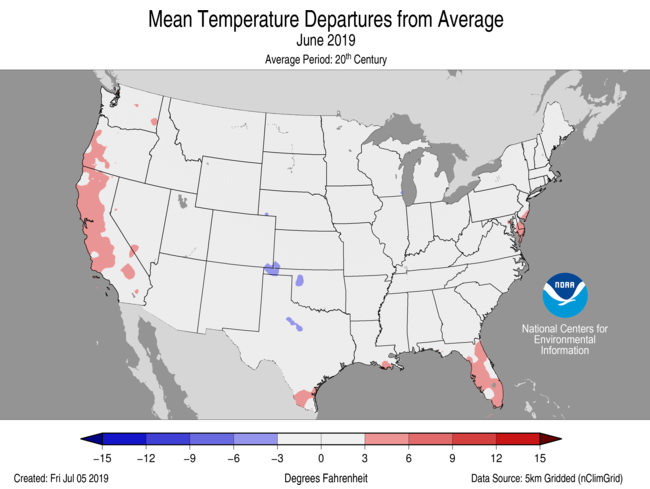

June Temperature
- The June contiguous U.S. temperature was 68.7°F, 0.2°F above the 20th century average, ranking in the middle third of the 125-year record.
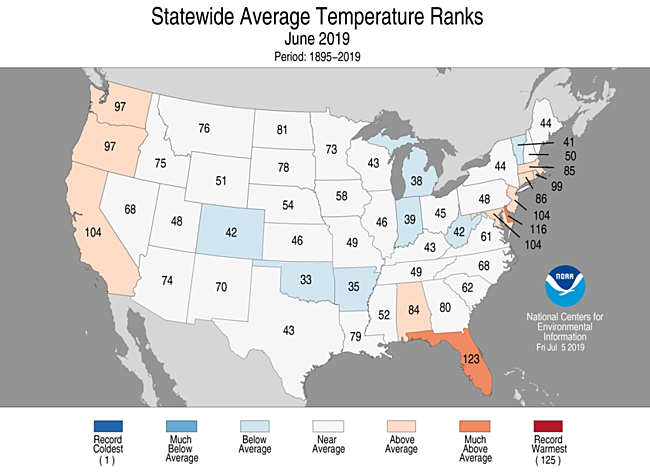
- Above- to much-above-average June temperatures were observed across 11 states, along the Pacific Coast, the Gulf Coast, and part of the mid-Atlantic and New England coast, with Florida experiencing its third warmest June on record.
- Below-average June temperatures were scattered across the central Rockies, central to southern Plains, the Ohio Valley to Great Lakes and into parts of the Northeast.
- The Alaska average June temperature was 54.0°F, 4.8°F above the long-term mean and the second warmest June on record for the state.
- Kotzebue, Anchorage, Talkeetna, and Yakutat each had their warmest June on record.
- On June 30, Northway reported a high temperature of 92°F, eclipsing the 50-year-old all-time record high temperature of 91°F, which occurred on June 15, 1969.
- The high temperature at Utqiaġvik (Barrow) on June 20 was 73°F, which is a record for the month of June.
- Extremely warm sea surface temperatures across the Bering and Chukchi seas contributed to the lowest mean ice extent on record for June.
- The nationally averaged maximum temperature (daytime highs) was relatively mild during June at 81.2°F, 0.2°F below average, ranking in the middle third of the 125-year record. Several coastal states had a June maximum temperature that was warmer than average, while parts of the central Plains, Ohio Valley, Great Lakes, and Northeast were cooler than average.
- The nationally averaged minimum temperature (overnight lows) during June was 56.2°F, 0.6°F above average. Florida had a June minimum temperature that ranked record warmest for the month. Minimum temperatures were decidedly warmer than maximum temperatures during June.
- As of July 10, there were 2,062 cold daily high (1,154) and low (908) temperature records tied or broken during June. This was roughly 80% of the approximately 2,557 daily warm high (809) and low (1,748) temperature records set during the month.
- Based on NOAA's Residential Energy Demand Temperature Index (REDTI), the contiguous U.S. temperature-related energy demand during June was 3 percent above average and ranked in the middle third of the 125-year period of record.
June Precipitation

- The June precipitation total for the contiguous U.S. was 3.30 inches, 0.37 inch above average, and ranked in the upper third of the 125-year period of record.
- Above- to much-above-average precipitation was observed from the Deep South, through the Mississippi and Ohio valleys, and along much of the East Coast.
- Kentucky ranked third wettest, Ohio was fifth wettest, and Tennessee ranked eighth wettest for June.
- Flooding persisted along many of the major river systems and their tributaries across the central U.S. including the central and lower Mississippi River, the Missouri River, as well as the Illinois River.
- As astronomical spring transitioned into summer in the Northern Hemisphere on June 21, an intense low pressure system brought more than a foot of snow to parts of the northern and central Rockies.
- Below-average precipitation was observed across six states in the West as well as North and South Dakota.
- According to the July 2 U.S. Drought Monitor report, 3.2 percent of the contiguous U.S. was in drought, down from 5.3 percent at the beginning of June. Drought conditions worsened across parts of the Pacific Northwest and Puerto Rico. Many large wildfires impacted portions of interior Alaska during June, where recent dry conditions contributed to an abundance of wildfire fuels. Drought conditions improved across much of the Southeast, parts of the Southwest, as well as across Hawaii.
Billion-Dollar Weather and Climate Disasters
- Through the end of June, six weather and climate disaster events have been identified to date, with losses exceeding $1 billion each across the U.S. during 2019. These events included four severe storm events and two flooding events.
- Since these records began in 1980, the U.S. has sustained 250 separate weather and climate disasters where overall damages/costs reached or exceeded $1 billion (based on the CPI adjustment to 2019) per event. The total cost of these 250 events exceeds $1.7 trillion.
Year-to-Date Highlights

January-June Temperature
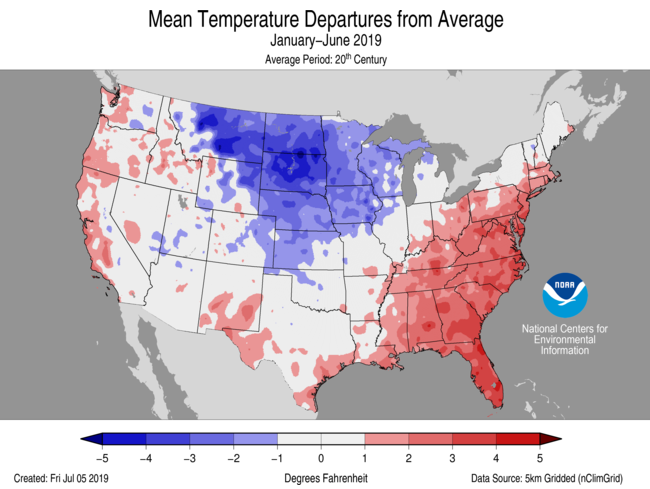
- The first half of 2019 was marked by large regional differences in temperature, but when averaged, the contiguous U.S. average temperature was 47.6°F, 0.1°F above the 20th century average, and ranked in the middle third of the January–June record.
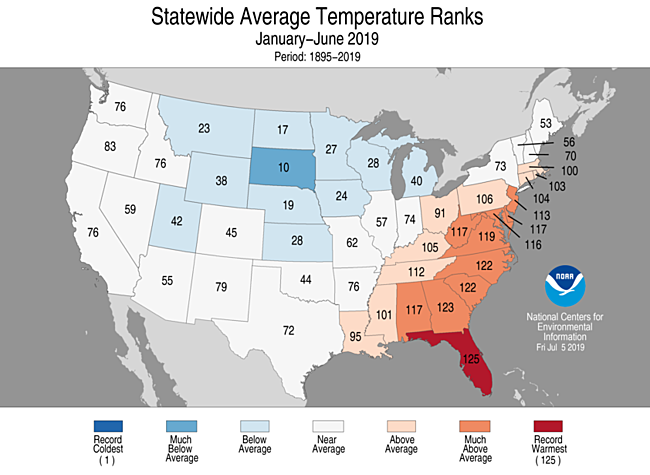
- Above- to much-above-average January–June temperatures were observed from Louisiana to New England. Nine states across the Southeast and mid-Atlantic had a top 10 warmest year-to-date period with Florida ranking warmest on record. Below-average temperatures were observed from the Rocky Mountains to the Great Lakes with South Dakota ranking tenth coolest for January–June.
- The Alaska statewide average temperature for the year-to-date period was 29.2°F, 7.9°F above average, and ranked as the second warmest on record. Record warm temperatures were observed across western and northern areas of the state, with above- to much-above-average temperatures across the interior and southeastern portion of Alaska. Through June, Utqiaġvik (Barrow) has experienced its warmest year-to-date on record.
- The contiguous U.S. average maximum (daytime) temperature during January-June was 58.2°F, 0.6°F below the 20th century average, ranking in the lower third of the 125-year record. Above-average maximum temperatures were observed across the Southeast, Ohio Valley, and the mid-Atlantic, with Florida ranking 3rd warmest for the first half of 2019. Below-average maximum temperatures were observed from the Great Basin to the Great Lakes and into parts of New England. South Dakota ranked 5th coolest during this period.
- The contiguous U.S. January-June minimum (nighttime) temperature was 36.5°F, 0.8°F above average, and ranked in the upper third of the record. Above-average minimum temperatures were observed across the West, the South, and from the Gulf Coast through the Ohio Valley and into the Northeast. Below-average temperatures were contained from the northern Rockies and Plains to the Great Lakes.
- Based on REDTI, the contiguous U.S. temperature-related energy demand during January-June was 14 percent below average and ranked in the lowest third of the 125-year period of record.
January-June Precipitation
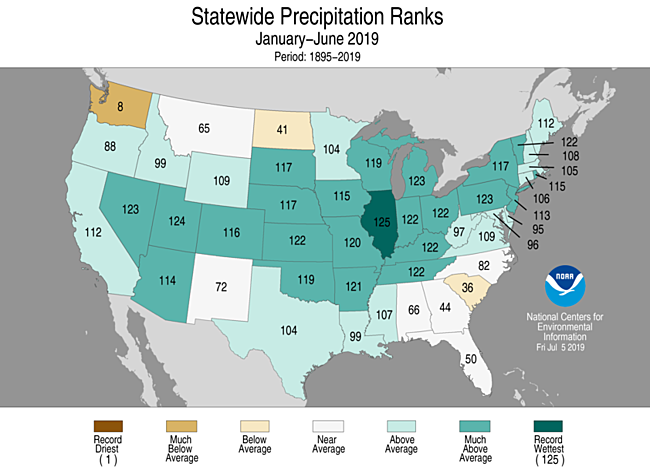
- For the year-to-date, the precipitation total was 19.05 inches, 3.74 inches above average, and the wettest such period in the 125-year record.
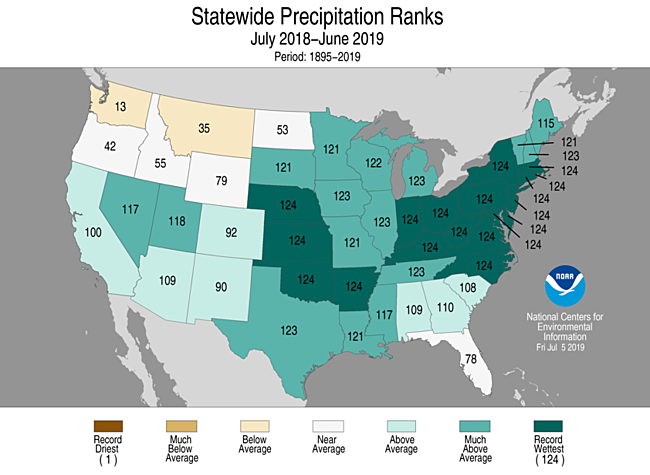
- Average precipitation across the contiguous U.S. for July 2018–June 2019 was 37.86 inches, 7.90 inches above average, and broke a record, exceeding the July-June record of 35.11 inches, which occurred from July 1982-June 1983.
- In addition, this new record also exceeded the previous all-time 12-month period on record set at the end of May 2019.
- The previous all-time 12-month record was 37.72 inches and occurred from June 2018–May 2019.
- The all-time 12-month record prior to this was 36.31 during May 2018–April 2019.
- Above-average precipitation blanketed much of the contiguous U.S. during this year-to-date period. Illinois ranked wettest, while 11 additional states had a top five January–June.
- Below-average precipitation was observed in Washington state, which ranked eighth driest, South Carolina, and North Dakota.
Extremes
- The USCEI for the year-to-date was 45 percent above average and ranked 15th highest in the 110-year period of record. Extremes in wet PDSI and the number of days with precipitation contributed to this elevated value. The component that examines wet PDSI was the third highest on record and the number of days of precipitation was record highest.
- On the regional scale, the Northeast, Ohio Valley, and Southeast regions experienced above average CEI values, due to wet PDSI, extremes in 1-day precipitation, and the number of days with precipitation. In addition, the Ohio Valley and Southeast experienced an abundance of extreme warm minimum temperatures. In contrast, the Northwest region ranked 6th lowest CEI value for the first half of 2019.
Regional Highlights
These regional summaries were provided by the six Regional Climate Centers and reflect conditions in their respective regions. These six regions differ spatially from the nine climatic regions of the National Centers for Environmental Information.
Northeast Region (Information provided by the Northeast Regional Climate Center)
- The Northeast’s June average temperature of 64.5 degrees F (18.1 degrees C) was 0.7 degrees F (0.4 degrees C) colder than normal. The twelve states were split, with six being colder than normal and six being warmer than normal. Average temperature departures for the twelve states ranged from 1.3 degrees F (0.7 degrees C) below normal in Vermont to 1.7 degrees F (0.9 degrees C) above normal in Delaware, making it the state’s 10th warmest June on record.
- The Northeast had its 16th wettest June since 1895 with 4.94 inches (125.48 mm) of precipitation, which was 117 percent of normal. Eleven of the twelve states received above-normal precipitation, with Pennsylvania having its 17th wettest June on record and Vermont having its 18th wettest. Precipitation for all states ranged from 77 percent of normal in Connecticut to 131 percent of normal in Pennsylvania.
- Historically, June tends to be one of the most active months for severe weather in the Northeast, averaging 10 tornadoes (based on 1989-2013 data). However, the June 2019 tornado count was slightly lower than average at seven: three in Pennsylvania, two in New Jersey, and one each in Maryland and West Virginia. Tornado activity was below or near normal for each state except New Jersey. Preliminary data indicated Pennsylvania’s January through June tornado count was 34, making it one of the most active years for tornadoes on record. The greatest annual tornado count was in 1998 with 59 tornadoes. Straight-line winds of up to 100 mph (45 m/s) were also reported during the month. The severe storms caused damage to hundreds of trees. With wet antecedent conditions, near- to above-normal streamflow, saturated soil, and heavy rainfall, there were several instances of flash flooding during June. One notable period was from June 18 to 21 when some areas, particularly parts of New Jersey, Pennsylvania, and New York, received as much as 3 to 7 inches (76 to 178 mm) of rain. From June 19 to 20, Philadelphia, Pennsylvania, had its greatest two-day rainfall total for any June on record with 4.63 inches (117.60 mm). Around 4 inches (102 mm) of that, more than the site averages during all of June, fell within a three-hour period. In response, waterways rose quickly. Preliminary data indicated the North Branch Rancocas Creek at Pemberton, New Jersey, had its second highest crest on record at 4.45 feet (1.36 m). The record crest was 4.91 feet (1.50 m) after Hurricane Irene on August 29, 2011. As water submerged roads and entered homes, there were evacuations and water rescues. Another significant flash flood event happened from June 29 to 30 in western Maryland and eastern West Virginia when some areas received up to 5 inches (127 mm) of rain in just a few hours. Bayard, West Virginia, recorded 4.71 inches (119.63 mm) of rain on June 30, making it their second wettest day on record behind September 19, 2003 with 5.15 inches (130.81 mm). The Baltimore-Washington National Weather Service (NWS) issued a rare Flash Flood Emergency for Bayard. A few miles downstream, preliminary data indicated the North Branch of the Potomac River at Steyer, West Virginia, rose nearly 8 feet (2.4 m) in two hours and reached major flood stage. Storm reports from West Virginia indicated there were evacuations and water rescues, some homes were pushed from their foundations, and roads were closed due to high water, mudslides, or damage. In early June, Lakes Erie and Ontario had their highest beginning-of-the-month water levels on record (since 1918). High water levels continued to cause flooding and erosion along shorelines and problems for boaters on those lakes and the St. Lawrence River during June.
- For more information, please visit the Northeast Regional Climate Center Home Page.
Midwest Region (Information provided by the Midwest Regional Climate Center)
- June precipitation for the Midwest ranged from less than half of normal in parts of Upper Michigan to more than twice normal in parts of southern Indiana, central Kentucky, and northeastern Ohio. Rain in Kentucky in June was enough to offset developing dryness coming into the month. Drier than normal conditions in Iowa, southern Minnesota, and Wisconsin eased the excessive wetness from earlier in the year. Northern Minnesota had been drier and the lack of moisture there expanded the dry areas.
- June temperatures averaged near to slightly below normal in the Midwest. Statewide temperatures were in the range of 0 to 2 degrees F (0 to 1 C) below normal. The month began with a warm week followed by cooler temperatures for a couple weeks mid-month and then much warmer temperatures to end June. There were fewer than 100 daily record highs recorded in the region and about 350 daily record lows. Most of the daily record lows were record low maximum temperatures.
- Severe weather affected locations all across the Midwest in June. Severe weather was reported on 29 of 30 days in June with more than 100 reports on nine days and another ten days with at least 10 reports. The majority of the reports were for high winds associated with strong thunderstorms. There were also more than 360 reports of large hail including a couple dozen reports of hail with diameters of 2 inches (5 cm) or more. Seventy-four reports of tornadoes spread across eight of the nine Midwest states sparing only Michigan. There were two fatalities in June in the region attributed to falling trees, one each in Kentucky and Illinois. Two others were injured in Iowa when winds destroyed a mobile home.
- Flooding in the region eased in June but the long-lived event hung on with moderate flooding still in some locations on the Missouri, Mississippi, Illinois, Ohio, and Wabash rivers. Minor flooding continued at many locations in the southern half of the region.
- The Midwest remained completely free of drought through June. This marked the six-month point of the streak (27 straight weeks as of July 2, 2019) which began at the beginning of 2019. The streak is easily the longest such streak for the Midwest since the inception of the US Drought Monitor in 2000. There was some dryness in Kentucky and northern Minnesota as June began but generous rains in Kentucky led to the removal of all abnormally dry regions in the state during the month. Areas of abnormally dry conditions in northern Minnesota expanded in June.
- For further details on the weather and climate events in the Midwest, see the weekly and monthly reports at the Midwest Climate Watch page.
Southeast Region (Information provided by the Southeast Regional Climate Center)
- Temperatures were near average across the Southeast and Puerto Rico for the month of June, except the Florida peninsula, which was above average. Monthly mean temperatures were within 1 degree F of normal (0.5 degrees C) for 40 percent of the 140 long-term (i.e., period of record equaling or exceeding 50 years) stations across the region. However, several stations in Florida ranked in the top five warmest month of June on record including: Miami, FL (1895-2019; 3rd warmest), Gainesville, FL (1890-2019; 2nd warmest) and Plant City, FL (1892-2019; 1st warmest). Maximum temperatures ranged from 4.2 degrees F (2.1 degrees C) below normal in Elizabeth City, NC (1934-2019) to 5.7 degrees F (2.8 degrees C) above normal in Columbia, SC (1887-2019). Minimum temperatures ranged from 5.1 degrees F (2.5 degrees C) below normal at Washington Reagan Airport, VA (1871-2019) to 4.6 degrees F (2.3 degrees C) above normal in Charlotte, NC (1878-2019). During the first half of the month, the Bermuda high pressure system shifted eastward, allowing a series of fronts to approach the region and stall out. The coolest temperatures occurred on June 12th, as cool air wedged its way under the moist air resulting in high temperatures across Virginia, North Carolina, and South Carolina 7 to 12 degrees F (3.5 to 6 degrees C) below normal. Daytime high temperatures were only in the 70s F (20s C) for most of the area including: Raleigh, NC (1887-2019) and Suffolk, VA (1945-2019) at 77 degrees F (25 degrees C), and Newberry, SC (1893-2019) and Saluda, SC (1902-2019) at 74 degrees F (23.3 degrees C). The minimum temperatures were cool too, Charlotte, NC (1878-2019) recorded a low of 49 degrees F (9.4 degrees C) on June 14th, which was the coolest June minimum temperature since 2000. During the second half of the month, the Bermuda high pressure system shifted slightly westward to the East Coast allowing for temperatures to warm back up to normal. Due to drier weather, parts of the Florida peninsula saw maximum temperatures well above normal on June 24-25th including: Miami, FL (1895-2019) at 98 degrees F (37 degrees C) on the 24th, and Tampa, FL (1890-2019) at 98 degrees F (37 degrees C) on the 25th. Both places tied their second warmest monthly maximum temperature on record.
- Precipitation was highly variable across the Southeast region during June, which is common during the summer. The driest locations were found across southern and eastern North Carolina, northern South Carolina, northern and southern areas of Alabama, southern Florida, and north-central Puerto Rico. Monthly precipitation totals were 70 to less than 25 percent of normal in these areas. Guayama, PR (1911-2019) only reported 0.89 inches (23 mm) of precipitation for the month of June, which was 4.29 inches (109 mm) below normal making it the 3rd driest June on record. In contrast, the wettest locations were found across eastern Virginia, western North Carolina, southern South Carolina, and central Georgia. Monthly precipitation totals were 150 to more than 300 percent of normal in these areas. A few long-term stations observed June precipitation totals that were ranked within their five highest values on record, including: Commerce, Georgia (1957-2019) 3rd wettest, Emporia, VA (1893-2019) 2nd wettest, and Grandfather Mountain, NC (1955-2019) and Cross City, FL (1948-2019), both ranking 1st wettest on record. The approach of a slow-moving upper level system coupled with a stationary frontal zone across the region brought wet and unsettled weather conditions June 7-10th. Flash flooding resulted in three fatalities in the foothills of North Carolina after high floodwaters caused a car to hydroplane off the road and into a tree. Parts of western North Carolina and central Georgia saw over 3 inches (76 mm) of rain in a single day including: Mount Mitchell, NC (1925-2019; 3.89 inches on the 10th), and Atlanta, GA (1878-2019; 3.9 inches on the 8th) and over 5 inches (127 mm) of rain within 2-days including: Grandfather Mountain, NC (1955-2019; 7.98 inches on the 7-8th) and Athens, GA (1898-2019; 5.09 inches on the 7-8th), Rain caused flooding issues across Wake Forest, Rolesville, and Durham, NC, where small sections of U.S. 401 were washed away.
- There were 1,001 severe weather reports across the Southeast during June, which is 136 percent of the median monthly frequency of 735 reports during 2000-2018. About 95 percent (954 of 1,001) of the severe weather reports during the month were for strong thunderstorm winds, and nearly half (436 of 954) of these reports occurred on June 20th. Some of the highest wind gusts that were recorded included: 78 mph (35 m/s) at Duck Pier in Dare, NC, and 79 mph (35 m/s) winds reported across Columbia, SC, which led to one fatality due to a falling tree. There were 2 tornadoes reported for the month, much less than the average of 12 for June. The first tornado occurred on June 6th in Dallas County, Alabama. It reached a maximum intensity of 75 mph (34 m/s) and was rated EF-0. The tornado snapped small trees and a home sustained damage when the carport was lifted upward off its supports. The second tornado occurred on June 8th in Rutherford County, North Carolina. It reached a maximum intensity of 75 mph (34 m/s) and was rated EF-0, as well. The tornado made a brief touchdown and uprooted several trees. There were only 45 reports of hail, which is half of the 90 average reports for the month of June. Two lightning fatalities were reported: lightning struck a motorcyclist driving along interstate 95 in Ormond Beach, Florida on June 9th, and on June 16th a 59-year old man was struck by lightning north of Mobile, Alabama.
- Drought conditions decreased across the region for the month of June. At the beginning of the month, severe drought (D2) covered 2.8 percent of the region, including a small area of southern South Carolina and southern Georgia. By the end of the month, D2 conditions were limited to 0.5 percent of the region. There was a significant decrease in moderate drought (D1) and abnormally dry (D0) conditions during the month, with decreases from 29.8 percent to 6.4 percent of the region and 54.7 percent to 29.2 percent to 15.5 % of the region, respectively. Puerto Rico saw an increase in moderate drought conditions from 15.5 percent of the region at the beginning of the month to 32.2 percent of the region by the end of the month. Heavy rainfall at the beginning of the month contributed to the flooding of fields and increased weed and disease pressure on crops, especially across parts of the western Carolinas and northern Georgia. Farther to the south and east, dryness and heat at the end of the month led to stressed crop fields, livestock pastures, and hayfields in portions of Alabama and the southern coast of North Carolina. Georgia’s watermelon season has begun, and growers report that after two years of unpredictable and extreme weather patterns, this growing season is off to a productive start.
- For more information, please visit the Southeast Regional Climate Center Home Page.
High Plains Region (Information provided by the High Plains Regional Climate Center)
- Following a spring full of extremes, the summer season began more quietly across the High Plains. Temperatures and precipitation varied throughout the region during June but did not deviate very far from normal. However, impacts from the spring flooding, as well as ongoing cool and wet conditions, were evident. For instance, many roads remained closed from the extensive flooding that occurred across eastern portions of the region. Mold and sewage problems in flooded homes on the Yankton Sioux Reservation in South Dakota caused concerns over public health. A farmer near Schuyler, Nebraska reported that it would cost over $1 million to remove sand and debris from his 80-acre pasture left behind by floodwaters. The flooding issues stretch well beyond the High Plains region, as several states in the Midwest and the South contended with spring flooding as well. In fact, the first half of 2019 yielded a record number of flood disasters in the U.S., with Nebraska, Iowa, and South Dakota topping the list, according to E&E News. These disasters are expected to place a strain on the Federal Emergency Management Agency’s disaster relief fund, which is currently paying out funds for losses from hurricanes that hit the U.S. and its territories in 2017.
- Agriculture continued to be negatively impacted by spring and early summer conditions. The percent of corn and soybeans that emerged had nearly caught up to the 5-year average throughout the region by the end of June. However, only about half of the corn and soybean crop in South Dakota and Kansas was in good to excellent condition, according to the July 2nd USDA Weekly Weather and Crop Bulletin. Wet conditions have contributed to increased disease issues, the prevalence of weeds due to the delayed application of spring weed control, and the likely need for additional drying. Late-planted crops will be at risk for a damaging freeze in the fall if they have not yet reached maturity. Unfortunately, the most recent seasonal outlooks continue to indicate below-normal temperatures and above-normal precipitation for the eastern High Plains, which could slow crop development and exacerbate current issues.
- Temperatures were near normal throughout the High Plains in June. For the most part, temperatures ranged within 2.0 degrees F (1.1 degrees C) of normal, with cooler conditions in western and southern portions of the region and warmer conditions across the Dakotas. Due to the modest temperature departures, there were no noteworthy monthly temperature records. However, there was a large temperature swing toward the end of the month across the region. While the first three weeks of June were on the cool side, an impressive warmup occurred during the last week, with temperatures ranging from 4.0-8.0 degrees F (2.2-4.4 degrees C) above normal in the eastern High Plains. The combination of heat and high humidity prompted the issuance of heat advisories across these areas during the last two days of June.
- Despite near-normal temperatures for the month, temperature extremes were evident across the region in June, with some areas climbing above 100.0 degrees F (37.8 degrees C) and others dipping below freezing. For example, Valentine, Nebraska reached 104.0 degrees F (40.0 degrees C) on the 29th, which was 14.5 degrees F (8.1 degrees C) above normal for that day. Yet, Valentine was far from reaching its highest June temperature of 110.0 degrees F (43.3 degrees C), set in 1988. On the contrary, several locations in Wyoming had minimum temperatures that ranked in the top 10 lowest on record. For instance, Casper recorded its two lowest temperatures for June. On the 9th, Casper set its record lowest temperature at 27.0 degrees F (-2.8 degrees C), then set a new record low the very next day at 25.0 degrees F (-3.9 degrees C). The previous record low temperature for June was 28.0 degrees F (-2.2 degrees C), set on June 13, 1969 (period of record 1939-2019).
- Precipitation was variable across the High Plains during June. Most places experienced dryness, which was welcomed after a very wet May and ongoing flooding issues. However, wet pockets existed in Colorado, as well as Nebraska and Kansas where excessive rainfall was not needed. It was not a month for precipitation extremes across the region though. In fact, the only noteworthy precipitation record came from Dickinson, North Dakota, which had its 7th driest June.
- Severe weather was prevalent throughout the region in June, with several reports of tornadoes, high winds, large hail, and flash flooding. For instance, on the 15th, a tornado touched down briefly near Estelline, South Dakota. It caused minimal damage and was rated an EF-0 on the Enhanced Fujita scale. What made this tornado particularly noteworthy was that it was anticyclonic, which means it rotated in a clockwise direction. It is extremely rare to get anticyclonic tornadoes in the Northern Hemisphere. In fact, estimates indicate that approximately one percent of tornadoes that form in the Northern Hemisphere are anticyclonic. On the 18th, severe storms with torrential rainfall went through Wichita, Kansas, causing flash flooding that led to road closures and water rescues. According to the Community Collaborative Rain, Hail, and Snow (CoCoRaHS) network, rainfall totals exceeded 3.00 inches (76 mm) in eastern portions of the city. Four days later, a severe storm with high winds produced an impressive wind gust of 111 miles per hour (179 km/hr) near the city of Derby, Kansas, a suburb of Wichita.
- While most people are not thinking about snow this time of year, the official snow season ended on June 30th and it was an impressive one for the High Plains. For many, snowfall came both early and late this season, causing positive and negative impacts. For instance, abundant snowfall was welcomed in Colorado after enduring drought conditions during the previous year that strained water supplies and disrupted the tourism season. On the other hand, early snows last fall brought an early end to the growing season and created issues during harvest for eastern parts of the region, while late snows during the spring delayed planting and contributed to flooding issues. Mobridge, South Dakota, Sisseton, South Dakota, and Lincoln, Nebraska had their snowiest season (July-June) on record. This season ranked among the top 10 of snowiest seasons for several other locations around the region as well (see page 6 for additional records).
- Mountain snowpack in the Upper Missouri Basin had nearly melted out by the end of June. Less than 1 percent of this year’s peak remained above Fort Peck Reservoir, while approximately 2 percent of this year’s peak remained between Fort Peck and Garrison Reservoirs. As of July 1, the only area reporting mountain snowpack in Wyoming or Colorado was the Snake River Basin in western Wyoming. A late meltout of mountain snowpack in Colorado caused streamflows to be above normal in the western portion of the state. Streamflows continued to be above normal throughout the eastern High Plains in June. However, drier conditions in June helped flooding in these areas begin to subside, and in general, flows were lower than in May. The primary exception to above-normal streamflows throughout the region was northern and western North Dakota, where persistent dryness caused streamflows to run below normal.
- Despite much of the region remaining free of drought and dryness during June, drought developed and intensified in North Dakota. According to the U.S. Drought Monitor, the area in the High Plains experiencing drought or abnormal dryness (D0-D4) increased from four percent to six percent over the course of the month. While no areas were experiencing drought (D1-D4) at the end of May, about two percent of the region was in drought by the end of June, which was down from three percent around the middle of the month.
- Northern North Dakota had a dry spring, receiving less than 50 percent of normal precipitation from March-May, causing impacts to agriculture. As a result, moderate drought (D1) spread across the region, and severe drought (D2) was introduced as well. Only recently did this area receive some relief, as the latter half of June brought beneficial precipitation to the area, improving drought conditions. Impacts that have been reported included curling corn leaves, distressed wheat and pastureland, replanting issues due to deficits in subsoil moisture, culling herds, and low water supplies. It is worth noting that this is the third consecutive summer that this region has experienced drought, which has taken a toll on agriculture in the area.
- As for improvements, several pockets of D0 were removed from Wyoming due to a favorably wet pattern in May and June. The only pocket of D0 that remained was along the western border. Elsewhere, abundant moisture kept the rest of the region free of drought and dryness.
- For more information, please visit the High Plains Regional Climate Center Home Page.
Southern Region (Information provided by the Southern Regional Climate Center)
- Temperatures for the month of June exhibited a weak north-to-south pattern across the Southern Region, with above-normal temperatures in the south and below-normal temperatures in the north. Parts of western Oklahoma as well as northern, central, and southwestern Texas experienced temperatures 2 to 3 degrees F (1.11 to 1.67 degrees C) below normal. Parts of northern, central, western, and eastern Texas; western, southern, and eastern Oklahoma; western, central, northern, and eastern Arkansas; northwestern and northeastern Louisiana; western Mississippi; and western and eastern Tennessee experienced temperatures 1 to 2 degrees F (0.56 to 1.11 degrees C) below normal. Conversely, parts of central, southern, and southeastern Texas; southwestern, northern, and southeastern Louisiana, and southern and northeastern Mississippi experienced temperatures 1 to 2 degrees F (0.56 to 1.11 degrees C) above normal. Parts of southern Texas and southeastern Louisiana experienced temperatures 2 to 3 degrees F (1.11 to 1.67 degrees C) above normal. The statewide monthly average temperatures were as follows: Arkansas – 75.40 degrees F (24.11 degrees C), Louisiana – 80.20 degrees F (26.78 degrees C), Mississippi – 78.20 degrees F (25.67 degrees C), Oklahoma – 74.90 degrees F (23.83 degrees C), Tennessee – 73.10 degrees F (22.83 degrees C), and Texas – 78.90 degrees F (26.06 degrees C). The statewide temperature rankings for June were as follows: Arkansas (thirtieth coldest), Louisiana (forty-ninth warmest), Mississippi (fifty-fourth coldest), Oklahoma (twenty-fourth coldest), Tennessee (fortieth coldest), and Texas (forty-second coldest). All state rankings are based on the period spanning 1895-2019.
- Precipitation values for the month of June were above normal across a broad portion of the Southern Region. Parts of southwestern Oklahoma, southeastern Louisiana, and western and southern Texas received 50 percent or less of normal precipitation, while parts of southern and western Texas received 25 percent or less of normal precipitation. In contrast, parts of southwestern, southern, northern, and eastern Texas; eastern Oklahoma; western Louisiana; western, northern, and eastern Arkansas; northern Mississippi; and southwestern, northern, and eastern Tennessee received 150 percent or more of normal precipitation. Parts of southwestern, southern, southeastern, and eastern Texas; northeastern and southeastern Oklahoma; western, northern, and southeastern Arkansas; southwestern Louisiana; northern Mississippi; and northern Tennessee received precipitation 200 percent or more of normal. The statewide precipitation totals for the month were as follows: Arkansas – 6.14 inches (155.96 mm), Louisiana – 6.22 inches (157.99 mm), Mississippi – 4.94 inches (125.48 mm), Oklahoma – 4.93 inches (125.22 mm), Tennessee – 6.46 inches (164.08 mm), and Texas – 4.01 inches (101.85 mm). The state precipitation rankings for June were as follows: Arkansas (fifteenth wettest), Louisiana (thirty-second wettest), Mississippi (thirty-fourth wettest), Oklahoma (thirty-fourth wettest), Tennessee (eighth wettest), and Texas (twenty-fifth wettest). All state rankings are based on the period spanning 1895-2019.
- At the end of June, drought conditions both improved and deteriorated across the Southern Region. Severe drought classifications developed in far southern Texas, while moderate drought classifications expanded in far southern Texas. There were no drought conditions in Oklahoma, Tennessee, Louisiana, Mississippi, and Arkansas. There was a decrease in the overall area experiencing abnormally dry conditions, as areas in central Tennessee, coastal Mississippi, and western and southern Texas saw improvement or removal. However, abnormally dry conditions developed or expanded across parts of western and southeastern Tennessee, northeastern Mississippi, and southeastern Louisiana.
- In June, there were a total of 1,180 storm reports across Oklahoma, Texas, Arkansas, Louisiana, Mississippi, and Tennessee. There were 61 tornado reports, 276 hail reports, and 843 wind reports. Louisiana tallied the most tornado (25) reports, while Texas tallied the most hail (214) and wind (269) reports. Texas tallied the most reports total (497), while Arkansas tallied the fewest (92). June was an active month across the Southern Region, as only three days (June 10, 12, and 13) did not have at least one storm report.
- On June 1, 2019, baseball-sized hail was reported near Perico, Texas, while a wind gust of 91 mph (146.45 kph) was reported near Amarillo, Texas.
- On June 2, 2019, a landspout tornado was reported near Boise City, Oklahoma. A wind gust of 82 mph (131.97 kph) was reported near Wall, Texas.
- On June 5, 2019, there were 10 tornado reports in Louisiana, while wind gusts of 70 mph (112.65 kph) were reported near Big Spring, Texas and Robert Lee, Texas.
- On June 6, 2019, there were 11 tornadoes reported, with 10 in Louisiana and 1 in Arkansas. Five people were injured during a tornado near Sorrento, Louisiana. Also, a wind gust of 80 mph (128.75 kph) was reported near Kingsville, Texas.
- On June 9, 2019, there were 89 storm reports across Texas and Oklahoma. Two tornadoes were reported near Copperas Cove, Texas and Liberty Hill, Texas. Baseball-sized hail was reported near Stephenville, Texas and Llano, Texas. One person was killed at Eagle Mountain Lake after high winds caused their vessel to capsize, while high winds in Dallas caused a construction crane to collapse, killing one and injuring six. A wind gust of 81 mph (130.36 kph) was reported near Manor, Texas while a wind gust of 70 mph (112.65 kph) was reported near Edmond, Oklahoma.
- On June 14, 2019, a wind gust of 83 mph (133.58 kph) was reported near Camp Houston, Oklahoma.
- On June 15, 2019, three tornadoes were reported across Texas and Oklahoma. Hail larger than tea-cup size was reported near Hereford, Texas, while a wind gust of 87 mph (140.01 kph) was reported near Childress, Texas.
- On June 16, 2019, there were six tornadoes across Texas, Oklahoma, and Mississippi. There were multiple reports of hen-egg sized hail across Texas near Arden, Mertzon, and Mountain Home.
- On June 17, 2019, there were two tornadoes reported in Mississippi. Golf ball to tennis ball-sized hail was reported near Seminole, Texas, while tennis ball-sized hail was reported to have damaged vehicles near Andrews, Texas. A wind gust of 68 mph (109.44 kph) was reported near Brownfield, Texas.
- On June 18, 2019, there were two tornadoes reported in Texas. There were reports of tea-cup sized hail near Pampa, Texas and Borger, Texas. A wind gust of 86 mph (138.40 kph) was reported near Borger, Texas, while a wind gust of 80 mph (128.75 kph) was reported near Byars, Oklahoma. This wind gust was responsible for blowing the roof off of a house.
- On June 19, 2019, there were 7 tornadoes reported across Texas, Oklahoma, Louisiana, and Tennessee, the strongest of which was an EF-2 near Benton, Louisiana. Hail slightly larger than grapefruits (5 inches in diameter) was reported near Vandervoort, Arkansas. Softball-sized hail was reported near Coleman, Texas, while golf ball-sized hail resulted in 3 injuries near Santa Anna, Texas. Baseball-sized hail was reported near Sharon, Oklahoma. Wind gusts of 90 mph (144.84 kph) were reported near Beulah, Mississippi; Cleveland, Mississippi; and Winterville, Mississippi, while a wind gust of 95 mph (152.89 kph) was reported near Lamont, Mississippi. Unfortunately, one person was killed near Winterville, Mississippi when a tree was blown down onto a mobile home. A wind gust of 80 mph (128.75 kph) was reported near Dermott, Arkansas.
- On June 21, 2019, there were four tornadoes reported in Tennessee and one tornado reported in Texas. A wind gust of 80 mph (128.75 kph) was reported in Springfield, Tennessee.
- On June 23, 2019, there were three tornadoes reported in Mississippi and one tornado reported in Louisiana. One person was injured near Paynes, Mississippi after they were ejected from a mobile home destroyed due to high winds.
- On June 24, 2019, tea cup-sized hail was reported near New Deal, Texas and Wilson, Texas, while there were several reports of baseball-sized hail across Texas. A wind gust of 75 mph (120.70 kph) was reported near Elsa, Texas.
- On June 25, 2019, one person was injured near Laurel, Mississippi after strong winds blew a tree limb down on them. A wind gust of 70 mph (112.65 kph) was reported near San Leon, Texas.
- For more information, please visit the Southern Regional Climate Center Home Page.
Western Region (Information provided by the Western Region Climate Center)
- Precipitation was below normal across much of the West; however, June is typically one of the driest months of the year for some parts of the region. Temperatures were above normal in coastal states and near to slightly below normal elsewhere in the region.
- Scattered areas of the West observed above normal June precipitation, generally associated with isolated thunderstorm events for locations west of the Rockies. Owyhee Dam in eastern Oregon logged 2.38 in (60 mm) in June, 259% of normal. Nearly all of this precipitation (2.27 in/58 mm) fell in one day on June 13. Some areas east of the Rocky Mountains saw persistent precipitation throughout the month. Fort Collins, Colorado, reported 2.59 in (66 mm) for June, 119% of normal and saw at least trace amounts of precipitation on 22 days of the month. Wolf Point, Montana reported 4.49 in (114 mm), 165% of normal, the 3rd wettest in a relatively short record beginning in 1998 and had at least trace precipitation on 17 days in June.
- Much of the Pacific Northwest and Intermountain West observed drier than normal conditions this month. Missoula, Montana recorded 0.66 in (17 mm), 32% of normal and the 6th driest June since records began in 1948. Portland, Oregon, observed 0.45 in (11 mm) of precipitation, 26% of normal and the 10th driest June in an 82-year record. In the US Drought Monitor, some areas of improvement were seen along the northern border of New Mexico and Arizona. Western Oregon, western Washington, and several areas along the northern border of the western states saw expansion of drought conditions this month.
- California saw the greatest departures above normal temperature for June. In northern California, Ukiah reported an average temperature of 72 F (22.2 C), 4.4 F (2.4 C) above normal and the third warmest June since records began in 1949. In the southern Central Valley, Bakersfield logged an average temperature of 81.9 F (27.7 C), also 4.4 F (2.4 C) above normal and the 10th warmest June in a record that began in 1937. Some areas of Oregon and Washington also saw temperatures several degrees above normal. Temperatures in Roseburg, southern Oregon, averaged to 67.7 F (19.8 C), 3.8 F (2.1 C) above normal. Elsewhere, temperatures were near to slightly below normal. For example, in eastern Nevada, Ely reported an average temperature of 58.6 F (14.8 C), 1.4 F (0.8 C) below normal. In Albuquerque, New Mexico, temperatures averaged to 73.8 F (23.2 C), 1.1 F (0.6 C) below normal. Phoenix, Arizona, reported a June average temperature of 91.1 F (32.8 C), 0.3 F (0.2 C) above normal.
- Much of Alaska experienced warmer and drier than normal conditions during June. Anchorage reported its all-time warmest and driest June in a 68-year record. Temperatures averaged to 60.5 F (15.8 C), 5.2 F (2.9 C) above normal. Precipitation totaled 0.06 in (2 mm), 6% of normal. In the northwestern part of the state, Kotzebue reported an average temperature of 56.8 F (13.8 C), 11.1 F (6.2 C) above normal and set the record for warmest June by 3.4 F (1.9 C). Records for Kotzebue began in 1897. Although a few southeastern Alaska stations reported above normal precipitation this month (e.g., Ketchikan reported 7.97 in/202 mm, 120% of normal), moderate to extreme drought conditions persist in this region. Roughly 3% of the state is experiencing drought conditions, all in the Panhandle. Ketchikan anticipates needing backup generators through at least October as reservoirs remain too low to generate hydropower.
- Above normal temperatures dominated in Hawaii, driven primarily by above normal sea surface temperatures in the Central Pacific. Kahului, Maui, logged an average temperature of 80.9 F (27.2 C), 2.9 F (1.6 C) above normal and the warmest June since records began in 1954. Many areas of the state observed above normal precipitation. Honolulu recorded 5.68 in (144 mm), more than 2000% of normal. A large portion of this, 4.2 in (107 mm) fell during intense thunderstorms associated with an upper-level low-pressure system that drew moist air into the region on June 25. The storm also caused downed trees, flooding, and several injuries due to lightning strikes on Oahu. In contrast, the windward side of the Big Island reported well below normal precipitation, Hilo observed 3.90 in (99 mm), 53% of normal. Drought improvement occurred on the windward sides of the islands in Hawaii and Maui Counties, with more island-wide improvement for Oahu and Kauai. Moderate to extreme drought conditions remain to some degree on the leeward sides of all islands. Significant Events for June 2019
- June 21-22: Late season snow in Colorado: Nearly two feet (~60 cm) of snow fell above 7,000 feet (2100 m) in some locations in the Colorado Rockies around the summer solstice. It is uncommon to see snow this late in the season. In Steamboat Springs, the average last snowfall is May 6 and the previous latest snowfall was June 17, 1928.
- June (all month): Wildfires in Alaska: In Alaska, 38 large wildfires have burned over 418,000 acres (169,000 hectares) this year. While the number of acres burned is above normal, it is not yet approaching a record. Wildfires across Alaska have created air quality impacts in the Fairbanks and Anchorage areas and have threatened some neighborhoods, prompting evacuations. Well above normal temperatures and dry weather have created conditions favorable for large wildfires.
- June (all month): Expansion and increase in severity of drought conditions in the Pacific Northwest: At the end of the month, roughly 55% of Washington was designated as in moderate to severe drought, as compared to 44% at the beginning of the month. In June, roughly 80% of USGS gauged streams in Washington were running below normal. Outlooks favor warmer than normal conditions for the summer season, which may exacerbate drought conditions.
- For more information, please go to the Western Regional Climate Center Home Page.