National Overview

April Highlights

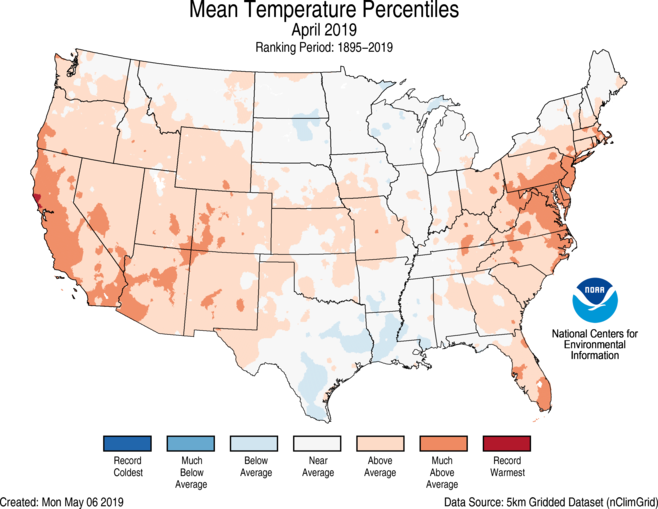
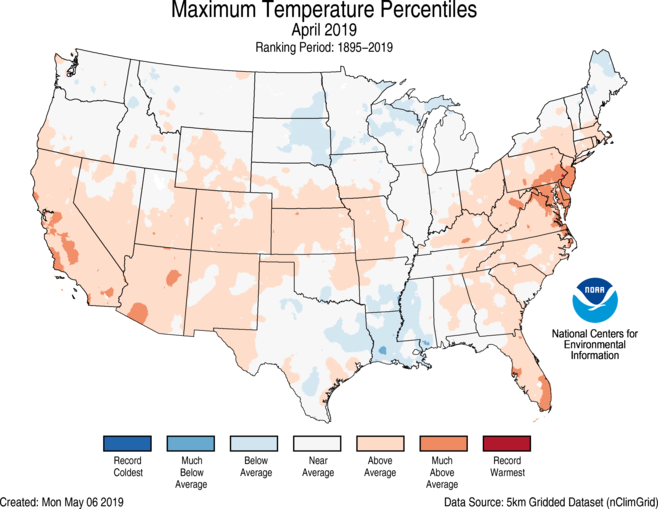
April Temperature
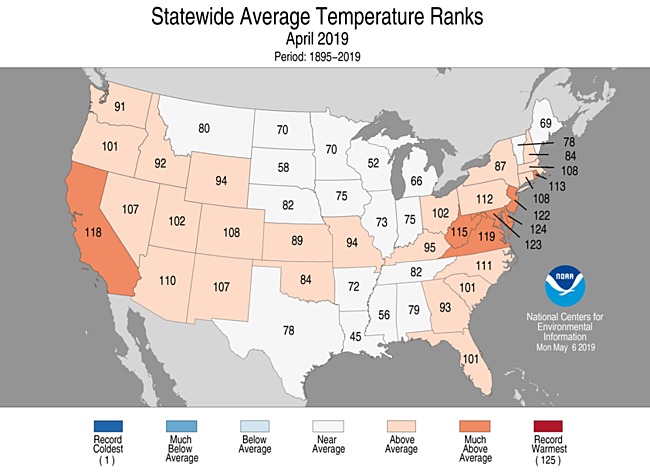
- During April, the average contiguous U.S. temperature was 52.9°F, 1.8°F above the 20th century average. This ranked in the upper third of the 125-year period of record.
- Much-above-average temperatures were observed across the Mid-Atlantic as well as coastal California. Delaware had its second warmest April on record while Maryland and New Jersey were third and fourth warmest on record, respectively.
- Parts of the Deep South and northern Plains were cooler than average.
- The contiguous U.S. average maximum (daytime) temperature during April was 64.9°F, 1.4°F above the 20th century average, ranking in the middle third of the record. Below-average maximum temperatures were observed in pockets across the nothern Plains, lower Mississippi Valley, and Maine. Above-average maximum temperatures were observed from California eastward to the Mississippi River and from Florida northward into southern New England.
- The contiguous U.S. average minimum (nighttime) temperature during April was 40.8°F, 2.2°F above the 20th century average, ranking in the upper third of the record. Much-above-average temperatures were observed from the Rocky Mountains to the Pacific Coast and across parts of Florida and along the Mid-Atlantic coast states. Below-average minimum temperatures were observed across much of south Texas.
- The Alaska April temperature was 28.4°F, 5.1°F above the long-term average. This was the 10th warmest April in the 95-year period of record for the state. Kotzebue had its warmest April on record. Along the state's west coast, the Bering Sea ice extent ranked second lowest behind 2018.
- During April there were 2,753 record warm daily high (734) and low (2,019) temperature records, which was about 1.7 times the 1,663 record cold daily high (1,075) and low (588) temperature records.
- Based on NOAA's Residential Energy Demand Temperature Index (REDTI), the contiguous U.S. temperature-related energy demand during April was approximately 36 percent of average and ranked as the eleventh lowest value in the 125-year period of record.
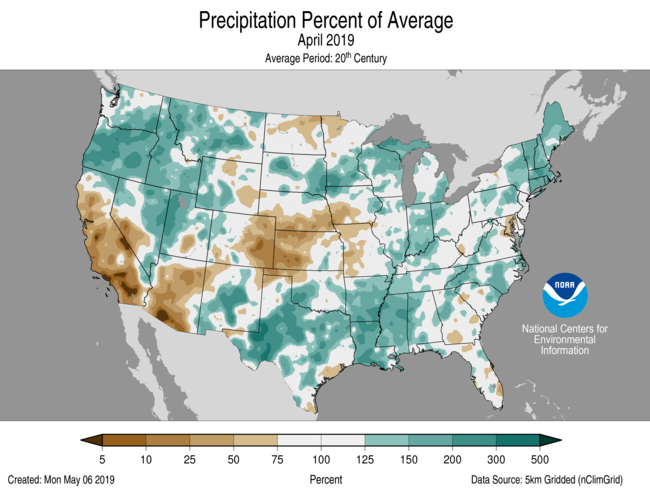
April Precipitation

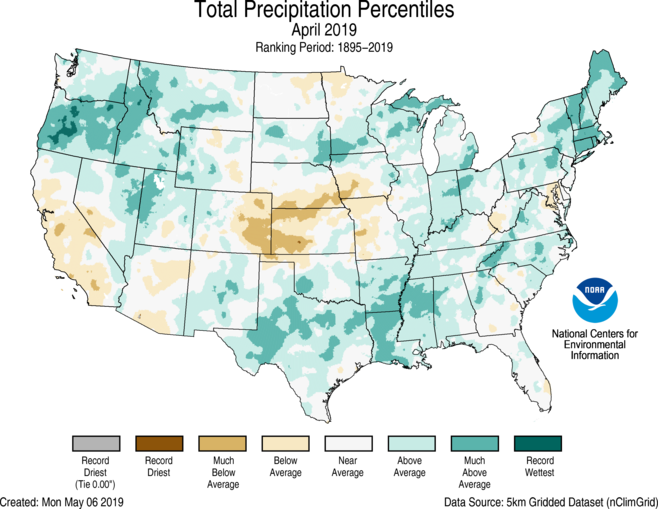
- The April precipitation total for the contiguous U.S. was 3.17 inches, 0.65 inch above average, and ranked in the top 10 percent the 125-year period of record.
- During April, much-below-normal dryness was observed across parts of the central Plains.
-
Above-average wetness occurred across much of the Northwest, the South, parts of the upper Mississippi Valley and Great Lakes as well as portions of the Southeast and New England.
- Oregon ranked third wettest for April while Idaho and Vermont both ranked sixth wettest.
- A significant snow event, which occurred from the 9th to the 12th, brought blizzard conditions to parts of the northern Plains and ranked as a Category 3 on the Regional Snowfall Index scale. This is the highest rank for a snow event in the Northern Rockies and Plains region since October 2013. Watertown, SD, reported 25 inches of snow, which is the city’s largest 3-day snow total on record.
- According to the April 30 U.S. Drought Monitor report, approximately two percent of the contiguous U.S. was in drought, down from six percent at the beginning of April. This is the second smallest drought footprint on record. Drought conditions improved across Oregon, New Mexico and Texas and expanded across Hawaii and Puerto Rico.
- According to NOAA data analyzed by Rutgers Global Snow Lab, the April snow cover extent was 21,000 square miles above the 1981-2010 average and ranked as the 22nd largest April snow cover extent on record for the Lower 48 since satellite records began 53 years ago. Above-average snow cover was observed across the northern Plains, Great Lakes and into New England, with below-average snow cover across the central High Plains and parts of the West.
Year-to-Date Highlights


January-April Temperature
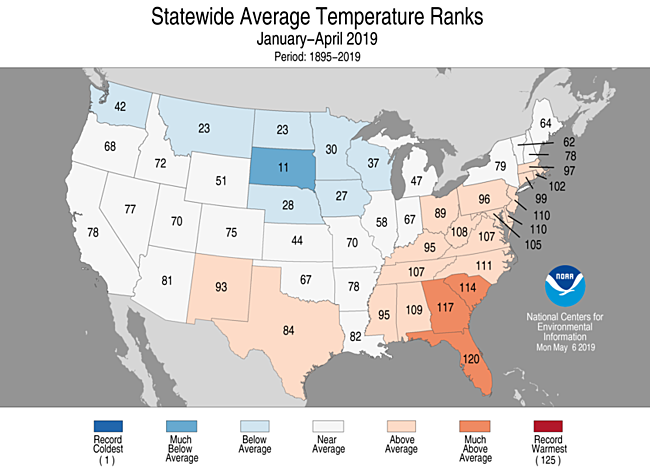
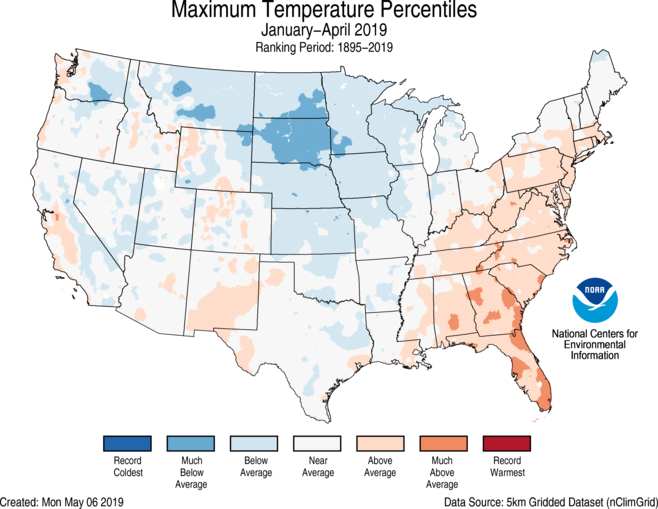
- The year-to-date (January-April) average contiguous U.S. temperature was 39.4°F, 0.3°F above average, ranking in the middle third of the 125-year record.
- Much-above- to above-average temperatures were observed across much of the Southeast, Ohio Valley, and Mid-Atlantic states. Florida had its sixth warmest year-to-date period while Georgia experienced its ninth warmest such period.
- Much-below- to below-average temperatures were present across the northern Plains and Great Lakes with South Dakota registering its 11th coldest January–April on record.
- The contiguous U.S. average maximum (daytime) temperature during January-April was 50.1°F, 0.4°F below the 20th century average, ranking in the lowest third of the historical record. Above-average conditions were primarily observed across the Southeast and Atlantic Coast. Below-average maximum temperature dominated the Plains and parts of the West.
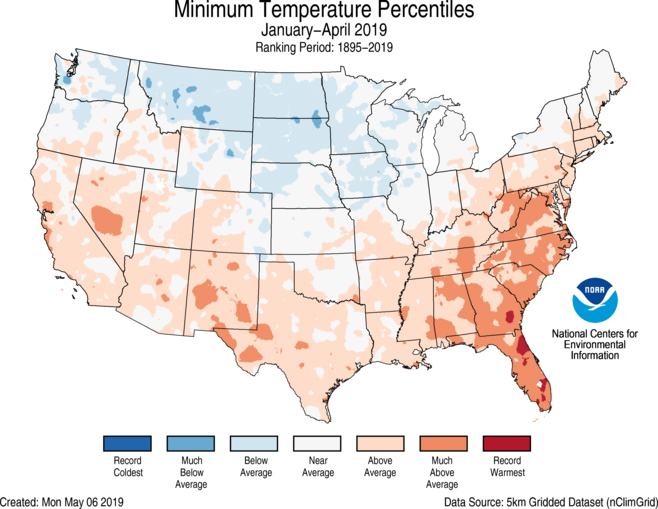
- The contiguous U.S. average minimum (nighttime) temperature during January-April was 28.7°F, 0.9°F above the 20th century average, ranking in the middle third of the record. Above-average conditions were observed across the West, Southwest, Deep South, Southeast, and into the Mid-Atlantic States. Below-average minimum temperatures were evident from the northern Plains to the northern Great Lakes.
- The Alaska January-April temperature was 19.4°F, 9.1°F above the long-term average, ranking second warmest on record for the state. Only 2016 was warmer. Much of the North Slope, northern West Coast, northern Northeast Interior, and eastern Aleutian regions were record warm, while near-average conditions were observed across the Panhandle. Utqiaġvik (Barrow) had its warmest January–April on record, surpassing the previous record set in 2018 by 0.9°F.
- Based on REDTI, the contiguous U.S. temperature-related energy demand during January-April was approximately 82 percent of average and was the 33rd lowest value on record.
January-April Precipitation

- The year-to-date precipitation total was 11.24 inches, 1.76 inch above average, ranking seventh wettest.
- Below-average precipitation for the year-to-date period was observed across parts of Washington state, Georgia and South Carolina.
- Much-above- to above-average precipitation dominated much of the West, the Mississippi and Ohio Valleys, Great Lakes and parts of New England. Tennessee was second wettest while Nevada and Utah ranked fourth wettest for this year-to-date period.
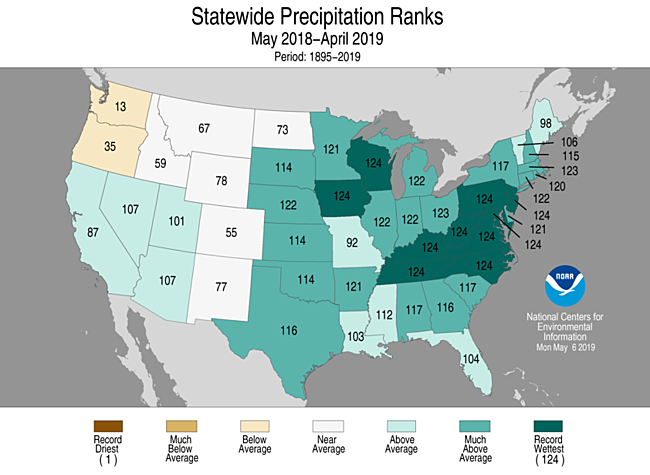
- For the most recent 12-month period (May 2018–April 2019), the contiguous U.S. was record wettest, exceeding the previous record, set back in 2015–2016, by 0.25 inch. Ten states ranked record wettest with another seven states ranking among the top three. This most recent 12-month period is also the wettest 12-month period for any 12-month period on record.
Extremes
- The U.S. Climate Extremes Index (USCEI) for the year-to-date was six percent above average and ranked in the middle third of the 110-year period of record. Persistent and ongoing wet conditions across the CONUS contributed to elevated extremes in both wet PDSI and the number of days with precipitation, which ranked eighth and second highest on record, respectively. The USCEI is an index that tracks extremes (falling in the upper or lower 10 percent of the record) in temperature, precipitation and drought across the contiguous United States.
- On the regional scale, the CEI in the Ohio Valley ranked as the 14th highest value on record due to record high extremes in wet PDSI and the second largest footprint of extremes in the number of days with precipitation. The Northeast ranked 16th highest, also due to extensive extremes in wet PDSI, days with precipitation, and also from extremes in 1-day precipitation. Elevated regional extremes over the last several months have been dominated by persistent and steady precipitation. This can be seen in the record and near-record ranks for both wet PDSI and days with precipitation throughout many of the other regions.
Regional Highlights
These regional summaries were provided by the six Regional Climate Centers and reflect conditions in their respective regions. These six regions differ spatially from the nine climatic regions of the National Centers for Environmental Information.
Northeast Region (Information provided by the Northeast Regional Climate Center)
- The Northeast's average temperature for April was 47.4 degrees F (8.6 degrees C), 1.4 degrees F (0.8 degrees C) above normal. Ten of the region's twelve states experienced a warmer-than-normal April, with eight of them ranking this April among their 20 warmest on record: Delaware, second warmest; Maryland, third warmest; New Jersey, fourth warmest; West Virginia, 11th warmest; Rhode Island, 13th warmest; Pennsylvania, 14th warmest; Massachusetts, 18th warmest; and Connecticut, 19th warmest. Average temperature departures for all the Northeast states ranged from 0.9 degrees F (0.5 degrees C) below normal in Maine to 4.5 degrees F (2.5 degrees C) above normal in Delaware.
- It was the 18th wettest April since 1895 for the Northeast with 4.62 inches (117.35 mm) of precipitation, 126 percent of normal. This April ranked among the 20 wettest on record for seven of the nine wetter-than-normal states: Vermont, sixth wettest; Connecticut, seventh wettest; Massachusetts and Rhode Island, 9th wettest; New Hampshire, 10th wettest; Maine, 12th wettest; and New York, 18th wettest. Precipitation for all the states ranged from 83 percent of normal in Maryland to 163 percent of normal in Connecticut. Eleven major climate sites had their greatest number of April days with measurable precipitation. Of those sites, Islip, New York, had the most with 22 days. Islip also had three days with a trace of rain, leaving only five April days without any precipitation.
- While the Northeast started April free of drought and abnormal dryness, below-normal precipitation and low streamflow led to the introduction of abnormal dryness in western New York and central West Virginia by mid-month. The U.S. Drought Monitor released on April 11 showed 3 percent of the Northeast as abnormally dry. Precipitation during the following week allowed abnormal dryness to be erased in central West Virginia and to improve slightly in western New York. The U.S. Drought Monitor released on April 18 showed less than 1 percent of the Northeast as abnormally dry. Conditions eased in New York so that by month's end the region was once again free of drought and abnormal dryness.
- From April 3 to 4, a nor'easter brought wind gusts of up to 60 mph (27 m/s) to New England, downing trees and wires. Up to 10 inches (25 cm) of snow fell in northern Maine where whiteout conditions and blowing snow led to many road closures. On April 8, a 3-inch (8 cm) hailstone fell near Princeton, West Virginia, making it the largest hailstone to fall in the state during April. From April 14 to 15, the Northeast experienced a severe weather outbreak. Thirteen tornadoes touched down: nine in Pennsylvania (two EF-2s, three EF-1s, and four EF-0s), two in Delaware (EF-2 and EF-1), and one each in New York (EF-1) and Maryland (EF-0). These were the first April tornadoes in Delaware in over 25 years. Thunderstorms also produced wind gusts of up to 105 mph (47 m/s) and golf ball-sized hail. The storms damaged homes and other structures, destroyed outbuildings, and downed numerous trees. Heavy rain, over 2 inches (51 mm) in some areas, led to flooding and closed roads. This severe weather outbreak was also unusual because many of the thunderstorms and tornadoes occurred in the early morning. Another severe weather outbreak occurred a few days later, on April 19. Five tornadoes (two EF-2s and three EF-1s) moved through south-central Pennsylvania, with Fulton County having its first April tornado. Hundreds of trees were snapped or downed, and numerous homes and buildings were damaged. With 14 tornadoes this month, Pennsylvania had its greatest number of tornadoes for the month of April since records began in 1950. While Pennsylvania typically sees the most tornadoes of all the Northeast states, it averages only two tornadoes in April and 15 annually. In addition, Delaware reached its April and annual tornado quota with two tornadoes this month. Average for the state is zero tornadoes in April and one annually. Caribou, Maine, had a record 163 consecutive days with at least 1 inch (3 cm) of snow on the ground from November 10, 2018 through April 21, 2019. The previous record was 155 days from November 17, 2002 through April 20, 2003. Rainfall and snowmelt contributed to generally minor to moderate flooding in New England from April 15 to 24. USGS preliminary data showed that the St. John River at Ninemile Bridge, Maine, had its highest peak streamflow in its 67-year period of record. A third round of severe weather occurred on April 26. An EF-1 tornado touched down in Maryland, the state's second tornado of the month and one more than average. Strong thunderstorm winds caused damage in Pennsylvania and New Jersey, as well. Golf ball-sized hail fell in Massachusetts. It was only the third time since 1950 hail that size or larger has fallen in the state in April, with the last time being in 1969.
- For more information, please visit the Northeast Regional Climate Center Home Page.
Midwest Region (Information provided by the Midwest Regional Climate Center)
- April precipitation for the Midwest was 108 percent of normal, at 0.25 inches above normal. Two states, Missouri at 78 percent of normal and Iowa at 82 percent of normal, were below normal while the other seven states were above normal, with Indiana the wettest at 135 percent of normal. The current year-to-date, January to April, precipitation ranks as the 7th wettest in history (1895-2019) with 133 percent of normal for the period. The 4-month accumulation of 12.38 inches (314 mm) was 3.04 inches (77 mm) above normal. Seven Midwestern states ranked from 6th to 12th wettest, putting them in the wettest 10 percent of their histories for the year-to-date period (January to April). May 2018 to April 2019 ranks as the wettest May to April period on record for the Midwest with over 45 inches (1143 mm). The total was more than 8 inches (203 mm) above normal and more than 1 inch (25 mm) above the old record set in 2010-2011. All nine Midwestern states had above normal precipitation for May to April ranging from 103 percent of normal in Missouri to 136 percent of normal in both Iowa and Kentucky. Three states also set new records for May to April precipitation. Wisconsin topped its 2010-2011 record by less than a half inch (0.41 inches or 10 mm), Iowa easily surpassed (by 2.57 inches or 65 mm) its very old record from 1902-1903, and Kentucky smashed its previous 1974-1975 record by almost 5 and a half inches (5.49 inches or 139 mm). Five other Midwestern states ranked among their five wettest May to April periods with Ohio ranking 2nd, Indiana and Michigan ranking 3rd, Minnesota 4th, and Illinois 5th wettest.
- April temperatures for the region came in right at normal. Three states were below normal, five were above normal, and Illinois also came in at normal. Most of the daily temperature records in April were record lows. Record lows (433) far exceeded the record highs (115) during the month. Year-to-date (January to April) temperatures for the region were 2.2 degrees F (1.2 C) below normal. May 2018 to April 2019 came in at slightly warmer than normal (0.3 degrees F or 0.2 C), however two states ranked among the warmest in their histories, Kentucky ranked 6th and Ohio 8th for the 12-month period.
- Spring planting was on held up due to wet and cold conditions in the region. Corn planting was running behind the 5-year average in all nine states. Minnesota was furthest behind with less than 1 percent of the crop planted compared to the 5-year average of 24 percent. Iowa, Illinois, Indiana, and Ohio were all at least 10 percent behind average as well. Even normal precipitation would delay field work as soils are saturated with standing water in many fields.
- Snow in April was well above normal in much of Minnesota, Wisconsin, northern Illinois, and parts of Lower Michigan. Totals were two to five times normal in these areas. On the other end of the spectrum, northeastern Ohio was well below normal. A similar pattern for the season was shown with low snow totals in the southeastern Midwest and above normal amounts in much of the western Midwest up through Minnesota and Wisconsin. Totals for the season were as much as 20 to 30 inches (51 to 76 cm) below normal in northeastern Ohio while areas with 10 inches (25 cm) above normal stretched across northern and central Missouri, northwestern Illinois, and much of Iowa, Minnesota, Wisconsin, and Upper Michigan. There were areas of western Minnesota and west central Wisconsin that had more than 40 inches (102 cm) above normal snowfall. Several cities in the upper Midwest set new seasonal snowfall records in 2018-2019. Some notable records were Eau Claire, Wisconsin (126 years) with 98.8 inches (251 cm), Waterloo, Iowa (122 years) with 60.0 inches (152 cm), and Rochester, Minnesota (86 years) with 86.8 inches (220 cm).
- Flooding was both extensive and persistent throughout April in the Midwest. Flooding was an issue on the major rivers of the region, Mississippi, Missouri, and Ohio Rivers, as well as on their tributaries due to both rainfall and snowmelt. Davenport, Iowa had been at major flood stage for 38 days as April came to an end, with forecasts that would challenge the record levels of 1993. On the 30th, a levee protecting the downtown area was breeched and 6 feet (2 m) of water quickly engulfed parts of the city. Flood forecasts were indicating that even normal rainfall in the coming weeks could lead to even more impacts with saturated soils and already full waterways.
- Severe weather was reported in the Midwest on just 13 days in April, and only nine of those days had more than a handful of reports in the region. The northern states were particularly quiet with just a handful of reports in Minnesota and Wisconsin and none in Michigan. Missouri and Ohio were the most active states. Tornadoes were reported on seven days with most of the reports coming from Ohio, mostly on the 14th, and Missouri, mostly on the 30th. An EF-2 tornado in Christian County, Missouri was responsible for three injuries on the 30th.
- Drought has been absent from the Midwest throughout 2019, a record 18 straight weeks (US Drought Monitor history started in 2000). The most recent Midwest drought in the US Drought Monitor was depicted in southwestern Missouri on December 25, 2018. The lack of drought and even abnormally dry areas in the Midwest for the past 10 weeks is also unprecedented in the US Drought Monitor history. The most recent abnormally dry area in the Midwest was a small area in northwestern Minnesota in the February 19, 2019 US Drought Monitor. Prior to this stretch there were only two other weeks, one week in May 2002 and another in May 2017, where the 9-state Midwest had neither drought nor abnormally dry anywhere in the region.
- For further details on the weather and climate events in the Midwest, see the weekly and monthly reports at the Midwest Climate Watch page.
Southeast Region (Information provided by the Southeast Regional Climate Center)
- Temperatures were above normal across the Southeast this April and near normal in Puerto Rico. Monthly mean temperatures were at least 3 degrees F (1.7 degrees C) above average for approximately 42 percent of the 203 long-term (i.e., period of record equaling or exceeding 50 years) stations across the region. A total of 63 long-term stations observed or tied monthly mean temperatures that were ranked within their ten warmest on record. Ten stations had monthly mean temperatures above 6 degrees F (3 degrees C), including Pelion, SC (1947-2019; 2nd warmest) at 6.6 degrees F (3.3 degrees C) Cape Hatteras, NC (1874-2019; 3rd warmest) at 6.5 degrees F (3.2 degrees C), and Wallops Island, VA (1966-2019; 2nd warmest) at 6.2 degrees F (3.1 degrees C). Maximum daytime temperatures ranged from 0 to 6 degrees F (0 to 3 degrees C) above normal for the region and average nighttime minimum temperatures ranged from 0 to 9 degrees F (0 to 4.5 degrees C) above normal. The warm weather was due to the Bermuda high pressure system being positioned farther to the west immediately off of the southeastern coast. This set-up ushered in warm, moist air from the Gulf of Mexico, which suppressed nighttime cooling during the month. Marion, NC (1893-2019) had an average minimum temperature of 8.8 degrees F (4.4 degrees C) above normal and Danbury, NC (1946-2019) had an average minimum temperature of 8.5 degrees F (4.3 degrees C). On April 24th and 25th, maximum daytime temperatures reached 90 degrees F (32.2 degrees C) in parts of North Carolina including Concord, NC (1891-2019) and New Bern, NC (1948-2019). Typically this isn't seen until the first week of May.
- Precipitation varied across the region for April, with the wettest locations receiving up to 200 percent of their normal precipitation in parts of western North Carolina, northwestern Georgia, Alabama and southeastern Puerto Rico. The driest locations ranged from 10 to 70 percent of normal in parts of southeastern Georgia, central and eastern Florida, and northern Puerto Rico. Some parts of western North Carolina were 6 inches (152 mm) above normal, and the eastern part of Florida was 2.4 inches (61 mm) below normal. Precipitation in Puerto Rico also showed much variability, with Juncos, PR (1931-2019) being 4 inches (102 mm) above normal and San Juan, PR (1898-2019) being 1.63 inches (41 mm) below normal. St. Croix, PR (1951-2019) ranked as the 8th driest April on record, as measurable precipitation was only observed once during the month, April 22nd. The last time this occurred was in 1997. Brevard, NC (1902-2019; 1st wettest) had the highest precipitation total in the region for the month, with 14.43 inches (367 mm). This is followed by Gainesville, AL (1948-2019; 3rd wettest) at 12.71 inches (323 mm) and Pisgah Forest, NC (1939-2019; 1st wettest) at 12.61 inches (320 mm) of precipitation. Most of the maximum one-day precipitation totals across the region occurred during a severe weather outbreak on April 19th, when a low pressure system with an associated frontal boundary pushed through the area. The heavy rainfall resulted in numerous road closures due to flooding in Asheville. Indeed, Asheville, NC (1869-2019) observed its wettest April day on record with 8.97 inches (228 mm) of precipitation. The previous record was 8.70 inches (221 mm) back in 1998. Cape Hatteras, NC (1874-2019) observed its third wettest April day on record with 3.70 inches (94 mm), and Atlanta, GA (1878-2019) observed its sixth wettest April day on record with 3.37 inches (86 mm) of precipitation. A rare snowfall took place on April 2nd, as snow fell along the western edge of a low pressure system that tracked up the East Coast. Charlotte (1878-2019) measured 0.1 inches (2.54 mm) of snow, making it the 7th measurable snowfall on record for the month of April.
- There were 903 severe weather reports across the Southeast during April, which is over 350 percent of the monthly frequency of 253 reports during 2000-2017. More than 75 percent (707 of 903) of these reports occurred during the severe weather outbreak on April 19th, as a low pressure system intensified and a line of thunderstorms with embedded supercells tracked northeast through the region. A total of 655 out of the 792 April wind reports were observed with this outbreak and 52 of the 78 April tornado reports were observed. Virginia reported 19 tornados, making it the most active tornado day in Virginia in over 14 years. The strongest tornado, rated EF-3, damaged three structures and ten outbuildings in Franklin County VA. North Carolina reported 17 tornados with this outbreak, the strongest rated EF-2, which moved near Hillsborough, NC, damaging structures and downing trees. This tornado had a maximum wind speed of 115 mph and traveled over 12 miles. The line of thunderstorms stalled out temporarily over Georgia, upstate South Carolina, and western North Carolina, producing flash flooding that washed out roads across the area. There were numerous power outages associated with this event, and North Carolina topped the list with over 70,000. Hundreds of flights were cancelled due to the severe weather, and thousands were delayed. Although no fatalities were reported with the tornadic activity, two fatalities were due to windblown trees falling on houses and one reported fatality in Florida due to hydroplaning. Another severe weather event occurred on April 14th when a very potent storm system moved out of the Southern Plains states and into the southeastern region. A line of storms produced damaging straight line winds, golf ball sized hail in Polk County, GA, and several tornadoes across Alabama and Georgia. The strongest of these tornadoes was an EF-1 in Tuscaloosa County, AL. Peak wind was estimated at 105 miles per hour. This tornado uprooted some hardwood trees, removed the roof off a small barn, and killed a cow. There were ten other tornadoes in Alabama associated with this system, seven were EF-0, and three were EF-1. The severe weather system also produced five tornadoes in Georgia; three were EF-0 and two were EF-1.
- Drought conditions changed little across the region for the month of April. Moderate drought (D1) covered about 8 percent of the Southeast (down from 9 percent at the beginning of the month), in an area stretching from the South Carolina coast towards east/central Georgia and from southern Alabama to the western part of the Florida Panhandle. Abnormally dry (D0) conditions covered about 30 percent of the region from the southern coastal area of North Carolina, southward through most of South Carolina, southern Georgia, southeastern Alabama and the Florida Panhandle. A small part of the eastern coast of Florida also saw abnormally dry (D0) conditions. Drought conditions expanded in Puerto Rico, with around 16 percent in moderate drought (D1), and 44 percent in abnormally dry (D0) conditions. In Georgia, agricultural producers made a lot of progress this month in crop planting and chemical treatments. Some farmers were able to get in their first cutting of hay. The above average rainfall that occurred in parts of North Carolina this month is causing problems for wheat farmers, who are having issues with pests, especially mites. According to the North Carolina Division of Air Quality (DAQ), pollen concentrations from tree grains reached a peak of 3268 grains per cubic meter across central North Carolina on April 10th. The total pollen count for April 10th was 3278 grains per cubic meter, only second to the record of 3524 grains per cubic meter in 2010. The severe weather outbreak on April 19th caused some damage to several fruit and vegetable crops across north-central Florida.
- For more information, please visit the Southeast Regional Climate Center Home Page.
High Plains Region (Information provided by the High Plains Regional Climate Center)
- Flooding and snowstorms continued to impact the High Plains region into April. The devastation of the flooding that took place in March throughout portions of Nebraska and South Dakota is now being realized. Road damage was extensive across these areas, and the cost of pavement and gravel materials for repair will be expensive. A stretch of Interstate 29 through northwestern Missouri and near the Iowa/Nebraska border was still closed and is not expected to reopen until June. Some railroad lines were also closed, hindering transportation of goods across this portion of the country. Many agricultural fields were ruined and will not be planted this year, as the receding floodwaters left behind sand and garbage. A strong spring storm system brought heavy snowfall to areas of South Dakota, and with warming temperatures following the storm, rapid snowmelt exacerbated flooding issues. Moderate to major flooding was ongoing in April along the Big Sioux and James Rivers in eastern South Dakota, as well as Devils Lake and the Red River of the North in eastern North Dakota.
- Cold and wet soils have delayed planting this year across the region. Areas faring worst were the Dakotas, where persistent cold and snow, as well as flooding, prevented producers from getting out into the fields. According to the April 30th edition of the USDA Weekly Weather and Crop Bulletin, for the week ending April 28th only seven percent of North Dakota's sugar beet acreage had been planted, which was far behind the five-year average of 39 percent. In South Dakota, only seven percent of the oats acreage had been planted compared to the five-year average of 62 percent, with similar statistics for spring wheat acreage. Farther south in Nebraska and Kansas, warm and dry conditions in April allowed producers to catch up, with the percent of corn acreage planted only slightly behind by the end of the month. Winter wheat was faring well across the region for the most part. It was a particularly good year for the crop in Colorado, as 76 percent of the winter wheat acreage was rated good to excellent.
- The temperature pattern changed for much of the region during April, with above-normal temperatures returning to the majority of the High Plains. In southern and western portions of the region, temperatures ranged from near normal to about 4.0 degrees F (2.2 degrees C) above normal, with areas of Colorado and Kansas experiencing the greatest departures. In the Dakotas, however, April temperatures were slightly below normal, with departures of up to 2.0 degrees F (1.1 degrees C) below normal in the eastern portion of both states. Due to the modest temperature departures, April temperatures were not record-breaking. However, April brought temperature extremes to the region.
- A big warmup occurred throughout the High Plains around April 20th-21st, when many areas experienced their warmest temperatures for the month. For instance, Dodge City, KS, Pierre, SD, and Valentine, NE all reached and/or surpassed 90.0 degrees F (32.2 degrees C). However, just a week to 10 days before that, most of the region experienced its coldest temperatures of the month, as temperatures dipped down into the 20s and even teens in some areas. Despite these impressive temperature swings, such extremes are common in the Plains, particularly during the spring months.
- Due to the cold start to spring this year, freeze damage appears to be unlikely throughout the region. According to the National Phenology Network, leaf-out occurred a couple of weeks later than normal for much of the High Plains, which is an indicator that spring arrived late this year. Due to cold temperatures and snow cover, soils have been slow to warm up, which has delayed spring planting throughout the region but especially across the Dakotas.
- Both wet and dry conditions existed throughout the High Plains during April. Pockets of wetness could be found in western areas of Wyoming and Colorado, as well as across much of South Dakota. Otherwise, dryness was present in an area stretching from eastern Colorado through Nebraska and Kansas. As a result, a few locations ranked among the top 10 for driest April. Pueblo, Colorado and McCook, Nebraska had their 6th driest April on record, while it was the 10th driest for Goodland, Kansas. These areas were excessively wet during March, so dry conditions were beneficial for allowing floodwaters to recede and fields to dry out to prepare for spring planting.
- Winter continued well into April for some portions of the region. On April 10th-11th, a powerful storm system traversed the region, producing snow and ice as well as severe weather. Large hail and damaging winds were reported across central and eastern Nebraska and north-central Kansas on the 10th. Meanwhile, snow and ice impacted portions of other states in the High Plains but hit South Dakota particularly hard. Several CoCoRaHS and COOP stations in central and eastern South Dakota reported snowfall totals approaching 30.0 inches (76 cm) from this storm. Huron picked up 18.0 inches (46 cm), which was its highest 2-day total snowfall on record for April (period of record 1888-2019), breaking last year's record of 15.5 inches (39 cm) on April 13th-14th. This storm caused additional livestock losses in an area where conditions have been very difficult for livestock this spring. Melting snow from this system contributed to additional flooding, and ice and wind brought down trees and power lines as well.
- The April snowfall added to what has been an impressive snowfall season throughout portions of the Dakotas and Nebraska. For instance, Mobridge, South Dakota and Lincoln, Nebraska have already had their snowiest seasons on record. As of April 30th, Mobridge had received 86.8 inches (220 cm) of snowfall for the season, crushing the old record of 75.9 inches (193 cm) set in 1997 (period of record 1911-2019). Meanwhile, Lincoln received 55.5 inches (141 cm) of snowfall, narrowly beating the old record of 54.3 inches (138 cm) set in 1960 (period of record 1948-2019). Other locations that ranked among the top 10 of snowiest seasons-to-date include Aberdeen, SD (3rd snowiest), Pierre, SD (4th snowiest), Grand Forks, ND (5th snowiest), Omaha, NE (7th snowiest), and Huron, SD (8th snowiest).
- Mountain snowpack continued to be near to above normal throughout much of Colorado and Wyoming during April. As of the beginning of May, Snow Water Equivalent (SWE) was well above normal in all basins in Colorado. In Wyoming, SWE was near to above normal in western and southern basins, while it was below normal in the north-central part of the state. In the Upper Missouri Basin, mountain SWE above Fort Peck Reservoir and between Fort Peck and Garrison Reservoirs increased slightly to 103 percent of average and 99 percent of average, respectively, by the beginning of May. Snowpack peaked during April in both reaches. Above Fort Peck Reservoir, snowpack peaked on April 18th at 105 percent of the normal April 15th peak. Between Fort Peck and Garrison Reservoirs, snowpack peaked on April 17th at 104 percent of the normal April 15th peak.
- Areas of the High Plains experienced both improvements and degradations in drought conditions during April, although the overall coverage decreased. Over the course of the month, the area experiencing abnormal dryness or drought (D0-D4) decreased from approximately 11 percent to 9 percent. The area in drought (D1-D4) decreased from two percent to about a half of a percent. According to the U.S. Drought Monitor, this is the least amount of drought the High Plains region has experienced since 2017 when the May 16th map indicated only 0.11 percent of the region in D1-D4. In fact, national coverage of drought hit a historic low in April, with the U.S. Drought Monitor indicating the least amount of drought in the contiguous U.S. since its inception in 1999.
- Thanks to a continuation of good snowpack conditions in Colorado, moderate drought (D1) was confined to a small area in the southwestern portion of the state, and abnormally dry conditions (D0) were reduced as well. Above-normal precipitation in April allowed for the elimination of D1 and reduction of D0 in western Wyoming. However, the Bighorn Mountains in north-central Wyoming missed out on precipitation and Snow Water Equivalent was below normal, prompting the introduction of D1 conditions in the area. Other areas of the High Plains that have missed out on precipitation during the past few months include northwestern North Dakota and a small pocket of south-central Kansas, where D0 conditions were introduced during April.
- For more information, please visit the High Plains Regional Climate Center Home Page.
Southern Region (Information provided by the Southern Regional Climate Center)
- Temperatures for the month of April varied spatially across the Southern region. Parts of southern and eastern Texas as well as southwestern Louisiana experienced temperatures 2 to 3 degrees F (1.11 to 1.67 degrees C) below normal. Parts of southern, eastern, and central Texas, southern and central Louisiana, southern Arkansas, and western Mississippi experienced temperatures 1 to 2 degrees F (0.56 to 1.11 degrees C) below normal. Conversely, parts of western and northern Texas, central, western, and eastern Oklahoma, northern Arkansas, and central and western Tennessee experienced temperatures 1 to 2 degrees F (0.56 to 1.11 degrees C) above normal. Parts of far western Texas, northeastern Oklahoma, and western Tennessee experienced temperatures 2 to 3 degrees F (1.11 to 1.67 degrees C) above normal. The statewide monthly average temperatures were as follows: Arkansas – 60.80 degrees F (16.00 degrees C), Louisiana – 63.40 degrees F (18.56 degrees C), Mississippi – 63.10 degrees F (17.28 degrees C), Oklahoma – 60.50 degrees F (15.83 degrees C), Tennessee – 59.20 degrees F (15.11 degrees C), and Texas – 65.10 degrees F (18.39 degrees C). The statewide temperature rankings for April were as follows: Arkansas (fifty-sixth warmest), Louisiana (forty-sixth coldest), Mississippi (fifty-sixth coldest), Oklahoma (forty-second warmest), Tennessee (forty-fourth warmest), and Texas (forty-eighth warmest). All state rankings are based on the period spanning 1895-2019.
- Precipitation values for the month of April were above normal across much of the Southern Region. Parts of western Oklahoma as well as far northern, far western, and southeastern Texas received 50 percent or less of normal precipitation. Parts of far western Oklahoma received 25 percent or less of normal precipitation. In contrast, parts of western, central, southern, northern, and eastern Texas, southern, central, and eastern Oklahoma, southwestern, central, and eastern Tennessee, and most of Arkansas, Louisiana, and Mississippi received 150 percent or more of normal precipitation. Parts of western, central, northern, and eastern Texas, southwestern Oklahoma, southern Arkansas, northern, central, and southern Louisiana, and central and northwestern Mississippi received precipitation 200 percent or more of normal. Parts of western and central Texas received precipitation 300 percent or more of normal. The statewide precipitation totals for the month were as follows: Arkansas – 8.05 inches (204.47 mm), Louisiana – 8.55 inches (217.17 mm), Mississippi – 8.98 inches (228.09 mm), Oklahoma – 4.04 inches (102.62 mm), Tennessee – 5.74 inches (145.80 mm), and Texas – 3.52 inches (89.41 mm). The state precipitation rankings for April were as follows: Arkansas (fifteenth wettest), Louisiana (eighth wettest), Mississippi (eleventh wettest), Oklahoma (thirty-eighth wettest), Tennessee (twenty-ninth wettest), and Texas (twentieth wettest). This was the ninth wettest April on record for the Southern Region. All state rankings are based on the period spanning 1895-2019.
- At the end of April, drought conditions both improved and degraded across parts of the Southern Region. Severe drought classifications are no longer present, with conditions having improved substantially across southern Texas to the point where severe drought classifications were removed. Moderate drought classifications were still present in parts of southern Texas, with new areas appearing in western Texas and southeastern coastal Mississippi. However, conditions improved to the point where moderate drought classifications were removed across parts of southern Texas. There were no drought conditions in Oklahoma, Tennessee, Louisiana, and Arkansas. There was a decrease in the overall area experiencing abnormally dry conditions, as areas in northern, southern, and central Texas as well as southern Louisiana saw improvement. However, abnormally dry conditions developed across parts of eastern Texas.
- In April, there were a total of 880 storm reports across Oklahoma, Texas, Arkansas, Louisiana, Mississippi, and Tennessee. There were 143 tornado reports, 267 hail reports, and 470 wind reports. Mississippi tallied the most tornado (71) and wind (149) reports, while Texas tallied the most hail reports (169). Texas tallied the most reports total (341) while Tennessee tallied the least (19). Every state except for Tennessee reported tornadoes.
- On April 6, 2019, there were 73 storm reports across Texas, Arkansas, Louisiana, Mississippi, and Tennessee. There were 3 tornado reports in Texas, all short-lived with EF-0 strength. There were two reports of softball-sized hail near Grapeland, Texas and Alto, Texas. A wind gust of 60 mph (96.56 kph) was reported near Hondo, Texas.
- On April 7, 2019, there were 107 storm reports across Texas, Louisiana, Arkansas, Mississippi, and Tennessee. There were 8 tornado reports across Texas, Louisiana, and Mississippi, the strongest of which was an EF-1 reported near Arlington Heights, Texas. Egg-sized hail was reported near Lexington, Mississippi. A wind gust of 74 mph (119.09 kph) was reported near Harlingen, Texas.
- On April 13, 2019, there were 179 storm reports across Texas, Louisiana, Mississippi, Arkansas, and Tennessee. There were 38 tornado reports across Texas, Louisiana, and Mississippi. One person was killed by an EF-3 tornado reported near Hickory Creek, Texas, while another person was killed by a tornado near Aberdeen, Mississippi. In addition, at least 25 injuries were reported due to tornadoes in Texas and Mississippi. Tea-cup sized hail was reported near Mico, Texas; Helotes, Texas; and The Dominion, Texas.
- On April 17, 2019, there were 119 storm reports across Texas, Oklahoma, Arkansas, and Louisiana. There were 8 tornado reports across Texas and Oklahoma. Tea-cup sized hail was reported near Selman, Oklahoma. A wind gust of 74 mph (119.09 kph) was reported near Denton, Texas, while a 70 mph (112.65 kph) wind gust was reported near Noble, Oklahoma. Two injuries were reported near Centerville, Texas after a NWS storm survey determined winds approaching 85 mph (136.79 kph) displaced a manufactured home.
- On April 18, 2019, there were 130 storm reports across Texas, Oklahoma, Louisiana, Mississippi, and Tennessee, with 105 of the 130 reports occurring in Mississippi. There were 42 tornado reports across Mississippi. A wind gust of 74 mph (119.09 kph) was reported near Hobart, Oklahoma. Two people were injured near Gretna, Louisiana after a power line was blown down, landing upon two vehicles, while one person near Deemer, Mississippi was killed after high winds blew a tree down onto an occupied vehicle.
- On April 24, 2019, there were 15 tornadoes across Texas and Louisiana. Two people were injured near Steep Hollow, Texas and Huxley, Texas, while two people were killed by an EF-3 tornado that directly impacted Ruston, Louisiana.
- On April 25, 2019, a wind gust of 70 mph (112.65 kph) was reported near Donaldsonville, Louisiana. One person was injured after a tree was blown down onto a vehicle near Pleasant Hill, Louisiana.
- On April 30, 2019, there were multiple tornadoes reported across Texas, Oklahoma, and Arkansas, with at least one person injured due to a tornado near Blue, Oklahoma. Baseball sized hail was reported near Ozona, Texas, and a wind gust of 65 mph (104.61 kph) was reported near Talala, Oklahoma.
- For more information, please visit the Southern Regional Climate Center Home Page.
Western Region (Information provided by the Western Region Climate Center)
- Several storms tracked across the West this month, providing above normal precipitation and drought relief to the Pacific Northwest as well as the Intermountain West. Temperatures were above normal across most of the West, with the exception the of the northern Rockies.
- Precipitation was greater than 130% of normal across much of the Pacific Northwest and Intermountain West this month due to an active storm cycle. Seattle, Washington, observed 5.69 inches (114.5 mm) precipitation, achieving the 3rd wettest April since records began in 1945. In eastern Washington, Pullman recorded 3.69 in (93.7 mm) of precipitation, 211% of normal and the 4th wettest April since observations began in 1940. Further south, Bend, Oregon, logged 2.26 in (57.4 mm), 290% of normal and the 2nd wettest April in a 118-year record. The above normal precipitation across Oregon supported large areas of improvement in drought conditions, with only 17% of Oregon experiencing abnormally dry conditions at the end of April compared to 82% at the end of March. In the Intermountain West, Ely, Nevada, observed 2.79 inches (70.8 mm) of precipitation, 294% of normal. Pocatello, Idaho, recorded 2.03 inches (51.5 mm), 180% of normal and the 10th wettest April since records began in 1939. A few areas of the Southwest also reported above normal precipitation. Los Lunas, New Mexico, recorded 1.46 inches (37.1 mm), nearly 250% of normal and the 5th wettest April since observations began in 1957. Some areas of drought improvement were observed northern and central New Mexico this month; area of the state experiencing moderate or worse drought was reduced from 39% to 23% over the course of the month. Above normal snowpack conditions persisted through April in many western mountain ranges. The Sierra Nevada, Great Basin ranges, and Colorado Plateau had snow water equivalent values ranging from 125-200% of normal at the end of the month. Somewhat mild conditions have helped reduce the risk of significant snowmelt flood concerns across the major river basins in these areas.
- Mostly dry, spring-like conditions were observed in California during April as the area transitions into its dry season; precipitation totals are generally low during this month. Along California's Central Coast, Paso Robles recorded 0.11 inches (2.8 mm), 16% of normal. Further south, Los Angeles observed 0.02 inches (0.5 mm), 2% of normal. Arizona also observed fairly dry conditions this month, a typically dry period following winter storms and preceding the onset of the Southwest Monsoon. Both Tucson and Prescott, Arizona, recorded nominal amounts of precipitation this month, 0.07 inches (1.8 mm) and 0.09 inches (2.3 mm), respectively.
- With the exception of the northern Rockies, temperatures were generally 1-5 F (0.5-3 C) warmer than normal throughout the West. In Nevada, Reno reported a monthly average temperature of 55.3 F (12.9 C), 4.4 F (2.4 C) above normal, and the 2nd warmest April in an 82-year record. Further west, in California, Fresno reported an average temperature of 67.1 F (19.5 C), 5.1 F (2.8 C) above normal and the 4th warmest April since records began in 1949. Elsewhere in the West, temperatures were generally within 3 F (1.6 C) of normal.
- Temperatures across Alaska were warmer than normal with variable precipitation. Along Alaska's west coast, Kotzebue reported an average temperature of 25.3 F (-3.7 C), 12.4 F (6.8 C) above normal. This was the warmest April since observations began in 1897 and marks the third consecutive month to set, or contest, a monthly average temperature record. In central Alaska, Fairbanks observed an average temperature of 37.0 F (2.7 C), 3.3 F (1.8 C) above normal and the 12th warmest April in a 90-year record. The continued warmth across Alaska promoted ice break-up on several prominent rivers. While river break-up is not particularly uncommon during the month of April, several rivers, such as the Tanana River in central Alaska, had the earliest break-up of record by six or more days. Precipitation was well below normal across central Alaska and above normal along South Central and Southeastern Alaska. In Alaska's panhandle, Haines observed 3.95 inches (100 mm), 194% of normal; however, the panhandle as a whole remains in long-term moderate to severe drought. Further south, precipitation was variable across the state of Hawaii. Honolulu observed 0.20 inches (5 mm) and Hilo recorded 13.51 in (343 mm), 32% and 117% of normal, respectively. This was the 8th driest March at Honolulu since records began in 1940. Drought conditions improved on the windward side of the Big Island and Maui this month, while conditions intensified on the leeward sides of nearly all islands. By the end of April, more than 37% of the state was experiencing moderate to severe drought conditions.
- April (all month): Bering Sea ice remained exceptionally low: By the end of April, anomalously warm conditions continued to deteriorate sea ice along Alaska's west coast. The April mean extent was 29% of the 1981-2010 mean and second lowest on record.
- April (all month): Cool, wet start to spring has delayed crop production in Idaho: Farmers across the state have delayed planting their crops due to excessive soil moisture and erosion caused by several passing storms throughout the month of April.
- April 29th: Late season snow storm traps unsuspecting boaters in Montana: Two boats were capsized on Holter Lake due to high winds and low visibility from blowing snow during a late season winter storm. One person was killed and five others were injured.
- For more information, please go to the Western Regional Climate Center Home Page.