National Overview

January Highlights
January Temperature
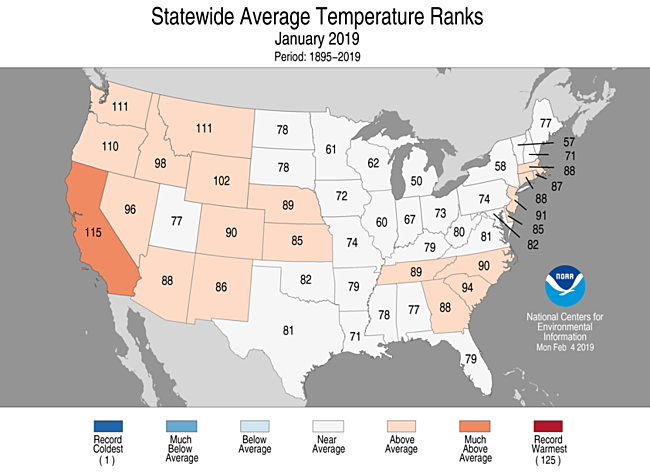
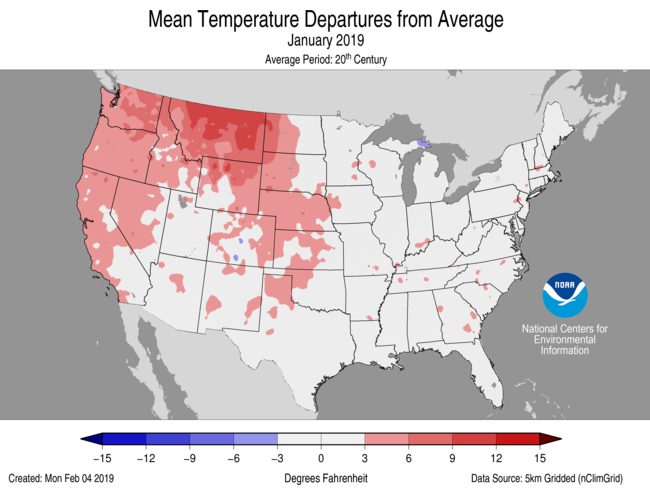
- For January, the average contiguous U.S. temperature was 32.7°F, 2.6°F above the 20th century average, ranking in the warmest third of the 125-year period of record.
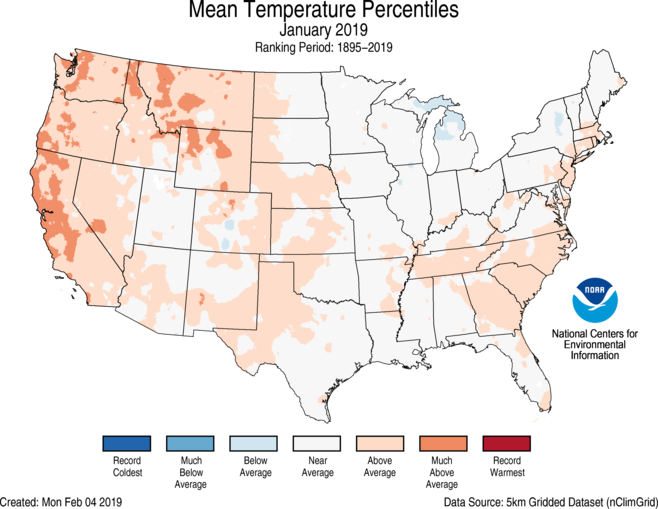
- Parts of the southeast, mid-Atlantic, High Plains and western U.S. were warmer than average. California ranked 11th warmest in January and was the only state to rank much-above-average for the month. No state ranked below average for the month.
- Below-average temperatures were confined to parts of Michigan, New York and Colorado. A significant cold air outbreak across the High Plains and Great Lakes at the end of January resulted in many record daily cold temperatures across the region. All-time record cold temperatures were reported in parts of the Midwest on 31 January including Moline, IL (-33°F, previous record was -28°F from 3 Feb 1996), Rockford, IL (-31°F, previous record was -27°F from 10 Jan 1982), and Cedar Rapids, IA (-30°F, previous record was -29°F from 15 Jan 2009). On 31 January, Mount Carroll, IL recorded a temperature of -38°F, which is two degrees colder than the current Illinois record of -36°F set on 5 January 1999 in Congerville, IL. This potential new record will be reviewed by the State Climate Extremes Committee in the coming weeks.
- The Alaska January temperature was 7.4°F, 5.2°F above the long-term average. This ranked in the warmest third of the 95-year period of record for the state. Cold temperatures during mid-January were flanked by warmer temperatures at the beginning and the end of the month.
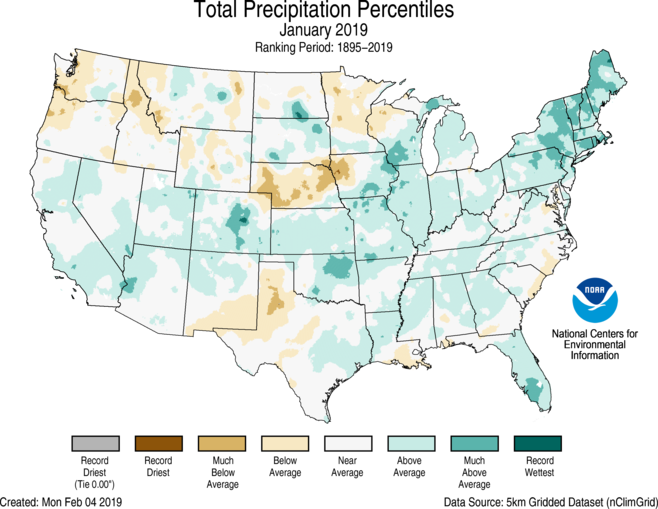
January Precipitation

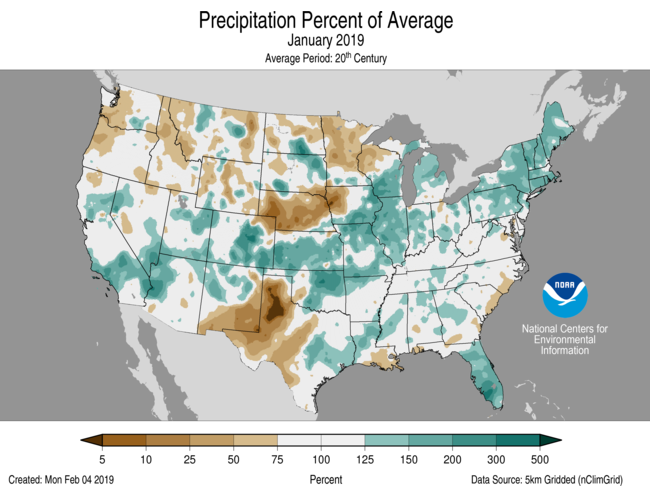
- The January precipitation total was 2.49 inches, 0.18 inch above the 20th century average. This ranked among the wettest third on record.
- During January, much-above-average precipitation was concentrated across the Northeast, parts of the Midwest, High Plains and Florida. Above-average precipitation was scattered from California eastward to the Midwest and Great Lakes as well as into parts of the South and mid-Atlantic.
- Much-below-average precipitation occurred across portions of Nebraska and Iowa. Below-average precipitation was scattered across the northern Tier, Northwest and parts of New Mexico and Texas.
- On January 20, up to two feet of snow fell across portions of the Northeast contributing to a record snowiest January for Caribou, ME — 59.8 inches. This shattered the previous record of 44.5 inches set back in 1994 and nearly broke the all-time snowiest month on record for Caribou (59.9 inches), which occurred in December of 1972.
- According to the 29 January U.S. Drought Monitor report, 16.5 percent of the contiguous U.S. was in drought, down nearly 5 percent from the beginning of the month.
Regional Highlights
These regional summaries were provided by the six Regional Climate Centers and reflect conditions in their respective regions. These six regions differ spatially from the nine climatic regions of the National Centers for Environmental Information.
Northeast Region (Information provided by the Northeast Regional Climate Center)
- January's average temperature of 23.3°F (-4.8°C) was 0.1°F (0.1°C) warmer than normal for the Northeast. Ten of the region's twelve states experienced an above-normal January average temperature, with departures for all states ranging from 1.2°F (0.7°C) below normal in New York to 1.4°F (0.8°C) above normal in Massachusetts and West Virginia.
- The first month of 2019 brought above-normal precipitation to the Northeast. The region's 4.39 inches (111.51 mm) of precipitation, 141% of normal, made it the 16th wettest January since records began in 1895. All states were wetter than normal, with seven ranking this January among their 20 wettest on record: Rhode Island and Vermont, eighth wettest; New Hampshire and New York, 11th wettest; Maine, 13th wettest; Connecticut, 14th wettest; and Massachusetts, 17th wettest. Precipitation ranged from 107% of normal in Maryland to 168% of normal in Rhode Island. Caribou, Maine, had its wettest January on record.
- The January 1 U.S. Drought Monitor showed 3% of the Northeast as abnormally dry. Above-normal precipitation allowed abnormally dry conditions to ease in northern New York in early January and in northern Vermont and northern Maine later in the month. The January 22 U.S. Drought Monitor showed the Northeast was free of drought and abnormal dryness for the first time since June 6, 2017. The region remained free of dryness for the rest of the month.
- Mercer County, Pennsylvania, had its first January tornado on record (since 1950) when an EF-1 tornado snapped and uprooted trees on January 8. A major storm moved through the region from January 19 to 21. Storm snow totals were up to 24 inches (61 cm), with the greatest amounts in New York and northern New England. The storm also produced ice accumulations of up to 0.60 inches (1.5 cm), with the greatest amounts in Connecticut, and rain totals of up to 4 inches (102 mm), with the greatest amounts in eastern Massachusetts and Rhode Island. The precipitation and wind gusts of up to 61 mph (27 m/s) contributed to downed trees, power outages, travel disruptions, and flooding. An Arctic front produced intense snow squalls that led to a few multi-vehicle accidents on January 30. Behind the front, cold air poured into the region and strong winds created subzero wind chills. A multi-day lake-effect event unfolded east of Lakes Erie and Ontario in New York, with snow totals up to 37.6 inches (95.5 cm) south of Watertown and up to 21 inches (53.3 cm) in Buffalo from January 29 through February 1. Whiteout and blizzard conditions led to extremely difficult travel, with travel bans enacted and some road closures. Caribou, Maine, recorded its snowiest January on record with 59.8 inches (151.9 cm) of snow. This was just 0.1 inches (0.25 cm) short of tying its all-time snowiest month, December 1972 with 59.9 inches (152.1 cm).
- For more information, please visit the Northeast Regional Climate Center Home Page.
Midwest Region (Information provided by the Midwest Regional Climate Center)
- January precipitation was above normal for much of the Midwest (131% of normal). Statewide numbers put precipitation even higher in Illinois (157%), Missouri (150%), Iowa (140%), and Indiana (134%). Four additional states had between 118 and 129% of normal. Only Minnesota was drier than normal with just 73% of normal in January. The driest areas of the region were in western Iowa where precipitation was less than 25% of normal and from central Minnesota into northwestern Wisconsin where a large area was less than 75% of normal and smaller areas had less than 50% of normal. The wettest area stretched from northern Missouri, through eastern Iowa and northwestern Illinois, into southern Wisconsin where precipitation totals where two to three times normal.
- January temperatures were below normal in the northern half of the Midwest and slightly above normal in the Missouri boot heel and across southern Kentucky. Temperatures were as much as 5°F (3°C) below normal in the northernmost reaches of the Midwest. The monthly average hides the extreme temperature swing from the very warm start to the month to the record-breaking Arctic freeze in the last few days of January. Temperatures were 10 to 12°F (6 to 7°C) above normal in the first week of January across the majority of the region. As the month progressed, temperatures dropped until the Arctic outbreak on January 30th through February 1st dropped temperatures to values not seen since the 1990s in many locations. Daily record low temperatures were recorded at more than 400 stations on January 30th and another 600 stations on the 31st. All-time station record for low maximum and low minimum were also set at dozens of stations in the Midwest. Several stations, including Beloit, Wisconsin, Moline, Illinois, and Rockwell City, Iowa, broke all-time record low minimum temperatures on January 30th only to break the day-old record again on the 31st. Notable all-time records were set at long-term stations (127 period of record) with -30°F (-34°C) at Cedar Rapids, Iowa, -32°F (-36°C) at Iowa City, Iowa (tied record), and -31°F (-35°C) at Rockford, Illinois. Although not yet certified, it appears that the Illinois statewide minimum temperature record was also broken with -38°F (-39°C) recorded at Mount Carroll, breaking the 1999 record of -36°F (-38°C) at Congerville.
- At least ten deaths in the Midwest were attributed to the weather in the last couple days of January. State of emergency were declared in Wisconsin, Illinois and Michigan. More than 1000 flights were cancelled at Chicago's O'Hare Airport, Amtrak service to and from Chicago was cancelled on the 30th, classes were cancelled at schools and universities on the 30th and 31st, and even postal service was suspended on the 30th in parts of Minnesota, Iowa, Illinois, and Wisconsin to limit postal carrier's exposure due to the dangerous cold and wind chills. In Michigan and Minnesota there were calls to lower thermostats due to the enormous natural gas demand for heating. Wind chills dropped to the -50s and -60s in °F (-46 to -57 °C) in the upper Midwest.
- January brought heavy snows to the region. There were four major snowstorms affecting the Midwest in January. Monthly snowfall totals topped 12 inches (30 cm) from the Iowa-Missouri border to northern Michigan where totals topping 3 to 4 feet (91 to 122 cm) were common. Snowfall totals in northern Missouri, southeastern Iowa, west central Illinois and southern Illinois had more than three times their normal snowfall in January. A much larger area had more than twice normal and another area in southeastern Indiana, southwestern Ohio, and extreme northern Kentucky also had twice normal snowfall. On the other hand, large parts of Minnesota and Wisconsin had less than 75% of normal and a small pocket of northwestern Iowa and some locations along the southern edge of the region had less than 25% of normal.
- Drought was completely removed from the Midwest as of the January 1st release of the US Drought Monitor and the region remained drought free throughout the month. The abundant rains that led to 2018 setting a new regionwide record (1895-2018 period) for precipitation and then a wet January for much of the region provided ample wetness for the region.
- For further details on the weather and climate events in the Midwest, see the weekly and monthly reports at the Midwest Climate Watch page.
Southeast Region (Information provided by the Southeast Regional Climate Center)
- Nearly all of the Southeast was warmer than normal in January as a whole, with most areas reporting temperatures that were 2-4°F (1.1 to 2.2°C) above the 1981-2010 average. The only region on the mainland that was colder than normal was the west coast of the Florida peninsula, including Fort Myers, FL (1903-2019; 0.7°F or 0.4°C colder than normal). Stations in Puerto Rico were also near to slightly cooler than normal. The first week of the year was exceptionally warm, with much of the region recording mean temperatures more than 10°F (5.5°C) warmer above normal. In the last week of the month, however, a cold spell resulted in temperatures ranging from 4 to 9°F (2.2 to 5.0°C) colder than normal. Because of the canceling effect of the early month warmth and the late month coolness, not a single station in the Southeast reported a temperature that was ranked in the top ten coldest or warmest. Hastings, FL (1978-2019; tied for 11th warmest), Mayport, FL (1976-2019; 12th warmest), Murfreesboro, TN (1975-2019; tied for 12th warmest) and Winchester, VA (1984-2019; tied for 12th warmest) were the highest ranked stations in the region. Stations that were the most above normal include Muscle Shoals, AL (1893-2019; 2.1°F or 1.2°C warmer than normal), Pensacola, FL (1879-2019; 2.0°F or 1.1°C), Key West, FL (1871-2019; 1.9°F or 1.1°C), Augusta, GA (1873-2019; 3.6°F or 2.0°C), San Juan, PR (1898-2019; 2.1°F or 1.2°C above), Lumberton, NC (1903-2019; 3.9°F or 2.2°C), Charleston, SC (1938-2019; 2.6°F or 1.4°C), and Norfolk, VA (1871-2019; 2.1°F or 1.2°C warmer than normal). During the last week of January, very cold temperatures spread through a wide region of the Southeast. The coldest temperatures at most Southeastern stations occurred on the morning of January 21, as a cold dome of Arctic air moved south behind a strong cold front. A second blast of Arctic air flowed into the region on January 30, with temperatures a few degrees warmer than the frigid air of January 20-21. The coldest temperature at any site in January was -7°F (-22°C) at Mount Mitchell, NC on the 21st, followed by -5°F (-21°C) at Copper Hill, VA on the 22nd. Niceville, FL reported 19°F (-7°C) on the 29th in the western Panhandle. The coldest temperature in Puerto Rico was 50°F (10°C) at Adjuntas Substation on the 26th.
- Precipitation varied widely across the Southeast during January. While most areas received rainfall well in excess of normal, a region of relatively dry conditions stretched along the coastal plain from southern Alabama eastward through southern Georgia and northern Florida to the East Coast in South and North Carolina. Precipitation in this region was generally 70 to 90% of normal, with isolated pockets receiving less than half their usual amount. Most of Puerto Rico also received less than normal rainfall, with San Juan (1898-2019) receiving 1.66 inches (42 mm) less than normal. However, Roosevelt Roads (1968-2019; 10th wettest) in Ceiba, PR, on the far eastern end of the island, received 4.01 inches (102 mm), 1.37 inches (35 mm) wetter than normal. The wettest part of the Southeast was the southern half of the Florida peninsula, which received rainfall amounts up to 200% wetter than normal. Fort Lauderdale Beach (1985-2019; 2nd wettest) observed 4.75 inches (121 mm), 2.11 inches (54 mm) wetter than normal, and Fort Myers (1902-2019; 6th wettest) reported 5.10 inches (130 mm), 3.16 inches (80 mm) wetter than normal. Most of Fort Myers' rain for the month fell on, January 27 (3.67 inches, 93 mm), setting a new record for a January one-day precipitation total. On the same date, West Palm Beach (1888-2018) received 2.78 inches (71 mm), and Daytona Beach (1923-2019) received 1.97 inches (50 mm). Other stations around the Southeast with highly ranked monthly precipitation totals include Madison, AL (1953-2019; 5th wettest; 8.97 inches or 228 mm), Rome, GA (1970-2019; 9th wettest; 6.82 inches or 173 mm), Marion, NC (1911-2019; 5th wettest; 7.26 inches or 184 mm), and Wallops Island, VA (1966=2019; tied for 8th wettest; 4.20 inches or 107 mm). A snowstorm hit parts of Northern Virginia on January 13, as a strong low pressure system developed along the East Coast. Washington Reagan (1871-2019) received 10.3 inches (262 mm) from the storm and Washington Dulles (1962-2019) received 10.6 inches (269 mm). Most government offices in the vicinity of Washington DC that were not affected by the government shutdown were closed due to the treacherous driving conditions. The DC area received an additional 1.0 inch (25 mm) on January 17-18, and Dulles and outlying areas received 3 inches (76 mm) on the 29th and 30th. For the month, Washington Dulles reported 15.5 inches (394 mm) and Washington Reagan reported 11.5 inches (292 mm). On January 29, snowfall of 0.5 inches or less (13 mm) was reported at several CoCoRaHS stations in Alabama.
- There were 71 severe weather reports for January 2019, compared to the median of 60 reports from 2000-2016. Eight tornadoes were reported during the month. Early in the morning on January 4, an EF-0 tornado with maximum winds of 85 mph (38 m/s) briefly touched down near Abbeville in Henry County, AL. A half-hour later, a EF-1 tornado briefly touched down just east of the Alabama border near Zetto in Clay County, GA and impacted a single family residence. Part of the roof was ripped off from an attached carport as well as a garage. Trees were uprooted and large branches impacted the residence. On January 19, a short-lived EF-1 tornado with winds of 90 mph (40 m/s) touched down on Tyndall Air Force Base in the western Panhandle of Florida. It moved a car, broke car windows, tore a portion of a new roof off some barracks, and flipped dumpsters and garbage cans on their sides. One EF-2 and three EF-1 tornadoes also occurred in Alabama on the 19th ahead of an approaching cold front. The storms caused damage to trees, buildings, and irrigation equipment. The EF-2 tornado in Elmore County, AL destroyed a church in Wetumpka and tossed several vehicles. A weak EF-0 tornado and strong downburst were also observed on January 27 in Hialeah, FL, causing damage to trees and small buildings. In addition to the tornado damage, 45 reports of wind damage were noted. A strong low pressure system on January 23 and 24 brought strong gusty winds to parts of the Southeast, including numerous reports of wind damage to Florida, Alabama, and Georgia and wind gusts of 56 mph (25 m/s) to Charleston, SC and 50 mph (22 m/s) to Washington Dulles. Heavy rain and localized flooding were reported on January 4 in Pike and Upson Counties southwest of Atlanta in Georgia, as a quick-moving low pressure system traveled towards the northeast. Numerous reports of heavy rain and flash flooding were reported in eastern Virginia and North Carolina on January 12 as a strengthening low pressure system moved northeastward off the coast of South Carolina.
- The only areas of the Southeast that experienced dry conditions in January were the southern half of the Florida peninsula and parts of Puerto Rico. At the beginning of the month, moderate (D1) drought covered almost 23% of Florida. Over the next two weeks, the drought expanded and worsened, and an area of severe (D2) drought formed along the east coast of the peninsula from Melbourne south to West Palm Beach, FL. At its maximum extent, however, severe drought conditions (D2) only covered slightly more than 3% of Florida. In the last week of January, a nearly stationary front brought heavy rain to the dry areas, resulting in the elimination of severe (D2) drought from the Southeast and a reduction in moderate (D1) drought to cover less than 4% of Florida. In Puerto Rico, the area of moderate (D1) drought in the center of the island decreased over the month, but a second area of moderate drought developed along the southwest coast near Cabo Rojo during January and dry conditions expanded nearby. By the end of January, three-quarters of the island was categorized as abnormally dry, with nearly 9% in moderate drought. Wet soil continued to be a problem for cotton producers who were still trying to harvest their crops in January. In early January, 10-15% of the Georgia crop was still in the field, but by the end of the month that had been reduced to about 5-10% of the acreage. Some fields may not be harvested at all due to loss of yield from Hurricane Michael's winds back in October. Forage quality and quantity continued to be a problem for many livestock producers in northern Florida. Supplies were tight due to losses from Hurricane Michael, and the heavy rains since then have made it difficult to get new fields established. Those that were planted and fertilized had a lot of the fertilizer washed away by the rain, resulting in poor stands. Weed-related livestock poisoning was abnormally high because low-quality hay forced hungry cattle to feed on toxic weeds found at the edge of pastures. Warm weather in the first half of January improved strawberry harvests after a slow-down in December due to cooler temperatures and rain.
- For more information, please visit the Southeast Regional Climate Center Home Page.
High Plains Region (Information provided by the High Plains Regional Climate Center)
- Despite near normal temperatures for the month on the whole, a significant cold event impacted the Northern Plains and Midwest at the end of January. On the 29th-30th, an Arctic air mass settled over the region, and bitterly cold temperatures were observed. Gusty winds created dangerous wind chills, particularly throughout the eastern Dakotas, Minnesota, Wisconsin, and northern portions of Iowa and Illinois. The extreme wind chills prompted the widespread closure of schools, universities, and state and local governments, and the U.S. Postal Service even suspended mail delivery for many areas. Numerous shelters were opened in communities so that people could take refuge from the cold. Unfortunately, several fatalities occurred. In Chicago, warming buses were used to support grounds crew at the airports, and Amtrak cancelled train service to and from the city for two days. The presence of snow and gusty winds created blowing snow that lowered visibility, impeding travel in many areas. Numerous traffic accidents were reported, causing injuries and a few fatalities. In northeastern North Dakota, the North Dakota Highway Patrol issued a No Travel Advisory due to blowing snow.
- Other than the extreme cold, the other big story of the month was January precipitation helped boost snowpack in Colorado. Ski resorts were enjoying extra business this year, especially compared to last year when the lack of snow caused many resorts to close. According to the Telluride Daily Planet, the Telluride Ski Resort has reported 181.0 inches (460 cm) of snowfall so far this ski season. While many people feel like the drought is over in Colorado, it is important to remember that there are many lingering impacts. For instance, while the snowpack season has been plentiful so far, dry soils are likely to absorb a lot of moisture when the snow melts, which may decrease spring runoff. Decreased spring runoff has negative implications for water supply, as reservoirs are severely depleted from the drought and will take a lot of water to be replenished. Suffice it to say, lasting drought impacts may not be realized in Colorado until this spring.
- Average temperatures in January varied across the region, with below-normal temperatures present across the eastern Dakotas and western areas of Wyoming and Colorado, and above-normal temperatures elsewhere. For the most part, monthly average temperatures were only slightly above or below normal and did not produce widespread temperature records, although Chadron, Nebraska had its 6th warmest January on record. However, average temperatures masked the extremes experienced by much of the region, as the first part of January was quite warm, while the month ended with extreme cold.
- An extreme cold event occurred across portions of the Northern Plains and Midwest on January 29-30. An arctic air mass settled over the region and, combined with gusty winds, produced dangerous wind chills and a life-threatening situation for these areas. In the High Plains, the eastern Dakotas were most impacted by this event, although the bitter cold was experienced in other areas as well. Minimum temperatures bottomed out in the -40s with wind chills as low as -62.0°F (-52.2°C), which was observed at the airport in Grafton, North Dakota. Numerous locations set new daily records for both lowest maximum and lowest minimum temperatures. For instance, on the 30th, the high temperature in Bottineau, North Dakota was -26.0°F (-32.2°C) and the low temperature was -44.0°F (-42.2°C), which became the new record cold high and record low for this day. Aberdeen, South Dakota got down to -37.0°F (-38.3°C) on the 30th, which was its 6th coldest January temperature on record and 16th lowest temperature on record for any month. Aberdeen also had a record cold high that day of -15.0°F (-26.1°C).
- Both wet and dry conditions could be found throughout the High Plains in January. Wet areas included portions of Colorado and Kansas, where precipitation exceeded 150% of normal. It was especially wet in Alamosa, Colorado, where 1.17 inches (30 mm) of liquid equivalent precipitation fell, resulting in its 2nd wettest January on record. Meanwhile, dryness was present throughout much of Nebraska and portions of Wyoming, where precipitation was less than 50% of normal. It was extremely dry in western Nebraska, as Hastings and McCook both had their 9th driest Januarys on record. McCook only recorded a trace of precipitation, while Hastings only received 0.07 inch of liquid equivalent precipitation (2 mm).
- It was a snowy January for some parts of the region. In addition to having its 2nd wettest January on record, Alamosa, Colorado also had its 2nd snowiest January on record. Alamosa received 19.0 inches (48 cm) of snowfall, which was 15.0 inches (38 cm) above normal for the month. On the 11th, 7.6 inches (19 cm) of snow fell, which was the highest 1-day total snowfall ever recorded at Alamosa in January. It was also quite snowy in Concordia, Kansas in January. Concordia received more than double its normal snowfall and had its 8th snowiest January on record. Concordia also tied for its 6th highest 1-day total snowfall on record for January, with 6.4 inches (16 cm) falling on the 22nd.
- It has also been a snowy season for several locations thus far. In addition to having its 2nd snowiest January, season-to-date snowfall for Alamosa, Colorado ranked 8th among the snowiest July-January periods. Lincoln, Nebraska has also had a snowy season. By the end of January, Lincoln had received 26.0 inches (66 cm) of snowfall, which was its 4th snowiest July-January period. Lincoln has already surpassed its annual normal snowfall of 25.9 inches (66 cm), with plenty of the snow season left to go. Even with the ample snowfall, though, this does not necessarily mean that new records will be broken, as Lincoln still has a long way to go to reach the top 10 of snowiest seasons! Interestingly enough, Norfolk, Nebraska, which is approximately 120 miles northwest of Lincoln, only received 11.8 inches (30 cm) of snowfall from July-January, which was 5.5 inches (14 cm) below normal. There was a stark contrast in snowfall between the two locations in January as well, as Lincoln's snowfall was 3.1 inches (8 cm) above normal, while Norfolk's snowfall was 4.7 inches (12 cm) below normal.
- Cold and snowy conditions helped build mountain snowpack in Wyoming and Colorado in January. By the end of the month, Snow Water Equivalent (SWE) was above normal in most Colorado basins with the exception of the southwestern portion of the state, although it is worth noting that snowpack was improving in these areas. Above-normal snowpack was present throughout most of Wyoming except for in the Wind River Range. In the Upper Missouri Basin, mountain SWE above Fort Peck Reservoir and between Fort Peck and Garrison Reservoirs improved to 88% of average and 89% of average, respectively, by the end of January. As for Plains snowpack, much of the Dakotas and southeastern Nebraska were blanketed with snow, thanks to below-normal temperatures and frequent storm systems that crossed the region during the latter part of the month.
- Both improvements and degradations in drought conditions occurred throughout the High Plains in January. According to the U.S. Drought Monitor, the area experiencing conditions ranging from abnormally dry to exceptional drought (D0-D4) increased slightly from 32% to 33%, while the area experiencing drought (D1-D4) decreased slightly from 18% to 17%. The region-wide values can be somewhat misleading, however, as there were several notable improvements and degradations in drought conditions across the region.
- Snowpack continued to build in Colorado, which prompted the reduction of exceptional drought (D4) in southwestern basins that have been suffering the most. Severe drought (D2) was also reduced in an area of northwestern Colorado stretching north into southern Wyoming. After a reassessment of conditions, moderate drought (D1) was reduced in north-central North Dakota. Areas of abnormally dry conditions (D0) along the southern fringes of Kansas were removed, thanks to a continuation of above-normal precipitation in these areas. With the entire state now drought free, the Governor of Kansas removed all counties from drought watch, drought warning, and drought emergency status.
- Areas that experienced a degradation in drought conditions included portions of Wyoming. D0 and D1 conditions were expanded due to persistent dryness and below-average snowpack in areas such as the Wind River Range.
- For more information, please visit the High Plains Regional Climate Center Home Page.
Southern Region (Information provided by the Southern Regional Climate Center)
- Temperatures for the month of January were above normal throughout much of the Southern Region. Parts of southern and eastern Texas experienced temperatures 2 to 4°F (1.11 to 2.22°C) below normal. Parts of western, southern, central, and eastern Texas; southern, southwestern, and eastern Oklahoma; western and eastern Arkansas, central, southern, northeastern, and southeastern Louisiana; and southern and southwestern Mississippi experienced temperatures 0 to 2°F (0.00 to 1.11°C) below normal. Parts of western, southern, central, eastern, and northern Texas; western and central Oklahoma, central, eastern, southern, and northwestern Arkansas, northeastern Louisiana, central, western, and northern Mississippi, and most of Tennessee experienced temperatures 2 to 4°F (1.11 to 2.22°C) above normal. Parts of northern and eastern Texas, eastern Arkansas, and central and northern Mississippi experienced temperatures 4 to 6°F (2.22 to 3.33°C) above normal. The statewide monthly average temperatures were as follows: Arkansas – 40.80°F (4.89°C), Louisiana – 49.90°F (9.94°C), Mississippi – 46.20°F (7.89°C), Oklahoma – 38.30°F (3.50°C), Tennessee – 39.40°F (4.11°C), and Texas – 47.00°F (8.33°C). The statewide temperature rankings for January were as follows: Arkansas (forty-eighth warmest), Louisiana (fifty-fifth warmest), Mississippi (forty-ninth warmest), Oklahoma (forty-fifth warmest), Tennessee (thirty-seventh warmest), and Texas (forty-fifth warmest). All state rankings are based on the period spanning 1895-2019.
- Precipitation values for the month of January varied spatially across much of the Southern Region. Parts of southwestern, western, northwestern, and northern Texas; western and southwestern Oklahoma, and southern and southeastern Louisiana received 50% or less of normal precipitation. Parts of southwestern, central, far western, northwestern, and northern Texas, far western and southwestern Oklahoma, and far southeastern Louisiana received 25% or less of normal precipitation. Parts of northern, western, and southwestern Texas received 5% or less of normal precipitation. In contrast, parts of far southern, eastern, and northeastern Texas, northern Louisiana, southern and northeastern Oklahoma, central and western Mississippi, northern and southern Arkansas, and central Tennessee received 150% or more of normal precipitation. Parts of northeastern Oklahoma and northwestern Arkansas received precipitation 200 to 400% of normal. The statewide precipitation totals for the month were as follows: Arkansas – 4.51 inches (114.55 mm), Louisiana – 5.51 inches (139.95 mm), Mississippi – 6.12 inches (155.45 mm), Oklahoma – 2.10 inches (53.34 mm), Tennessee – 5.51 inches (139.95 mm), and Texas – 1.47 inches (37.34 mm). The state precipitation rankings for January were as follows: Arkansas (forty-eighth wettest), Louisiana (fifty-second wettest), Mississippi (thirty-eighth wettest), Oklahoma (twenty-seventh wettest), Tennessee (thirty-eighth wettest), and Texas (sixty-first driest). All state rankings are based on the period spanning 1895-2019.
Drought and Severe Weather
- At the end of January, drought conditions improved across parts of the Southern Region. Moderate drought classifications were still present in parts of extreme western and northern Texas. The total area experiencing moderate drought conditions decreased slightly as drought conditions in Arkansas and Oklahoma improved, but drought conditions degraded in southern Texas. There were no drought conditions in Tennessee, Louisiana, and Mississippi. There was a decrease in the overall area experiencing abnormally dry conditions, with Arkansas, northern Texas, and most of Oklahoma improving, but new areas of abnormally dry conditions were issued in southern Texas.
- In January, there were a total of 52 storm reports across Texas, Arkansas, Louisiana, Mississippi, and Tennessee. There were 5 tornado reports, 3 hail reports, and 44 wind reports. Mississippi tallied the most tornado (4) and wind (34) reports, while three states (Arkansas, Louisiana, and Mississippi) tallied 1 hail report each. Mississippi tallied the most reports total (39) while Arkansas and Tennessee tallied the least (2). Oklahoma did not have a single storm report. Only two states (Louisiana and Mississippi) reported tornadoes. There were only 5 days in January where a storm report of any type was reported in the Southern Region, with 48 of the 52 total reports occurring on two days (14 on January 18 and 34 on January 19).
- On January 4, 2019, multiple trees and power lines were blown down near St. Clair and Morristown, Tennessee.
- On January 18, 2019, there were 14 storm reports across Arkansas, Texas, Louisiana, and Mississippi. Golf ball sized hail was reported in Foreman, Arkansas. A wind gust of 58 mph (93.34 kph) was reported at the entrance of Galveston Bay, Texas. Property damage was reported near the towns of Wharton, Santa Fe, and Orange, Texas.
- On January 19, 2019, there were 34 storm reports across Mississippi and Louisiana. Two EF-0 tornadoes and two EF-1 tornadoes were reported in Mississippi, while a tornado was also reported near Franklinton, Louisiana. Golf ball sized hail was also reported near Walker, Louisiana. Multiple trees, tree limbs, and utility lines were blown down across Mississippi.
- For more information, please visit the Southern Regional Climate Center Home Page.
Western Region (Information provided by the Western Region Climate Center)
- Active weather throughout January brought above normal precipitation to the Southwest and some Inland Northwest locations. The Pacific Northwest observed below normal precipitation. January temperatures were above normal in eastern Montana, portions of central and northern California, Nevada, and the Pacific Northwest. Slightly below normal temperatures were observed across the Rocky Mountains.
- Several areas of the Northwest observed well above normal temperatures. In northeastern Montana, Glasgow reported an average temperature of 22.2°F (-5.4°C), 8.4°F (4.7°C) above normal and the 8th warmest January since records began in 1948. In eastern Oregon, Baker City reported an average temperature of 31.6°F (-0.2°C), 6.5°F (3.6°C) above normal and the 11th warmest January since records began in 1943. California and Nevada also observed above normal temperatures. Battle Mountain, Nevada, recorded 38.1°F (3.4°C), 7.2°F (4°C) above normal and the 5th warmest in a 76-year record. In central California, Fresno reported 52.5°F (11.4°C) 5.9°F (3.3°C) above normal and the 4th warmest January since records began in 1949. Below normal temperatures were recorded in a broad swath from western Wyoming to southern Arizona. Lander, Wyoming reported an average temperature of 17.7°F (-7.9°C), 4°F (2.2°C) below normal. In southeastern Utah, Bluff observed an average temperature of 28.6°F (-1.9°C). 3.7°F (2.1°C) below normal.
- Precipitation was above normal in scattered areas of the West. In central Montana, Great Falls recorded 0.98 in (25 mm), 192% of normal. California and Nevada also observed above normal precipitation. Reno, Nevada, recorded 2.92 in (74 mm), 283% of normal and the 7th wettest January since records began in 1937. Further south, Los Angeles, California, recorded 5.95 in (151 mm), 190% of normal and Las Vegas, Nevada, reported 1.04 in (26 mm), 193% of normal. Elsewhere in the Intermountain West, Vernal, in northeastern Utah, reported 1.36 in (35 mm), 272% of normal. The Pacific Northwest was generally drier than normal. Portland, Oregon, recorded 2.79 in (71 mm), 57% of normal. Southern New Mexico also observed below normal precipitation. Las Cruces recorded 0.18 in (5 mm), 35% of normal.
- At the end of the month, snowpack was near normal in most large river basins (HUC-2) of the West, with the Upper Colorado at 102% of median, the Lower Colorado at 103% of median, the Great Basin at 91% of median, and California and the Sierra Nevada at 96% of median. The Rio Grande region was slightly below median at 88% and the Pacific Northwest had the greatest departure from median snowpack at 77%.
- Above normal precipitation and snowfall this month favored large areas of improvement in drought conditions. Only 17% of the West is experiencing severe or worse drought conditions, compared with 27% at the end of December. Nearly all of California saw improvement in drought conditions, with 2-category improvement in the South Coast area, which had experienced extreme to severe drought conditions for the past year. Large areas of improvement were also observed in Nevada, Arizona, Utah, Wyoming and Colorado. Only central Idaho, a small area of northwestern Montana, and small areas of Wyoming saw worsening or expansion of drought conditions.
- Precipitation totals were generally near to below normal across Alaska this month. Snowpack was also below normal across the state, except for the southern sides of the Brooks and Alaska ranges. Several sled dog races in Southcentral Alaska have been cancelled due to below normal snowpack. Temperatures were near normal at inland locations, and generally above normal moving towards coastal areas. In southwestern Alaska, Bethel recorded an average temperature of 13.8°F (-10.1°C), 7.2°F (4°C) above normal. No changes in drought conditions were observed in the state and the southeastern region remained abnormally dry to severe drought. However, above normal precipitation in this area helped alleviate hydropower concerns. Further south, precipitation was well below normal across the state of Hawaii. Honolulu observed 0.33 in (8 mm) and Hilo recorded 1.26 in (32 mm), 14% of normal for both locations. This was the 9th driest January at Hilo since records began in 1949. Drought conditions expanded and/or intensified across the state. At the end of the month, 39% of the state was experiencing moderate or worse drought conditions.
Significant Events
- January 6-7: Strong storm impacts southern California: High intensity rainfall caused mud and debris flows and flooding in the vicinity of the Woolsey burn scar near Malibu. This resulted in closure of Highway 1 in the area as well as various roadways in the Santa Monica Mountains. In central California, high winds resulted in downed trees and power outages in the Central Valley. As the storm moved east, winter storm conditions resulted in 56 vehicle accidents in Utah. There were also many accidents in the Sierra Nevada area; Interstate 80 closed for nearly an 18h period over Donner Summit. Numerous car accidents were reported in eastern Idaho and Montana as well associated with this storm event.
- January 21-22: Santa Ana winds in California; winter storm impacts in Intermountain West: Strong Santa Ana winds (typical for this time of year) in southern California caused downed trees and power outages. Two people were killed when tree fell on house in San Diego. Further inland, winter storm conditions associated with this event resulted in 200 crashes across Utah and road closures due to poor driving conditions and avalanches as well as power outages and flight cancellations. Road closures were observed in northern New Mexico, Wyoming, and Montana; Montana observed school closures associated with this event as well.
- For more information, please go to the Western Regional Climate Center Home Page.