National Overview

May Highlights

May Temperature
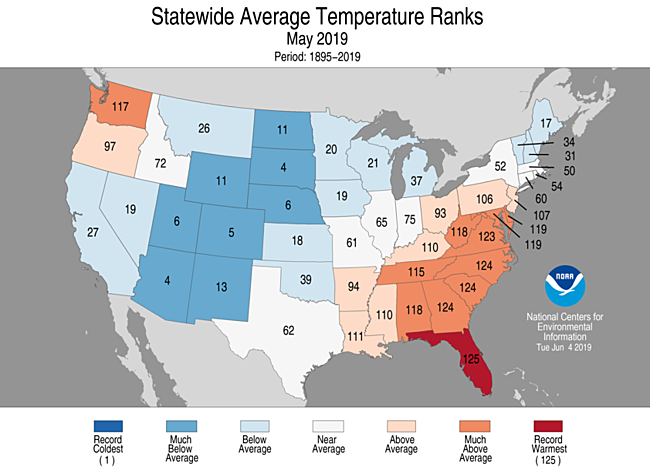
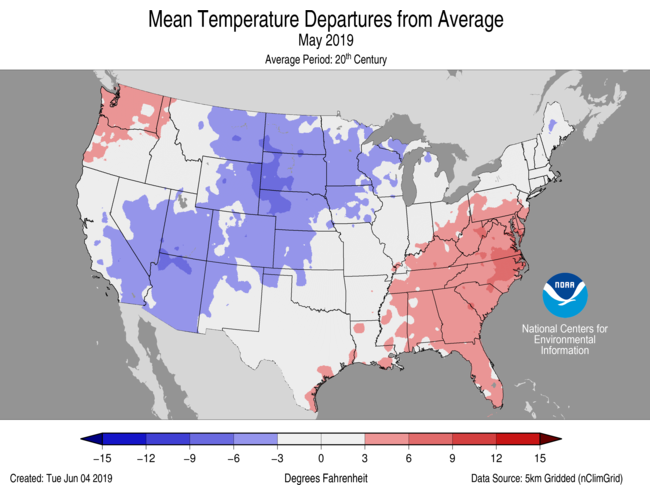
- For May, the average contiguous U.S. temperature was 59.5°F, 0.7°F below the 20th century average and ranked in the bottom third of the 125-year record.
- Below- to much-below-average temperatures spanned from California, into the Great Lakes and across New England. Five states from the Southwest to the northern Plains, had a top 10 coldest May on record.
- Above- to much-above-average May temperatures prevailed from the lower Mississippi River Valley into the mid-Atlantic states as well as across the Pacific Northwest. Florida ranked warmest on record for May with North Carolina, South Carolina and Georgia ranking second warmest.
- The Alaska average May temperature was 42.9°F, 5.1°F above the long-term mean and the sixth warmest May on record for the state. The Cook Inlet division reported above-average temperatures during May while the remaining divisions ranked much above average for the month.
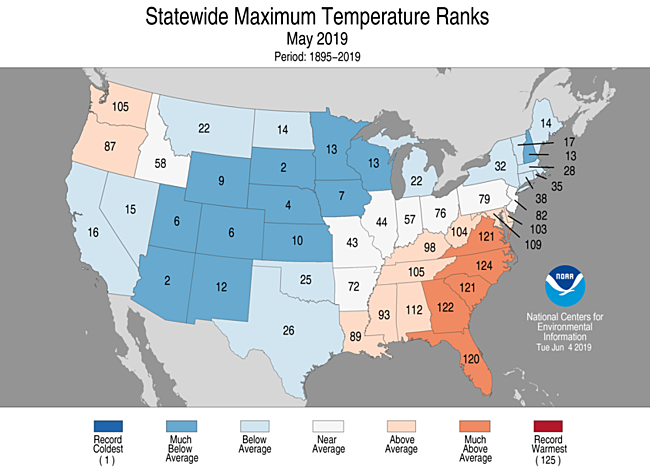
- The nationally averaged maximum temperature (daytime highs) was cool during May at 70.9°F, 2.1°F below average and the 10th coolest in the 125-year record. Seven states from the Southwest to the Great Lakes experiencing one of their 10 coolest May periods on record. North Carolina ranked second warmest maximum temperature during May.
- The nationally averaged minimum temperature (overnight lows) during May was 48.1°F, 0.6°F above average. May minimum temperature ranks for Colorado and Arizona were among the 10 coolest on record for the month. Minimum temperatures were decidedly warmer than maximum temperatures during May with eight states across the Southeast and Mid-Atlantic having one of their five warmest May periods on record.
- During May there were 4,166 cold daily high (3,334) and low (832) temperature records tied or broken. The occurrence of cold records was approximately 40 percent greater than the 2,935 daily warm high (1,079) and low (1,856) temperature records set during the month.
- Based on NOAA's Residential Energy Demand Temperature Index (REDTI), the contiguous U.S. temperature-related energy demand during May was 62 percent above average and ranked 18th highest in the 125-year period of record.
May Precipitation
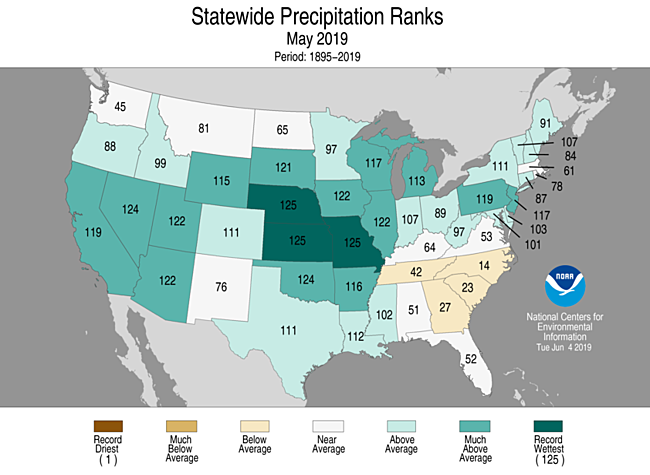
- The May precipitation total for the contiguous U.S. was 4.41 inches, 1.50 inches above average, and ranked second wettest in the 125-year period of record for May as well as second wettest for all months since January 1895. The current record of 4.44 inches occurred in May 2015.
- Near-record to record precipitation was observed from the West Coast through the central Plains and into the Great Lakes and parts of the Northeast, contributing to the second wettest May – and second wettest of any month – on record for the contiguous U.S. Flooding has been an ongoing concern in the central U.S. for several months and was exacerbated in May by frequent and excessive rainfall. Kansas, Nebraska, and Missouri ranked wettest May on record while an additional seven states ranked in their top five.
- Below-average precipitation was observed across the Southeast during May. North Carolina ranked 14th driest on record for the month.
- Severe flooding along the Arkansas, Missouri, and Mississippi rivers occurred during May, and for some locations, including Vicksburg, MS, flooding has been ongoing since mid-February.
- With records dating back to 1884, Duluth, MN, reported 10.6 inches of snow on the 9th, shattering the city's May snowstorm record. The previous record was 5.7 inches, which fell May 2–5, 1954.
- A southward dip in the jet stream over the western contiguous U.S. during May contributed to above-average late-season snowfall. Denver reported its snowiest May in 44 years with 3.9 inches total for the month.
- According to the June 4 U.S. Drought Monitor report, five percent of the contiguous U.S. was in drought, up from two percent at the beginning of May.
Other Notable Events in May
- According to the U.S. Army Corps of Engineers, the Great Lakes are near or at record water levels due to spring snowmelt and excessive rainfall throughout the spring months.
- Approximately 555 tornadoes were reported during May – more than double the 1991-2010 average of 276 tornadoes for the month of May. It was the most active 30-day tornado period since 2011.
- Subtropical Cyclone Andrea formed on May 20, which is a record fifth consecutive season for a named storm to form in the North Atlantic Basin before the official start of the hurricane season on June 1.
- According to the U.S. Department of Agriculture and resulting from the excessive spring rainfall, the percentage of corn and soybeans planted by June 2 is the smallest since 1992. Corn and soybean emergence is also the lowest observed since 1998.
Spring Highlights
March-May Temperature
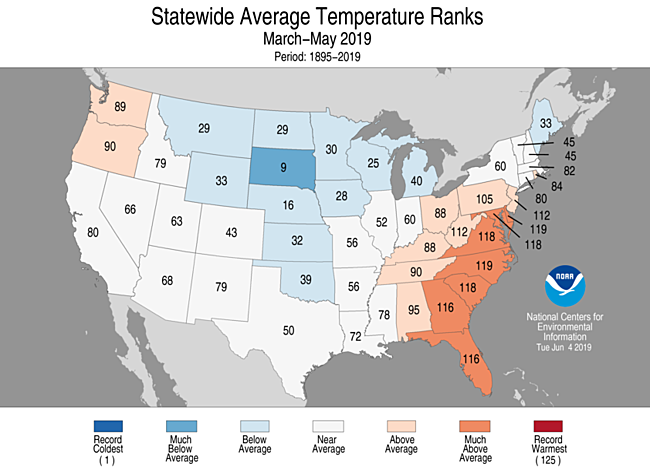
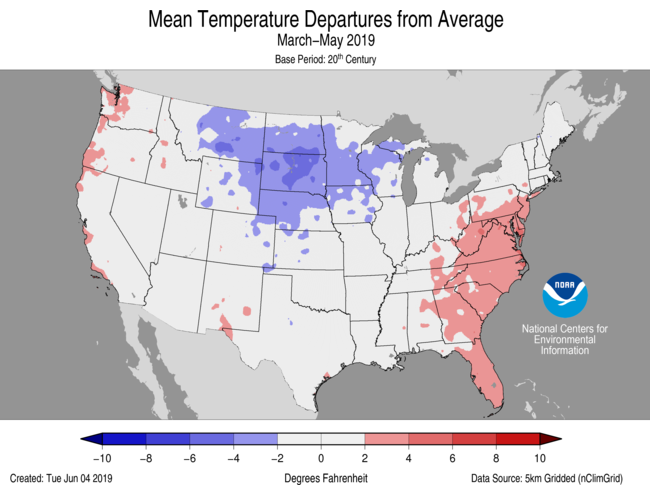
- Despite the cool May, meteorological spring (March-May), had near-average temperatures. The seasonally averaged temperature for the Lower 48 was 50.9°F, 0.1°F below average and ranked in the middle third of the record.
- Above- to much-above-average temperatures were observed across the Southeast, Ohio Valley and the mid-Atlantic region as well as across the Northwest. Seven states across the Southeast had one of their 10 warmest March–May periods on record.
- Below-average temperatures were observed from the northern Rockies to the central Plains and into the Great Lakes and part of New England. South Dakota had its ninth coldest spring on record.
- The Alaska spring temperature was 32.6°F, 8.6°F above the long-term average, ranking warmest on record for the state. The previous record was 32.0°F set in 2016. The West Coast, North Slope and Interior divisions were all record warmest with much-above-average temperatures occurring across the remaining divisions. Many locations reported their warmest spring on record including: Fairbanks, Northway, McGrath, Utqiaġvik (Barrow) and Kotzebue. Kotzebue exceeded its previous spring temperature record by more than 6°F.
- The contiguous U.S. average maximum (daytime) temperature during March-May was 62.4°F, 0.8°F below the 20th century average, ranking in the coolest third of the record. Above-average maximum temperatures were observed along the Pacific coast and throughout much of the Southeast and mid-Atlantic region. Much-below- to below-average maximum temperatures were observed from the Rocky Moutains to Texas and up into the Great Lakes and into New England.
- The contiguous U.S. March-May minimum (nighttime) temperature was 39.4°F, 0.7°F above average, and ranked in the warmest third of the record. Above-average minimum temperatures were observed across a large swath of the West, the Deep South, and across much of the East Coast. Below-average minimum temperatures were observed across the central and northern Plains, Great Lakes, and part of New England.
- Based on NOAA's Residential Energy Demand Temperature Index (REDTI), the contiguous U.S. temperature-related energy demand during March-May was 4 percent below average and ranked near the middle value in the 125-year period of record.
March-May Precipitation

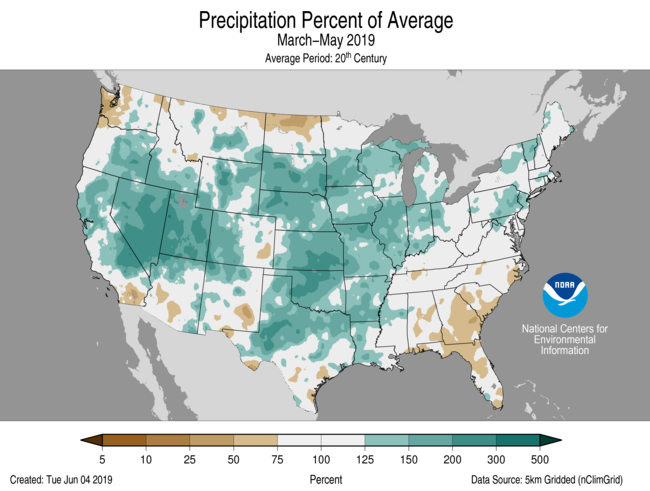
- The spring precipitation total was 9.85 inches, 1.91 inches above average and the sixth wettest spring on record.
- Above- to much-above-average spring precipitation was observed across most of the contiguous U.S. from California to New England. Kansas had its wettest March–May on record while six additional states had a top five wettest spring.
- Below-average precipitation during March–May was observed across the Southeast, North Dakota and Washington state, which ranked 13th driest for the spring season.
March-May Extremes
-
The U.S. Climate Extremes Index (USCEI) for spring was 28 percent above average and ranked in the top third of the 110-year period of record. On a national scale, elevated extremes in wet PDSI, one-day precipitation, and the number of days with precipitation contributed to this above-average value. In fact, precipitation received throughout the spring season across a wide swath of the CONUS contributed to a record high extent of extremes in 1-day precipitation and third highest on record for wet PDSI. The USCEI is an index that tracks extremes (falling in the upper or lower 10 percent of the record) in temperature, precipitation and drought across the contiguous United States.
- On the regional scale, the CEI was the ninth highest on record for the Ohio Valley due to extremes in wet PDSI, one-day precipitation totals, and the number of days with precipitation.
Year-to-Date Highlights

January-May Temperature
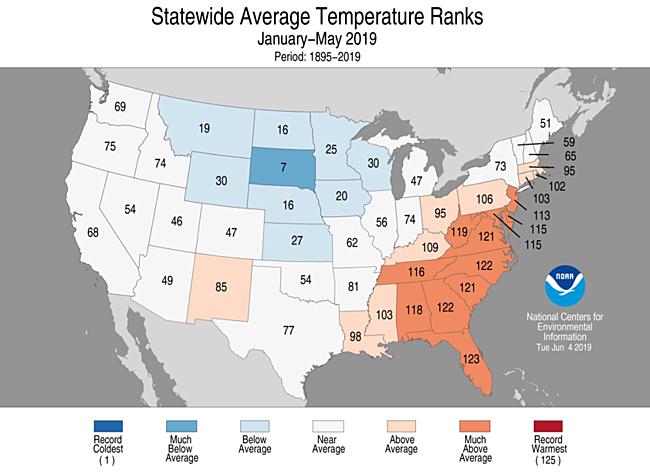
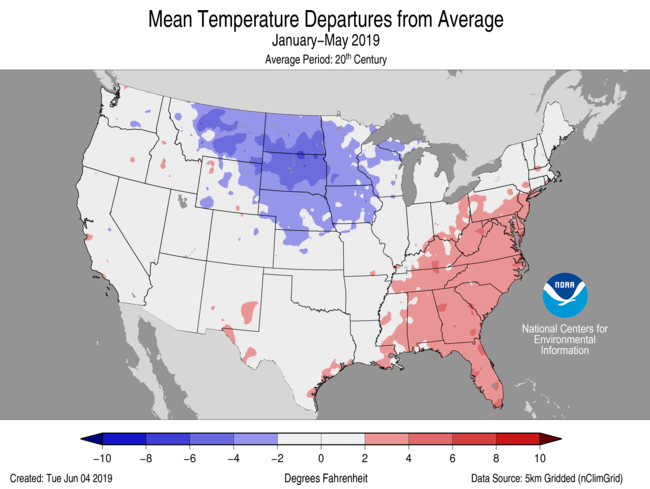
- The first five months of 2019 were marked by large regional variability in temperature, but when averaged, the contiguous U.S. average temperature was 43.4°F, 0.1°F above the 20th century average and ranked in the middle third of the January–May record.
- Cooler-than-average temperatures for the year-to-date period occurred across the northern Plains. South Dakota ranked seventh coolest for the January–May period. When averaged for the first five months of the year, much of the Southeast and Ohio Valley were warmer than average. Eleven states had a year-to-date temperature that was much above average.
- The Alaska year-to-date temperature was 24.1°F, 8.3°F above average, ranking as the second warmest on record. Record warm temperatures were observed across the North Slope and the Aleutians, while above- to much-above-average temperatures were present across the rest of the state. The record low sea ice for parts of the year in the Bering and Chukchi seas likely contributed to the Alaskan warmth.
- The contiguous U.S. average maximum (daytime) temperature during January-May was 54.2°F, 0.7°F below the 20th century average, ranking in the coolest third of the record. Above-average maximum temperatures were observed across parts of the Pacific Northwest and across most of the Southeast. Below-average maximum temperatures were observed across part of the West as well as throughout the northern and central Plains as well as New England.
- The contiguous U.S. January-May minimum (nighttime) temperature was 32.6°F, 0.8°F above average, and ranked in the warmest third of the record. Above-average minimum temperatures were primarily observed across the Southeast and mid-Atlantic region with pockets of record warmest minimum temperatures observed in Florida. Below-average temperatures were observed from the Plains to the Great Lakes.
- Based on REDTI, the contiguous U.S. temperature-related energy demand during January-May was 14 percent below average and ranked in the lowest third of the 125-year period of record.
January-May Precipitation
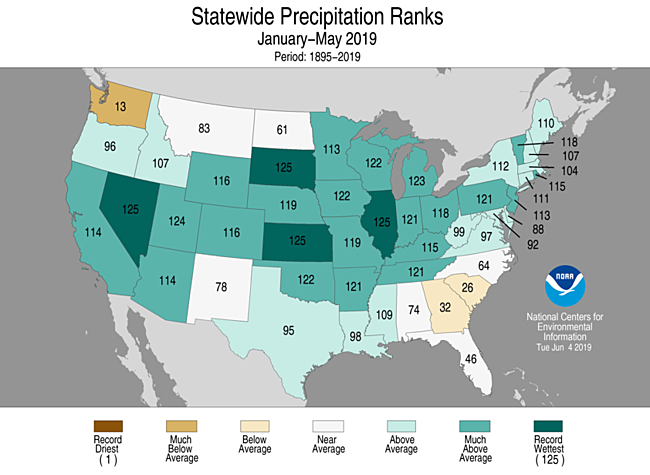
- The year-to-date precipitation total was 15.71 inches, 3.32 inches above average and ranked as the wettest year-to-date period for the contiguous U.S. in the 125-year record.
- Much-above-average precipitation prevailed across a large portion of the contiguous U.S. during the first five months of 2019. Nevada, South Dakota, Kansas, and Illinois ranked wettest for the year-to-date period. Nine additional states had a top five wettest start to 2019. Only Georgia, South Carolina, and Washington state had January–May precipitation that was below average.
January-May Extremes
-
The USCEI for the year-to-date was 47 percent above average and ranked 11th highest in the 110-year period of record. Similar to the spring season, elevated extremes in the nationally-averaged value were the result of a large footprint of wet PDSI, one-day precipitation, and the number of days with precipitation.
- On the regional scale, the CEI was fifth highest for the Ohio Valley and seventh highest across the Southeast. In the Ohio Valley, extremes in warm minimum temperatures, wet PDSI, one-day precipitation, and the number of days with precpitation contributed to the above-average index value. For the Southeast, above-average extremes were observed in warm maximum and minimum temperatures as well as wet PDSI.
Regional Highlights
These regional summaries were provided by the six Regional Climate Centers and reflect conditions in their respective regions. These six regions differ spatially from the nine climatic regions of the National Centers for Environmental Information.
Northeast Region (Information provided by the Northeast Regional Climate Center)
- The Northeast wrapped up May with an average temperature of 57.0 degrees F (13.9 degrees C), 0.7 degrees F (0.4 degrees C) above normal. However, state average temperatures for May were wide-ranging, with the dividing line between below-normal and above-normal generally running along New York's southern border. Maine was the coldest state at 3.2 degrees F (1.8 degrees C) below normal, ranking as its 18th coldest May, while West Virginia was the warmest state at 5.3 degrees F (2.9 degrees C) above normal, ranking as its eighth warmest May. In addition, Delaware and Maryland had their seventh warmest May, while New Jersey had its 19th warmest and Pennsylvania had its 20th warmest. For spring, the Northeast averaged out to have a near-normal average temperature of 45.6 degrees F (7.6 degrees C). The season followed a similar temperature pattern to May, with New York and New England being colder than normal and the rest of the region being warmer than normal. State average temperatures ranged from 2.2 degrees F (1.2 degrees C) below normal in Maine to 2.5 degrees F (1.4 degrees C) above normal in Maryland. This spring ranked among the 20 warmest on record for four states: seventh warmest in Delaware, eighth warmest in Maryland, and 14th warmest in New Jersey and West Virginia.
- The Northeast had its 13th wettest May since 1895 with 5.30 inches (134.62 mm) of precipitation, 132 percent of normal. All states except Massachusetts received above-normal precipitation, ranging from 90 percent of normal in that state to 168 percent of normal in New Jersey. This May ranked among the 20 wettest on record for four states: Pennsylvania, seventh wettest; New Jersey, ninth wettest; New York, 15th wettest; and Vermont, 19th wettest. Similar to April, it was persistently wet during May. Hartford, Connecticut, and Islip and Kennedy Airport, New York, set/tied their greatest number of consecutive days with measurable precipitation. For instance, Islip's streak was 18 days long, from April 20 to May 7. In addition, seven major climate sites had their greatest number of May days with measurable precipitation. In fact, for Harrisburg, Pennsylvania, and Kennedy Airport it was the greatest number for any month on record with 21 days. Spring also averaged out to be wetter than normal for the Northeast with 12.49 inches (317.25 mm) of precipitation, 112 percent of normal. Eleven of the region's twelve states landed on the wet side of normal for the season, with precipitation ranging from 101 percent of normal in New Hampshire to 125 percent of normal in Pennsylvania, the state's 13th wettest. In addition, Vermont had its 14th wettest spring and New Jersey had its 17th wettest. West Virginia was the lone drier-than-normal state at 96 percent of normal precipitation. The number of wet days piled up in April and May so that Providence, Rhode Island; Boston, Massachusetts; and Islip, New York, had their greatest number of spring days with measurable precipitation.
- In terms of severe weather, May was another very active month. Preliminary data indicated that 16 tornadoes touched down in Pennsylvania, more than five times the 1989-2013 average of three tornadoes. The state's spring tornado count was 30, which was six times greater than the spring average and double the state's annual average. During May, there were three tornadoes in Maryland and one in New Jersey, which was above average for both states. In addition to the tornadoes, severe storms produced damaging straight-line winds of up to 100 mph (45 m/s), large hail including softball-sized hail in Pennsylvania, and flash flooding. With heavy precipitation and high flows, Lake Erie and Lake Ontario reached record high water levels in late May. Shoreline flooding along Lake Ontario forced the closure of a few businesses and roads, and water also entered some lakeshore properties.
- For more information, please visit the Northeast Regional Climate Center Home Page.
Midwest Region (Information provided by the Midwest Regional Climate Center)
- May precipitation for the Midwest was above normal for the tenth straight month. May precipitation in the region ranked as the 3rd wettest in history (back to 1895). Missouri set a statewide record while Iowa and Illinois ranked among their top-5 wettest in history. Spring precipitation, March to May, ranked as the 7th wettest in history for the region and ranked among the wettest 10 percent of their statewide histories in Illinois, Indiana, Iowa, Michigan, Missouri, and Wisconsin. Combining the winter and spring precipitation, the Midwest had the wettest such 6-month period in its history with all nine states ranking among the top-10 wettest with Illinois also setting a record. The year ending in May (June 2018 to May 2019) also ranked as the wettest in history for June to May periods with statewide records also set in Indiana, Iowa, Kentucky, Ohio, and Wisconsin while Illinois and Minnesota ranked 2nd, Michigan ranked 3rd, and Missouri ranked 8th.
- May temperatures ranged from a few degrees F below normal in the northwest to a few degrees F above normal in the southwest. Temperature departures ranged from 5 degrees F (3 C) below normal in parts of Minnesota to 4 degrees F (2 C) above normal in southeastern areas of Kentucky and Ohio. Spring temperatures had a similar pattern with the coolest departures in Minnesota of up to 4 degrees F (2 C) below normal and the warmest departures of up to 2 degrees F (1 C) in southeastern Kentucky.
- Spring planting was delayed this spring primarily due to very wet conditions. Both corn and soybean crops in the US were at their lowest planting numbers (as of June 2nd) for the 1992 to 2019 period where statistics are available. The corn crop was 67 percent planted, behind the previous record of 77 percent in 1995. Illinois, Indiana, and Ohio were more than 50 percent below the 5-year average and Missouri, Wisconsin, and Michigan were more than 25 percent below average. The soybean crop was 39 percent planted, also trailing the 1995 record of 40 percent. Illinois, Indiana, and Ohio were also more than 50 percent below the 5-year average for soybean planting with Missouri, Iowa, Minnesota, Wisconsin, and Michigan all more than 25 percent below average.
- Winter hung on well into the spring in 2019 with freezing temperatures and snow reported well into May in the upper Midwest. Across the northern parts of Minnesota, Wisconsin, and Michigan freezing temperatures were reported through the first three weeks of May and then again in northeastern Minnesota on the 28th. Snow fell in the same areas on the 1st-2nd, 9th, and the 20th-21st with Duluth setting a record for a storm total snowfall in May with 10.9 inches of snow on the 9th.
- Flooding was both extensive and persistent throughout May in the Midwest. Major flooding along the Mississippi River, and the Illinois River and other tributaries, were long lasting and severe. The Quad Cities which span the Mississippi River along the Iowa-Illinois border experienced major flooding for more than 30 straight days. A record peak at Rock Island, Illinois and further complications due to failed levees which allowed the downtown area to be inundated affected the metro area. May rains swelled rivers after some easing of the flooding earlier in May. The Mississippi River was in major flood stage from the Quad Cities to St. Louis as May came to an end.
- Severe weather in the Midwest ramped up in May, especially in the latter half of the month, with well over a thousand reports of severe weather across all nine states in the region. Reports were received on 26 days, with a stretch of days from the 14th to the 29th all having at least a dozen reports, peaking on the 22nd when more than 300 reports were received. Tornadoes were reported on 13 days in May across seven states, sparing only Kentucky and Wisconsin. Particularly hard hit were Missouri on the 21st and 22nd, Iowa, Illinois, Indiana, and Ohio on the 27th, and Iowa on the 29th.
- Drought has been absent from the Midwest throughout 2019, a record 22 straight weeks (US Drought Monitor history started in 2000). The most recent Midwest drought in the US Drought Monitor was depicted in southwestern Missouri on December 25, 2018. Abnormally dry conditions emerged in the US Drought Monitor in mid-May ending a streak of 12 straight weeks with no abnormally dry areas in the entire region. Prior to this streak of weeks there were only two other weeks, one week in May 2002 and another in May 2017, where the 9-state Midwest had neither drought nor abnormally dry anywhere in the region.
- For further details on the weather and climate events in the Midwest, see the weekly and monthly reports at the Midwest Climate Watch page.
Southeast Region (Information provided by the Southeast Regional Climate Center)
- Temperatures were well above normal across the Southeast this May and near normal in Puerto Rico. Monthly mean temperatures were at least 5 degrees F (2.5 degrees C) above average for approximately 46 percent of the 280 long-term (i.e., period of record equaling or exceeding 50 years) stations across the region. A total of 36 long-term stations observed or tied monthly mean temperatures that were ranked their warmest on record. Two stations had monthly mean temperatures above 9 degrees F (4.5 degrees C), including Pelion, SC (1947-2019; 1st warmest) at 9.3 degrees F (4.7 degrees C) and Danbury, NC (1946-2019; 1st warmest) at 9.0 degrees F (4.5 degrees C). Maximum daytime temperatures ranged from 0 to 10 degrees F (0 to 5 degrees C) above normal for the region, and average nighttime minimum temperatures ranged from 0 to 11 degrees F (0 to 5.5 degrees C) above normal. During the first half of the month, the Bermuda high pressure system was ideally positioned off the southeastern coast to usher in warm, moist air from the Gulf of Mexico, which suppressed nighttime cooling during the month. Marion, NC (1893-2019) and Danbury, NC (1946-2019) each had an average minimum temperature of 11 degrees F (4.4 degrees C) above normal. During the second half of the month, the Bermuda high pressure system moved northwest to a position immediately off of the coast of South Carolina, leading to the development of a heat wave. On May 26th- 30th, many stations reported breaking or tying their highest all-time maximum monthly May temperature including Savannah, GA (1871-2019) and Gainesville, FL (1890-2019) at 102 degrees F (39 degrees C); Charleston, SC (1938-2019) and Wilmington, NC (1871-2019) at 101 degrees F (38 degrees C); and Tuscaloosa, AL (1948-2019) at 98 degrees F (37 degrees C). Charleston, SC (1938-2019), Macon, GA (1892-2019) and Wilmington, NC (1871-2019) (1947-2019) had their first 100 degrees F (38 degrees C) day in May. Pelion, SC (1947-2019) had six consecutive days of 100 degrees F (38 degrees C); Florence, SC (1948-2019), Columbia, SC (1887-2019), and Augusta, GA (1871-2019) each had five consecutive days of 100 degrees F (38 degrees C).
- Precipitation was 25 to 70 percent of normal for most locations this May, except for parts of the Florida peninsula, which was up to 200 percent of normal. The driest locations included the coastal Carolinas, central Alabama, central Georgia, the Florida peninsula, and eastern Puerto Rico. Some parts of the coastal Carolinas were more than 2 inches (51 mm) below normal, including Wilmington, NC (1871-2019; 2nd driest) at 3.9 inches (99 mm) below normal; New Bern, NC (1948-2019; 6th driest) at 2.51 inches (64 mm) below normal; and Summerville, SC (1898-2019; T-8th driest) at 2.4 inches (61 mm) below normal. Around 30 percent of the 245 long-term (i.e., period of record equaling or exceeding 50 years) stations across the region reported six or less days with measurable precipitation this month. Wilmington, NC (1871-2019) reported only three days with measurable precipitation this month, and Gainesville, FL (1890-2019) did not see any measurable precipitation from May 6th through May 27th. Precipitation in Puerto Rico showed much variability, with St. Croix, PR (1951-2019) being 2.13 inches (54 mm) above normal and San Juan, PR (1898-2019) being 3.93 inches (100 mm) below normal. St. Croix, PR received 3.70 inches (94 mm) of precipitation on May 1st, making it the 3rd wettest May day on record. Because of the close proximity of the Bermuda high pressure system, most of the region remained dry during the month of May.
- There were 566 severe weather reports across the Southeast during May, which is over 128 percent of the monthly frequency of 440 reports during 2000-2018. There were 9 confirmed tornadoes, which was a little less than the average of 11 for the month. Seven of the nine reported tornadoes occurred during May 9th -13th when a series of cold fronts passed through the region. The strongest of these tornadoes was ranked EF-2, with winds reaching 115 mph in Wake County in east-central North Carolina. This tornado produced a 17 mile swath of damage, including several downed trees and sheet metal wrapped around a tree. No fatalities or injuries were reported with this tornado. There were 113 hail reports, less than the average of 142 reports for the month of May, including several reports of golf ball-sized hail in North Carolina on the last day of the month. The hail damaged many vehicles and homes. There were 442 wind reports including a thunderstorm wind gust of 67 mph (30 m/s) at Washington Reagan, VA (1929-2019) for May, which is 154 percent of the average 247 reports for the month.
- Drought conditions expanded across the region for the month of May. Moderate drought (D1) covered about 12 percent of the Southeast (up from 9 percent at the beginning of the month), in an area stretching from the coastal Carolinas, down through the eastern part of Georgia and small parts of central Georgia and Alabama. Abnormally dry (D0) conditions covered about 50 percent of the region from the coastal area of North Carolina, southward through most of South Carolina, and Georgia, central Alabama, and the Florida Panhandle. Drought conditions changed very little in Puerto Rico, with around 15 percent in moderate drought (D1) (down from 16 percent at the beginning of the month), and 44 percent in abnormally dry (D0) conditions (which stayed the same). With the growing drought wildfire concerns increased. The Yellow Bluff Fire began on May 22nd near Jacksonville, FL and grew to 600 acres, shutting down parts of Interstate 95 in both directions. Another fire broke out near Aiken, SC on May 28th and shut down parts of Interstate 20. The rain in the first half of the month allowed most crop planting to be about ten percent ahead of normal, however the dry conditions at the end of the month slowed down planting progress, especially cotton and peanut planting. The lack of precipitation and higher temperatures at the end of the month increased water usage of plants, and dryland crops saw some impacts with some early corn crops already being affected. Soil moisture values continued to decline, and some growers reported not being able to plant because of insufficient moisture levels. Soybean planting has stopped until more rain improves soil moisture. The peach picking began in Georgia, and, according to growers, the conditions during the spring produced a great peach crop this year. Some farms are picking 15,000 to 20,000 boxes of peaches per day, and it should continue into mid-August.
- For more information, please visit the Southeast Regional Climate Center Home Page.
High Plains Region (Information provided by the High Plains Regional Climate Center)
- May 2019 was one for the record books, with extremely wet conditions causing more flooding issues and negatively impacting the growing season. Both Kansas and Nebraska had their wettest May on record, according to the National Centers for Environmental Information (NCEI). These wet conditions have been ongoing for the past 12 months as South Dakota, Nebraska, and Kansas each had their record wettest June to May period.
- Active weather in May brought heavy precipitation to these areas, further exacerbating flooding and compounding impacts. Dozens of river gauges experienced record crests from unprecedented snowmelt and spring precipitation, and many roads continued to be closed. The flooding has also done extensive damage to farmland, as fields were either still under water or contained large amounts of silt, sand, and/or debris deposits. However, the wetness has kept drought from being an issue in the region, and conditions have vastly improved in drought-stricken areas. In fact, for the first time since the inception of the U.S. Drought Monitor in 2000, no areas in the state of Colorado were experiencing drought or abnormal dryness by the end of May.
- In addition to flooding, the cool and wet conditions this spring delayed planting and crop progress. As of the end of May, it was the slowest corn planting season on record for the U.S., with only 58 percent of the crop planted as of May 26th. Meanwhile, it was the 2nd slowest soybean planting season, with only 29 percent of the crop planted (records for both corn and soybeans go back to 1995). Not surprisingly, crop emergence was also far behind the five-year average for corn and soybeans. Unfortunately, the situation was similar for other row crops as well. Prevent plant was on the minds of many producers in the eastern High Plains, as crop insurance final planting dates for corn have already passed and are fast approaching for soybeans.
- The temperature pattern flipped back to the cool side in May, with temperature departures ranging from approximately 2.0-8.0 degrees F (1.1-4.4 degrees C) below normal throughout the region. The greatest departures occurred in eastern Wyoming, western South Dakota, and the Nebraska Panhandle, where numerous locations ranked in the top 10 coolest Mays on record. In fact, Casper, Wyoming, Chadron, Nebraska, and Rapid City, South Dakota had their coolest Mays on record.
- Given the below-normal temperatures throughout the High Plains in March, the spring season was quite cool for the region as well. Widespread departures of 2.0-4.0 degrees F (1.1-2.2 degrees C) below normal were evident from March-May, with departures exceeding 6.0 degrees F (3.3 degrees C) below normal in some areas. The following locations ranked among the top 10 for coolest spring: Sisseton, SD (coolest); McCook, NE (3rd coolest); Pierre, SD and Chadron, NE (4th coolest); Casper, WY (7th coolest); Aberdeen, SD, Mobridge, SD, and Scottsbluff, NE (8th coolest); and Hastings, NE (10th coolest).
- The late arrival of spring in the High Plains delayed planting and crop progress across the region. For instance, as of early June, only 13 percent of corn planted in South Dakota had emerged, which was 67 percent behind the five-year average, according to the USDA Weekly Weather and Crop Bulletin. With below-normal temperatures forecast for the region during the summer months (see page 4), producers are concerned that crops will progress and mature too slowly, which could potentially put them at a higher risk for freeze damage in the fall.
- May was quite wet across the High Plains, with nearly the entire region experiencing above-normal precipitation for the month. Several areas, including much of Kansas, northern and central Wyoming, and an area extending from central South Dakota southward through northern Nebraska, received more than double their normal May precipitation. Several locations ranked among the top 10 of wettest Mays, including Wichita, Kansas, Pierre, South Dakota, and Rapid City, South Dakota, which all had their 2nd wettest on record. The only sizeable area of the region that experienced below-normal precipitation was northern North Dakota, where precipitation was less than 50 percent of normal.
- There was no shortage of impactful weather throughout the High Plains in May, as flooding, severe weather, and even snowstorms impacted the region. Winter lingered in portions of Colorado and Wyoming, as a strong, late-season storm produced snowfall and impacted travel the 19th-21st. Cheyenne, Wyoming received 9.9 inches (25 cm) of snow from this system, bringing the monthly total to 12.4 inches (31 cm), which was 10.1 inches (26 cm) above normal. In Colorado, Alamosa and Colorado Springs were hit with a couple of snowstorms during the month, and both locations had their 7th snowiest May on record.
- The severe weather season ramped up in May, and numerous reports of tornadoes, large hail, and damaging winds occurred throughout the month, particularly in Kansas and Nebraska. For instance, a tornado touched down in the southwestern part of Lincoln, Nebraska on the 5th. Rated an EF-2 on the Enhanced Fujita scale, the tornado damaged several homes and businesses. A stronger, more impactful tornado touched down in Linwood, Kansas on the 28th, causing 18 injuries but luckily no fatalities. This tornado was rated an EF-4, as it completely leveled homes and other sound structures.
- The spring season ended up quite wet for most of the High Plains, but especially throughout South Dakota and Kansas. The following locations ranked among the top 10 for wettest spring: Pierre, SD and Sioux Falls, SD (wettest); Rapid City, SD and Wichita, KS (3rd wettest); Grand Junction, CO (4th wettest); Lander, WY and Valentine, NE (6th wettest); Cheyenne, WY and Huron, SD (7th wettest); Alamosa, CO and Casper, WY (8th wettest); and Chadron, NE and Topeka, KS (9th wettest).
- Despite below-normal temperatures and a slight bump in mountain snowpack in May, the meltout process was well underway. By early June, Snow Water Equivalent (SWE) above Fort Peck Reservoir was at 98 percent of average, with 29 percent of this year's peak remaining. Meanwhile, SWE between Fort Peck and Garrison Reservoirs was at 105 percent of average, with 51 percent of this year's peak remaining. Due to snow falling so late in the snowpack season, mountain snowpack was well above normal in both Colorado and Wyoming by early June. On average, streamflows were near to slightly below normal in these areas in May. However, the continuation of above-normal precipitation during the spring in eastern portions of the region caused streamflows to run high, especially throughout South Dakota, Nebraska, and Kansas where flooding was ongoing.
- Improvements in drought conditions continued for most of the High Plains during May, given the heavy precipitation that fell over much of the region. According to the U.S. Drought Monitor, just over four percent of the High Plains region was experiencing abnormally dry or drought conditions (D0-D4) by the end of the month, compared to approximately nine percent at the end of April. In fact, drought conditions (D1-D4) were completely eliminated across the region in May, leaving the High Plains states drought free on the U.S. Drought Monitor for the first time since June 16, 2009.
- The last bit of moderate drought (D1) that remained in the Bighorn Mountains of north-central Wyoming was removed, and abnormally dry conditions (D0) were reduced in the western part of the state as well. D0 was completely eliminated from Colorado and Kansas. Areas experiencing drought or abnormal dryness in these three states received 150-400 percent of normal precipitation in May. While there are likely to be lingering impacts, from a meteorological standpoint, the drought in Colorado ended, which had been present since late 2017.
- The only degradations in drought conditions during May occurred in North Dakota. While the rest of the High Plains experienced wet conditions, northern portions of North Dakota were dry, receiving less than 50 percent of normal precipitation. As a result, D0 expanded across the northern part of the state.
- For more information, please visit the High Plains Regional Climate Center Home Page.
Southern Region (Information provided by the Southern Regional Climate Center)
- Temperatures for the month of May exhibited an east-to-west pattern across the Southern Region, with above normal temperatures in the east and below normal temperatures in the west. Parts of northwestern and western Oklahoma as well as northern Texas experienced temperatures 4 to 6 degrees F (2.22 to 3.33 degrees C) below normal. Parts of western and northern Texas as well as western Oklahoma experienced temperatures 2 to 4 degrees F (1.11 to 2.22 degrees C) below normal. Conversely, parts of southern and eastern Texas, western, northern, and southeastern Louisiana, central, southern, and eastern Arkansas, and most of Mississippi and Tennessee experienced temperatures 2 to 4 degrees F (1.11 to 2.22 degrees C) above normal. Parts of northeastern Mississippi as well as central and eastern Tennessee experienced temperatures 4 to 6 degrees F (2.22 to 3.33 degrees C) above normal. The statewide monthly average temperatures were as follows: Arkansas – 70.50 degrees F (21.39 degrees C), Louisiana – 75.90 degrees F (24.39 degrees C), Mississippi – 74.20 degrees F (23.44 degrees C), Oklahoma – 67.00 degrees F (19.44 degrees C), Tennessee – 70.00 degrees F (21.11 degrees C), and Texas – 72.50 degrees F (22.50 degrees C). The statewide temperature rankings for May were as follows: Arkansas (thirty-second warmest), Louisiana (fifteenth warmest), Mississippi (sixteenth warmest), Oklahoma (fortieth coldest), Tennessee (eleventh warmest), and Texas (sixty-second warmest). All state rankings are based on the period spanning 1895-2019.
- Precipitation values for the month of May were above normal across a broad portion of the Southern Region. Parts of northern Tennessee as well as western and southern Texas received 50 percent or less of normal precipitation, while parts of southern and western Texas received 25 percent or less of normal precipitation. In contrast, parts of central, southern, northern, and eastern Texas, central, southern, and northwestern Louisiana, southern and western Mississippi, western, northern, central, and southeastern Arkansas, and most of Oklahoma received 150 percent or more of normal precipitation. Parts of central, northern, and eastern Texas, southern and western Louisiana, southwestern, southeastern, central, and northern Arkansas, and western, northern, central, and southern Oklahoma received precipitation 200 percent or more of normal. Parts of eastern Texas as well as northern Oklahoma received precipitation 300 percent or more of normal. The statewide precipitation totals for the month were as follows: Arkansas – 9.19 inches (233.43 mm), Louisiana – 7.93 inches (201.42 mm), Mississippi – 6.13 inches (155.70 mm), Oklahoma – 11.18 inches (283.97 mm), Tennessee – 3.68 inches (93.47 mm), and Texas – 5.08 inches (129.03 mm). The state precipitation rankings for May were as follows: Arkansas (tenth wettest), Louisiana (fourteenth wettest), Mississippi (twenty-fourth wettest), Oklahoma (second wettest), Tennessee (forty-third driest), and Texas (fifteenth wettest). This was the fifth wettest May on record for the Southern Region, and the second consecutive month where the Southern Region experienced a top-ten wettest month on record. All state rankings are based on the period spanning 1895-2019.
- Drought and Severe Weather
- At the end of May, drought conditions improved the Southern Region. Moderate drought classifications were still present in parts of southwestern Texas, but the area experiencing these conditions has decreased, while moderate drought classifications were removed in southern Mississippi. There were no drought conditions in Oklahoma, Tennessee, Louisiana, Mississippi, and Arkansas. There was a decrease in the overall area experiencing abnormally dry conditions, as areas in southern, western, and eastern Texas as well as southern Louisiana saw improvement or removal. However, abnormally dry conditions developed across parts of western and southern Texas, northeastern Mississippi, and central Tennessee.
- In May, there were a total of 1,234 storm reports across Oklahoma, Texas, Arkansas, Louisiana, Mississippi, and Tennessee. There were 217 tornado reports, 478 hail reports, and 539 wind reports. Texas tallied the most tornado (108), hail (343), and wind (202) reports. Unsurprisingly, Texas tallied the most reports total (653), while Tennessee tallied the least (41). May was an active month across the Southern Region, as only four days (May 12, 14, 16, and 27) did not have at least one storm report.
- On May 1, 2019, there were 8 tornado reports across Texas, Oklahoma, and Louisiana. Hail slightly smaller than softball-sized was reported near Megargel, Oklahoma, while a wind gust of 70 mph (112.65 kph) was reported near Marietta, Oklahoma.
- On May 2, 2019, there were 16 tornado reports across Texas, Louisiana, Arkansas, and Tennessee. Baseball-sized hail was reported near Val Verde County, Texas.
- On May 3, 2019, there were 5 tornado reports in Texas. Baseball-sized hail was reported near Coyanosa, Texas, while a wind gust of 70 mph (112.65 kph) was reported near Benavides, Texas.
- On May 5, 2019, a wind gust of 75 mph (120.70 kph) was reported near Pawnee, Oklahoma.
- On May 7, 2019, there were 22 tornado reports across Texas and Oklahoma. There were multiple reports of baseball-sized hail across Texas, with one report of tea-cup sized hail near Fort Stockton, Texas. Wind gusts of 80 mph (128.75 kph) were reported near Wayside, Texas; Vigo Park, Texas; and Alva, Oklahoma.
- On May 8, 2019, there were 15 tornado reports across Texas and Louisiana. Strong winds near Pine Bluff, Arkansas resulted in 4 injuries after a brick wall collapsed at an apartment complex.
- On May 9, 2019, grapefruit-sized hail was reported near Onalaska, Texas, while a wind gust of 76 mph (122.31 kph) was reported near High Island, Texas.
- On May 18, 2019, there were 28 tornado reports across Texas, Oklahoma, Arkansas, and Louisiana, with one injury reported near Ballinger, Texas. A wind gust of 78 mph (125.53 kph) was reported near Pocola, Oklahoma.
- On May 20, 2019, there were 28 tornado reports across Texas and Oklahoma, with one injury reported near Tulsa, Oklahoma. A giant hail stone was reported in Wellington, Texas that was 5.5 inches in diameter. According to the National Weather Service office in Amarillo, Texas, this hail stone is currently tied for the third-largest hailstone ever reported in Texas. A wind gust of 94 mph (151.28 kph) was reported near Marshall, Oklahoma, while a wind gust of 89 mph (143.23 kph) was reported near Knox City, Texas.
- On May 21, 2019, a microburst near Atkins, Arkansas generated a wind gust of 85 mph (136.79 kph), resulting in an injury.
- On May 22, 2019, there were 16 tornado reports across Oklahoma. Baseball-sized hail was reported near Okmulgee, Oklahoma, while a wind gust of 80 mph (128.75 kph) was reported near Vinita, Oklahoma.
- On May 23, 2019, there were 15 tornado reports across Texas and Oklahoma. Baseball-sized hail was reported near Pampa, Texas and Shallowater, Texas. A wind gust of 74 mph (119.09 kph) was reported near Panhandle, Texas.
- On May 24, 2019, baseball-sized hail was reported near Quanah, Texas. Wind gusts between 76-79 mph (122.31-127.14 kph) were reported near Altus, Oklahoma; Altus Air Force Base, Oklahoma; and Hobart, Oklahoma.
- On May 25, 2019, there were 13 tornado reports across Texas and Oklahoma. Baseball-sized hail was reported near Imperial, Texas and McCamey, Texas. A wind gust of 80 mph (128.75 kph) was reported near Fairview, Oklahoma.
- On May 26, 2019, a wind gust of 82 mph (131.97 kph) was reported near Hooker, Oklahoma.
- On May 29, 2019, baseball-sized hail was reported near Blossom, Texas, while strong winds caused an injury and property damage at a country club near Kemp, Texas.
- On May 30, 2019, tea-cup sized hail was reported near Llano County, Texas.
- For more information, please visit the Southern Regional Climate Center Home Page.
Western Region (Information provided by the Western Region Climate Center)
- An active weather pattern continued across the West this month. A series of low-pressure systems passed through the region bringing widespread above normal precipitation to the Southwest, Great Basin, Central and Southern Rocky Mountain states. Below normal temperatures accompanied the active storm cycle.
- An atmospheric blocking pattern over the North Pacific Ocean produced an atypical storm track, allowing several late season storms to move into the Great Basin and Southwest. These systems produced above normal precipitation across California, the Desert Southwest, and the Intermountain West. Sacramento reported 3.42 in (86.9 mm) of precipitation, 450% of normal, marking the wettest May since records began in 1877. Further south, San Diego, California observed 0.80 in (20.3 mm) of precipitation, more than 600% of normal. Several other locations noted well above normal precipitation as well. Barstow, California, reported 0.33 in (8.38 mm), 680% of normal. In northwestern Arizona, Kingman reported 0.85 in (21.59 mm) of precipitation, 654% of normal. In southern Nevada, Las Vegas, marked its 4th wettest May in a 72-year record at 0.80 inches (20.32 mm) 666% of normal. St. George, located in southern Utah, observed 2.05 inches (52.07 mm) of precipitation, 976% of normal, and the wettest May since records began in 1893. In contrast, drier than normal conditions dominated in the Pacific Northwest, resulting in expansion and intensification of drought conditions. Seattle, Washington, reported its 7th driest May on record at 0.62 in (16 mm), 32% of normal.
- In addition to rainfall, several mid-to-high elevation locations in western mountain ranges received significant snowfall. Mammoth Mountain Ski Resort in the California's Sierra Nevada reported 32 inches (81.28 cm) of total May snowfall at an elevation of 8,900 ft (2,700 m). In Utah's Wasatch mountain range, Alta observed 26.5 in (67.31 cm) of May snowfall at 8,700 ft (2650 m). Further east along the Front Range of the Rocky Mountains, Cheyenne, Wyoming observed 12.4 in (31.49 cm), marking the 8th highest May snowfall total since records began in 1935. The additional snowfall and cooler temperatures continued to support well above normal snow pack at higher elevations in the Sierra Nevada, Rocky Mountains, and Great Basin ranges.
- The Pacific Northwest observed above normal temperatures this month. In northwest Washington, the average May temperature in Seattle was 60.5 F (15.8 C), 4.5 F (2.5 C) above normal and the 2nd warmest May since observations began in 1945. In contrast, the remainder of the West was generally 2-5 F (1-3 C) below normal, with several locations across the Great Basin, Southwest, and Central Rocky Mountain states reaching 6-10 F (3-6 C) below normal. St. George, in southern Utah, observed an average temperature of 63.1 F (17.3 C), 9.2 F (5 C) below normal. In Arizona, Ajo recorded an average temperature of 72 F, 7.3 F (4 C) below normal and the coolest May since 1980. Further north, Boulder, Colorado observed its 5th coolest May in a 127-year record at an average temperature of 51.2 F (10.6 C).
- Alaska continued to experience well-above normal spring temperatures statewide in May. Most notable were locations along the western coast of Alaska, where open ocean waters due to a lack of sea ice have enhanced warming throughout the spring. Kotzebue, Alaska reported an average temperature of 43.3 F (6.3 C), 11.4 F (6 C) above normal; surpassing the previous May record by 3.3 F. Elsewhere across Alaska, temperatures ranged 1-5 F (0.5-3 C) above normal. Precipitation was variable statewide. Southcentral Alaska stations observed notable precipitation. Anchorage reported a monthly total precipitation of 2.18 inches (5.53 mm), 303% of normal and the wettest May since observations began in 1951. Drought persisted, however, in Alaska's panhandle, where Ketchikan received 2.5 inches (6.35 mm), 30% percent of normal precipitation. Further south, Hawaii observed above average temperatures statewide. Most locations averaged 1-3 F (0.5-2 C) above normal. In addition to warm temperatures, dry conditions prevailed at most locations throughout the state. While localized stations on the island of Maui observed measurable precipitation, drought conditions intensified statewide; more than 55% of the state was experiencing moderate to severe drought conditions by the end of the month compared to 37% at the start.
Significant Events
- May (all month): US Drought Monitor Removes All Drought Designation in Colorado: An active storm cycle helped reduce drought conditions across the Intermountain West. As of May 28th, the entire state of Colorado was free of all drought designation according to the US Drought Monitor (USDM) for the first time since the inception of the USDM in 2000.
- May (all month): Further development of drought in Washington: Dry conditions, below normal and rapidly diminishing snowpack, above normal temperatures and low stream flows have resulted in expansion of drought conditions in the Pacific Northwest. In Washington, moderate or worse drought conditions expanded from 10% to 43% of the state's area over the course of May. The Washington State Governor declared a drought emergency for 27 watersheds along the Cascade Mountain Range, nearly half of the state. Warm and dry conditions led to an early start to wildfire season with nearly 240 fires reported in western Washington within the first few weeks of May.
- May 24: Severe Thunderstorms in California: An unsettled weather pattern produced localized, severe thunderstorms across California. Redding, in the northern part of the state, experienced intense thunderstorms that produced strong outflow winds, localized flash flooding, and golf ball sized hail. While tornado warnings were issued, no tornados were confirmed; however, wall clouds were reported during the event.
- For more information, please visit the Western Regional Climate Center Home Page.