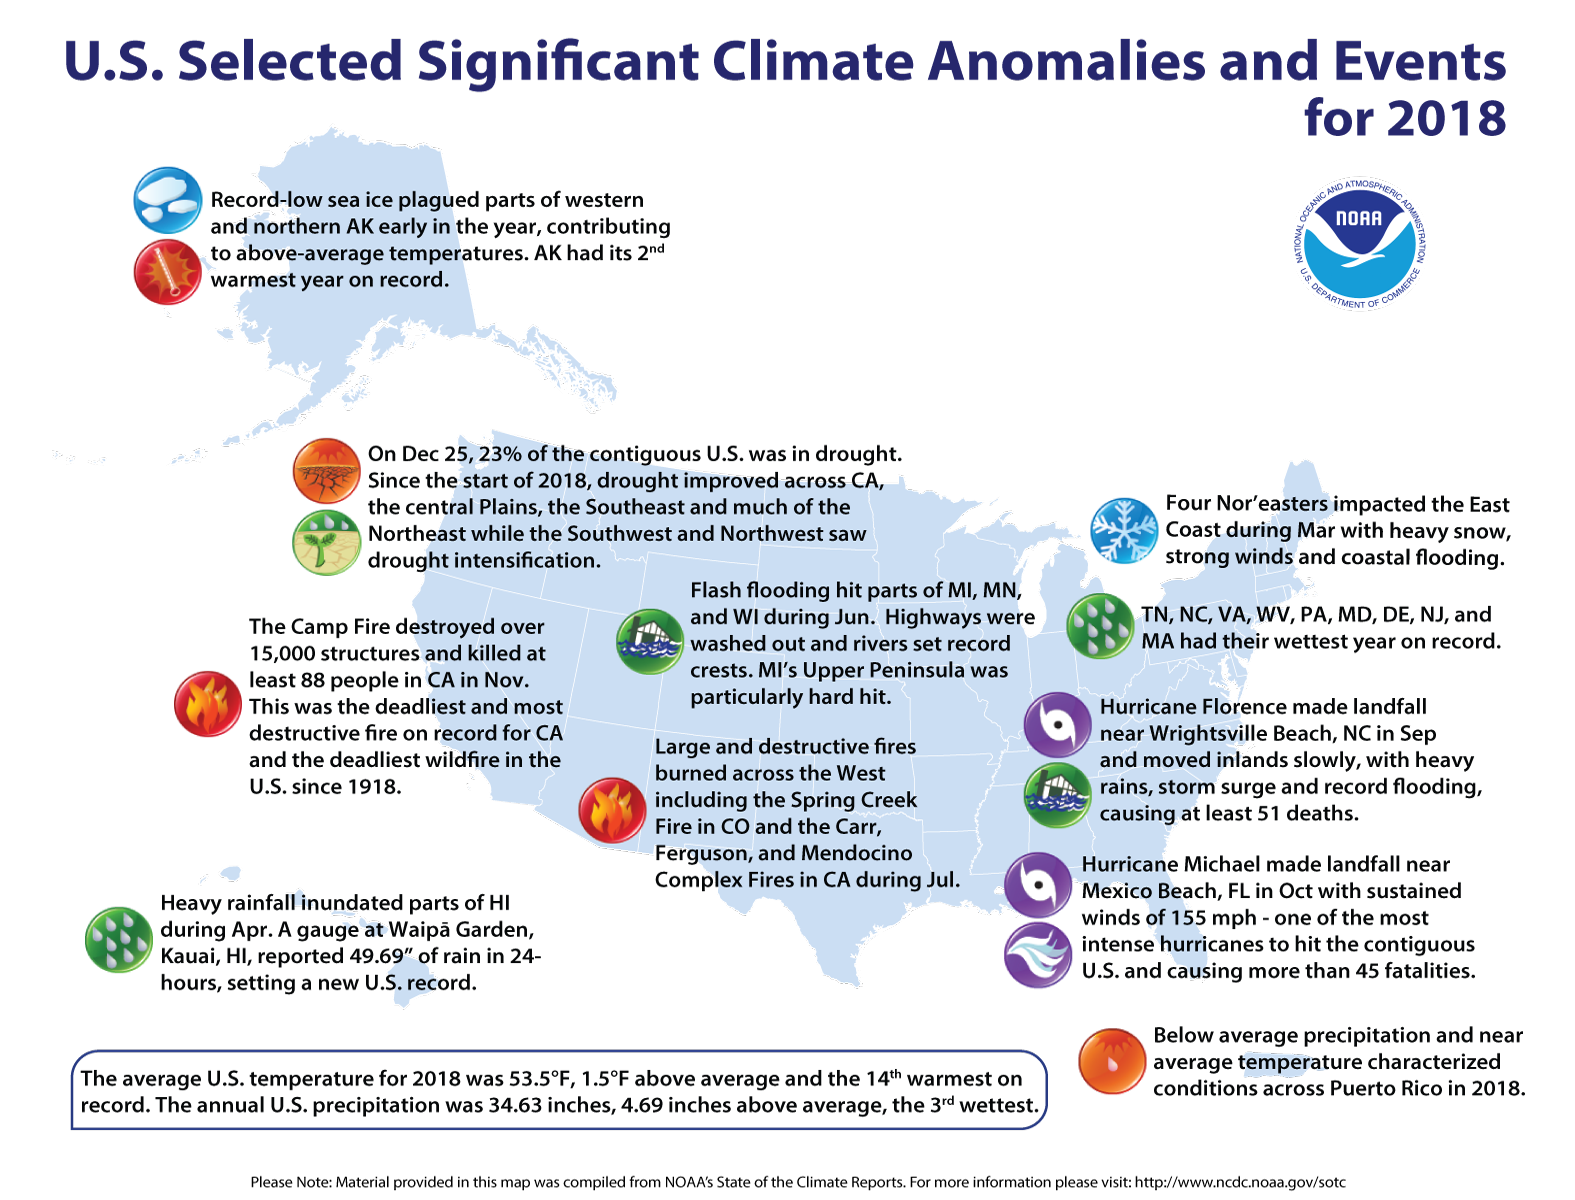
2018 National Events Map
Issued 6 February 2019: Unless otherwise noted, temperature and precipitation rankings refer to a 124-year period of record (1895-2018), and long-term average refers to the 20th century (1901-2000) value. Data for 2018 should be considered preliminary. The most up-to-date temperature and precipitation data is available through Climate at a Glance.
National Temperature and Precipitation Analysis


Based on preliminary analysis, the average annual temperature for the contiguous U.S. was 53.5°F, 1.5°F above the 20th century average. This was the 14th warmest year on record and the 22nd consecutive warmer-than-average year for the U.S. (1997 through 2018). The five warmest years on record for the contiguous U.S. have all occurred since 2006. Since 1895, the CONUS has observed an average temperature increase of 1.5°F per century. Nationally, the average minimum (low) temperature was 42.0°F, the seventh warmest on record, while the average maximum (high) temperature was 65.1°F, which is warmer than average.
This was the coolest year since 2014 and the first year in the last four where the annual temperature for some states was near average. No state ranked record warm for the first time since 2013. Arizona ranked second warmest, New Mexico, third and California was fourth warmest. Fourteen states in the West and Southwest as well as the Southeast and Mid-Atlantic states had annual temperatures which ranked among the 10 warmest on record. Alaska had its second warmest year on record in 2018. Much of the year was characterized by above average to near-record temperatures, often record breaking.
The contiguous U.S. average annual precipitation was 34.63 inches, which is 4.69 inches above the long-term average. This made 2018 the 3rd wettest year on record for the nation, and the sixth consecutive year with above-average precipitation. Since 1895, precipitation across the CONUS has increased at an average rate of 1.81 inches per century.
It was an above-average year for precipitation from the Great Plains to the Atlantic Coast. Nine states had their wettest annual period on record including: Tennessee, North Carolina, Virginia, West Virginia, Maryland, Delaware, Pennsylvania and Massachusetts. Below-average precipitation was observed in parts of the Southwest, West and Pacific Northwest. Several locations along the North Carolina coast and the southern Appalachians observed annual precipitation totals of 100 inches or more for the first time in their observational history. Stations in several states along the East Coast set all-time single-station annual precipitation records for their states, according to preliminary data. These apparent records will be investigated by the State Climate Extremes Committee in the coming weeks.
A persistent wet pattern across the Southeast coupled with tropical precipitation contributed to the above average and record precipitation observed during 2018. One of the largest contributors to the annual totals included the record widespread rainfall, which occurred across parts of North Carolina, South Carolina and Virginia associated with Hurricane Florence in September. Florence moved inland, slowly, bringing heavy and steady rains across a large swath of the region, with many reports of between two and three feet of rainfall.
According to the U.S. Drought Monitor, drought extent peaked at 39.6% of the contiguous United States in early February 2018. Drought became less intense across much of California by the end of 2018 and was eliminated across parts of the central Plains, Southeast and much of the Northeast. In the Southwest and Northwest, drought intensified as 2018 progressed.
Alaska Annual Summary


The average statewide temperature for Alaska during 2018 was 30.4°F, 4.4°F above average, and the second warmest year for an Alaska statewide record that dates back to 1925. This was also the sixth consecutive warmer than average year. Much above average temperatures occurred across all but the northeastern and southeastern divisions, where temperatures were above average. The Alaska annual temperature is increasing at an average rate of 2.9°F per century.
Precipitation was above average for the year as a whole and the eighth consecutive year with near-to or above average precipitation. The South Panhandle experienced its driest year on record in 2018, whereas the remainder of the panhandle ranked below to much below average precipitation for the year.
Climate Extremes Index

The U.S. Climate Extremes Index (USCEI) for 2018, when taking into account landfalling tropical cyclones was 66% above average, and ranked as the eighth highest annual USCEI in the 109-year record. When excluding the tropical cyclone component, the USCEI remained 66% above average and ranked as the ninth highest on record. On the national scale, extremes in warm minimum temperatures (fifth highest) and days with precipitation (highest) contributed to the elevated USCEI. Note, each of these components only look at the contiguous United States. Regionally, the USCEI was the second highest for the Southwest and fifth highest for the Southeast.
Monthly National Snow and Ice Report

According to NOAA data analyzed by the Rutgers Global Snow Lab, for the winter season (December 2017-February 2018), the contiguous U.S. snow cover extent was 18,400 square miles below the 1981-2010 average and ranked near the middle of the 52-year period of record. The 2017/18 winter snow cover extent was smaller than the snow cover extent of the previous two winter seasons. Much of the snow that fell across the U.S. during the December-February period occurred across the central U.S., the northern Rockies and High Plains. By the end of December, snow blanketed much of the northern Tier of the contiguous U.S. Warm temperatures across the West in January limited snow cover to the high elevations while cold air outbreaks impacted the East and contributed to elevated snow totals. The combination of below-average temperatures and above-average precipitation resulted in above-average snow across the central and northern Rockies during February. An active storm pattern in February brought a peak in snow cover to 48 percent before ending the winter season with 35% of the U.S. blanketed in snow.

Winter and spring mountain snowpack provide a crucial water source across much of the western United States. The total annual water budget for agriculture and human use in the mountainous West is highly dependent on the amount of snow melt that will occur in spring and is proportional to the amount of snow on the ground. The annual snow pack typically peaks in early April. On April 1st, the typical snowpack peak in many western U.S. locations, below-average snowpack, in some instances less than 25 percent of normal, was observed in the southern Cascades, Great Basin and Southern Rockies. Above-average snowpack was observed in the northern Cascades and Northern Rockies with totals more than 180 percent of normal in parts of Idaho, Montana, Washington and Wyoming. Near- to below-average snowpack was observed in the Sierra Nevada Mountains and Central Rockies. In the Sierra Nevada Mountains, heavy precipitation during March helped to boost the peak snowpack after very low snowpack during earlier periods of the cold season. In Alaska, below-average snowpack was observed across southern parts of the state with much-above-average snowpack for interior locations.
Monthly Tropical Cyclones Report
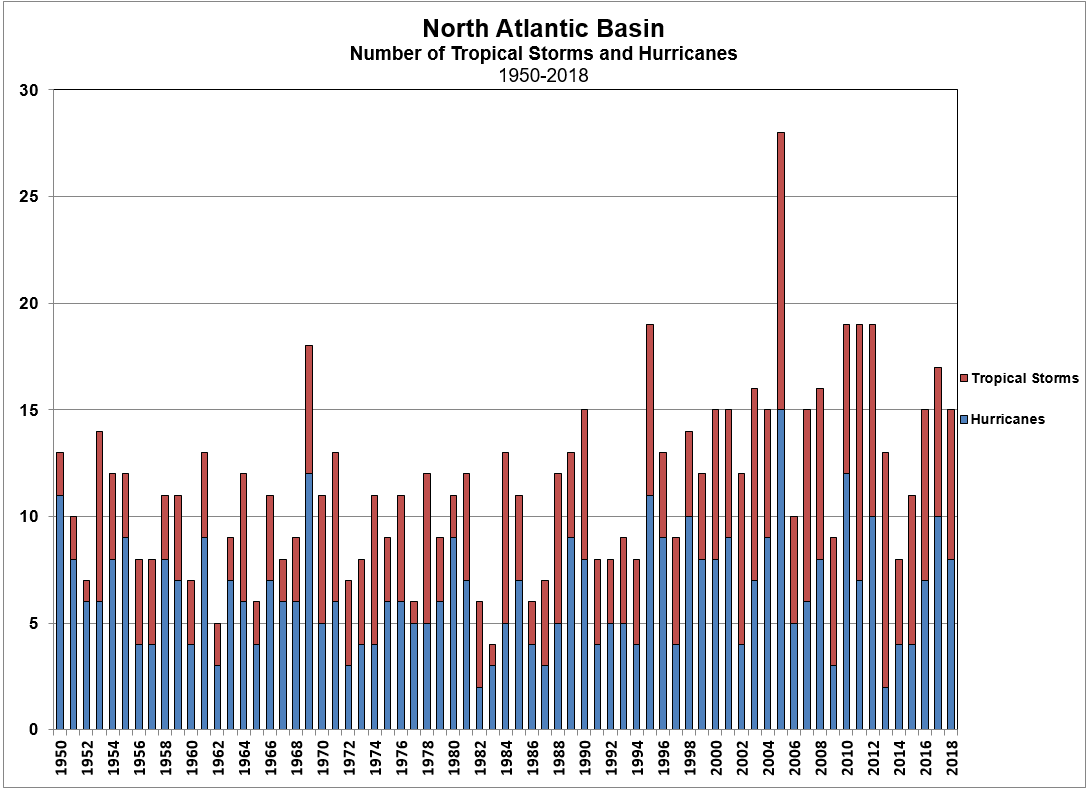
The 2018 North Atlantic hurricane season had 15 named storms, 8 hurricanes, and two major hurricanes. This is above the 1981-2010 average of 12.1 named storms, 6.4 hurricanes, and 2.7 major hurricanes. The number of named storms ranked as a tie for the tenth most on record. Both of the major hurricanes — Florence and Michael — impacted the U.S. mainland causing approximately 49 billion in damages between them and contributed to one of the costliest years in terms of weather and climate disasters for the nation. Although Florence weakened significantly before making landfall as a Category 1 storm, she brought unprecedented amounts of rainfall and subsequent flooding to parts of North and South Carolina. During the 2018 North Atlantic hurricane season, Tropical Storms Alberto and Gordon as well as Hurricanes Florence and Michael made landfall in the U.S.
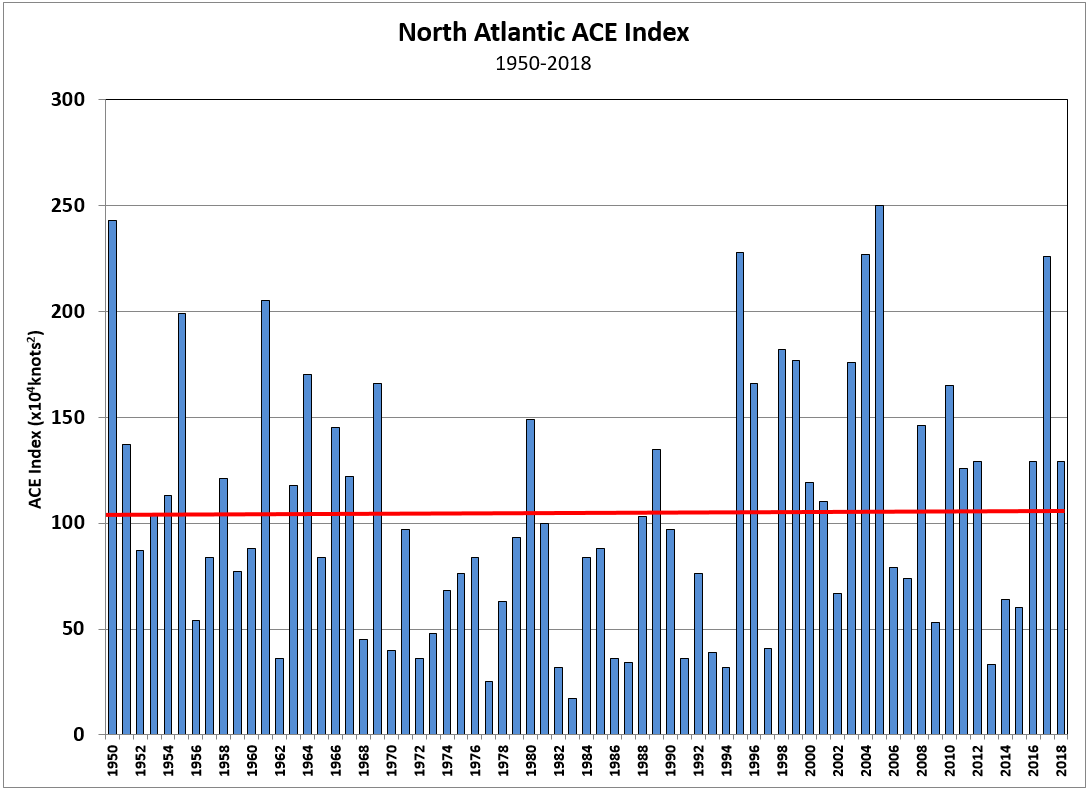
The Accumulated Cyclone Energy (ACE) index of tropical cyclone activity also indicated an above-average season in the North Atlantic. The ACE index is used to calculate the intensity of the hurricane season and is a function of the wind speed and duration of each tropical cyclone. The 2018 Atlantic hurricane season had an approximate ACE of about 129 (x104 knots2) which is greater than the 1981-2010 average value of 104 (x104 knots2).
East Pacific Basin
2018 Season Summary:
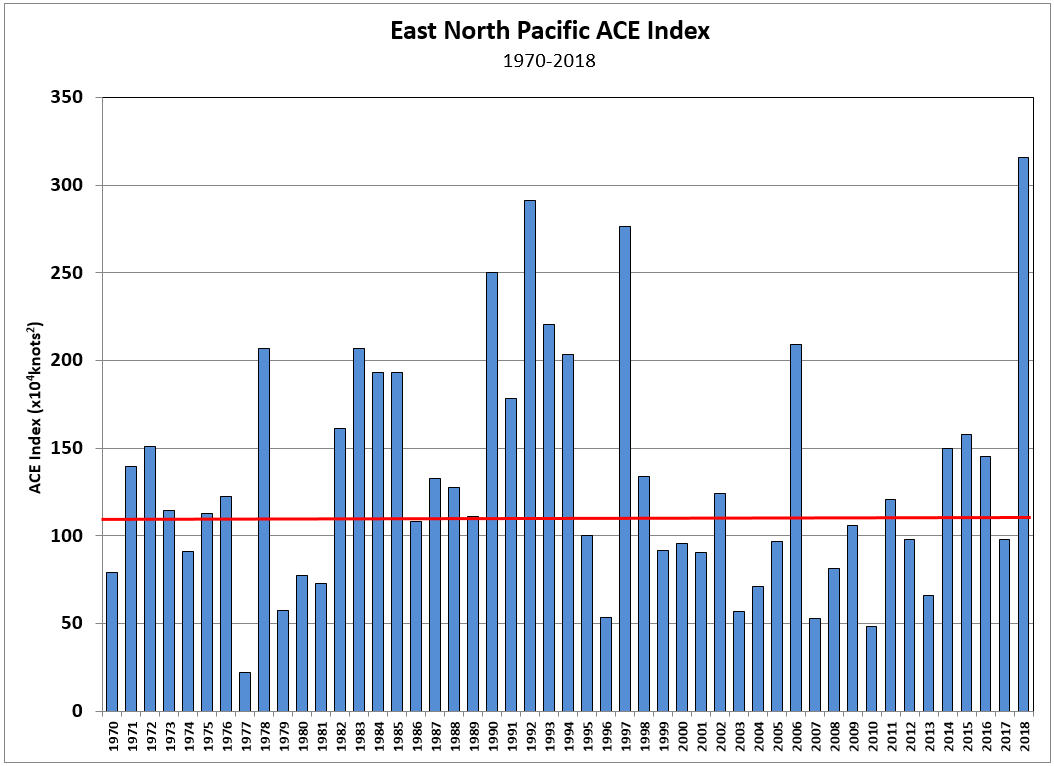

The 2018 East Pacific hurricane season was very active with 23 named storms, including 13 hurricanes, ten of which became major. The 1981-2010 average number of named storms in the East Pacific is 16.5, with 8.9 hurricanes, and 4.3 major hurricanes. This ties with 1985 and 1982 as the second highest number of named storms for a season. Four East Pacific tropical cyclones made landfall in 2018 along the coast of Mexico: Bud, Rosa, Sergio and Willa. Hurricane Walaka formed in the Central Pacific Ocean and was included with the East Pacific storm count and ACE value. The ACE index for the East Pacific basin during 2018 was 316 (x104 knots2), which is the highest ACE value on record and almost three times the 1981-2010 average of 132 (x104 knots2 ).
Monthly Tornadoes Report

2018 Tornado Occurrences
Source: SPC
- During January-March, 118 tornadoes were confirmed with 1030 preliminary tornado reports still pending confirmation for the year. Assuming not all preliminary reports will verify, a reasonable approximation is around 800.
- This is well below the 1991 - 2010 U.S. annual average of 1,253 tornadoes and could be as low as we have seen since 1989.
- In addition to the low tornado counts for 2018, there were no EF4 or EF5 tornadoes confirmed. This is the first time this has occurred in a calendar year since 1950, when tornado statistics began.
Regional Highlights
These regional summaries were provided by the six Regional Climate Centers and reflect conditions in their respective regions. These six regions differ spatially from the nine climatic regions of the National Climatic Data Center.
Northeast Region: (Information provided by the Northeast Regional Climate Center)
- 2018 averaged out to be 47.3 degrees F (8.5 degrees C) for the Northeast, which is near normal. The annual average temperature for eight of the region's twelve states averaged out to be within 0.5 degrees F (0.3 degrees C) of normal. Temperatures for all states ranged from -0.3 degrees F (0.2 degrees C) below normal in New Hampshire to 1.7 degrees F (0.9 degrees C) above normal in Delaware. The Northeast had its third warmest February since 1895 with an average temperature of 32.1 degrees F (0.1 degrees C), 5.9 degrees F (3.3 degrees C) above normal. It was the warmest February on record for Connecticut, Massachusetts, and Rhode Island, as well for as five major climate sites. From February 20 to 21, twenty major climate sites had their all-time warmest February day on record. In fact, for 15 sites, it was the all-time warmest winter day on record. Colder than normal temperatures on April 15 caused Concord, New Hampshire, to have its latest high temperature of 32 degrees F (0 degrees C) or colder. West Virginia had its warmest May on record, as did six major climate sites. July was record warm for Burlington, Vermont, and Caribou, Maine. With an average temperature of 71.4 degrees F (21.9 degrees C), 3.3 degrees F (1.8 degrees C) above normal, the Northeast had its second warmest August since recordkeeping began. It was the warmest August on record for Connecticut, Delaware, Massachusetts, New Hampshire, and Rhode Island. Five major climate sites also had their warmest August on record. Rhode Island had its warmest summer on record, as did Caribou, Maine. The Northeast had its third warmest September on record with an average temperature of 64.9 degrees F (18.3 degrees C), 4.3 degrees F (2.4 degrees C) above normal. September was record warm for Delaware, Maryland, and West Virginia. Elkins, West Virginia, and Atlantic City, New Jersey had their warmest September on record, while Erie, Pennsylvania, had its greatest number of September days with a high of at least 90 degrees F (32 degrees C). On October 8, Erie, Pennsylvania, tied its all-time warmest October temperature on record with a high of 89 degrees F (32 degrees C). With low temperatures ranging from 70 degrees F (21 degrees C) to 72 degrees F (22 degrees C) on October 9, Rochester, New York; Erie, Pennsylvania; and Syracuse, New York, set/tied their all-time warmest minimum temperature records for October. On November 2, Atlantic City, New Jersey, had its highest minimum temperature for November with a low of 66 degrees F (19 degrees C). An unseasonably cold air mass settled over the Northeast during the Thanksgiving holiday (November 22 to 24), with temperatures up to 35 degrees F (19 degrees C) below normal. In the coldest areas, low temperatures were below 0 degrees F (-18 degrees C) and high temperatures were in the single digits (degrees F). These were some of the all-time coldest November temperatures on record for the Northeast. Six major climate sites recorded their all-time coldest temperatures on record for November. In addition, six sites had their all-time lowest maximum temperatures for November on record. It was the coldest Thanksgiving Day on record for Buffalo and Rochester, New York.
- The Northeast had one of its wettest years on record receiving 57.35 inches (145.67 cm) of precipitation, 129 percent of normal. 2018 also ranked among the wettest years on record for Connecticut, Delaware, Maryland, New Jersey, Pennsylvania, Rhode Island, and West Virginia. Precipitation for all states ranged from 99 percent of normal in Vermont to 157 percent of normal in Maryland. In addition, eight major climate sites had their wettest year on record. On January 23, Caribou, Maine, had its largest one-day precipitation total for January with 1.72 inches (43.69 mm) of precipitation. Pennsylvania and West Virginia had their wettest February on record, as did six major climate sites. It was a record wet May for Maryland. Pennsylvania had its wettest July since recordkeeping began. Four major climate sites also had their wettest July on record. August was record wet for Concord, New Hampshire. It was the wettest summer on record for Pennsylvania, as well as for Dulles Airport, Virginia, and Williamsport, Pennsylvania. With 6.62 inches (168.15 mm) of precipitation, 169 percent of normal, the Northeast had its third wettest September since 1895. West Virginia had its wettest September on record, as did five major climate sites. The Northeast had its third wettest November on record with 6.17 inches (156.72 mm) of precipitation, 161 percent of normal. Delaware, Maryland, and Massachusetts had their wettest November on record. Seven major climate sites also had their wettest November on record. On November 2, Allentown, Pennsylvania, had its wettest November day on record with 3.45 inches (87.63 mm) of precipitation. The Northeast had a record wet autumn, receiving 17.21 inches (437.13 mm) of precipitation, 148 percent of normal. Maryland, New Jersey, Rhode Island, and West Virginia had their wettest autumn on record, as did ten major climate sites.
- According to the U.S. Drought Monitor released on January 4, 2018, 5 percent of the Northeast was in a moderate drought and 19 percent of the region was abnormally dry. During the month, drought and abnormal dryness lingered or slightly expanded. By month's end, conditions worsened in parts of Maryland, leading to the introduction of severe drought. Below-normal streamflow and groundwater levels were reported in some areas, especially those experiencing severe drought. The U.S. Drought Monitor released on February 1 showed 5 percent of the Northeast was in a severe or moderate drought and 21 percent of the region was abnormally dry. Above-normal precipitation throughout February drastically improved drought conditions, leaving just 2 percent of the Northeast abnormally dry and a small area of moderate drought in Maryland (based on the U.S. Drought Monitor released on March 1). Dry conditions persisted but improved in Maryland during March, with the U.S. Drought Monitor released on April 5 showing less than 1 percent of the Northeast in a drought and 1 percent as abnormally dry. Dryness lingered in Maryland through most of April, with the U.S. Drought Monitor released on May 3 indicating 2 percent of the Northeast was abnormally dry. By late May, dryness had eased in Maryland, but New England began to dry out and abnormal dryness was introduced. The U.S. Drought Monitor released on May 31 showed 1 percent of the Northeast as abnormally dry. A water ban was enacted in Northampton, Massachusetts, on June 15 as a result of the increasingly dry conditions throughout the area. Dry conditions also prompted over 75 Public Water Suppliers to enforce varying degrees of water bans in other locations throughout Massachusetts. Dryness expanded to include New York by mid-June, and moderate drought was introduced in northern New England by late June. The U.S. Drought Monitor released on July 5 showed 6 percent of the Northeast in a moderate drought and 27 percent of the region as abnormally dry. Reduced harvests and heat stress caused problems for growers in parts of northern New England. During July, drought and abnormal dryness eased in some parts of New York and New England but expanded in other parts of these states, with the U.S. Drought Monitor released on August 2 showing 9 percent of the Northeast in a moderate drought and 18 percent of the region as abnormally dry. During August, dry conditions lingered but improved across New York and New England. By month's end, 7 percent of the Northeast was in a moderate drought and 13 percent was abnormally dry (based on the U.S. Drought Monitor released on August 30). In September, conditions worsened in northern New England and northern New York, with the introduction of severe drought, but dryness eased in southern New England. Farmers in northern New York reported decreased hay and pasture production. In Aroostook County, Maine, dry conditions contributed to a hay shortage and allowed bedstraw, an invasive plant species, to flourish, reducing the number of acres of hay for some farmers. Springs and private wells continued to run dry in parts of northern Vermont. Water levels at two dams on the Lamoille River were too low to make electricity. Companies that drill, deepen, or replenish wells saw increased business. The U.S. Drought Monitor released on October 4 showed 5 percent of the Northeast in a severe or moderate drought and 17 percent of the region as abnormally dry. Dryness lingered but improved during October, with the U.S. Drought Monitor released on October 30 showing 2 percent of the Northeast in a severe or moderate drought and 9 percent of the region as abnormally dry. While rainfall during the month allowed dry conditions to slowly ease, streamflow and groundwater levels remained below normal in parts of northern New York and northern New England. Drought eased by mid-November but abnormal dryness lingered through the rest of November and all of December. The U.S. Drought Monitor released on December 27 showed 4 percent of the Northeast as abnormally dry.
- From January 3 to 5, a nor'easter dropped up to 24 inches (61 cm) of snow on the Northeast, mainly coastal areas from southern Maryland to northern Maine. The storm produced snowfall rates of up to 3 inches (8 cm) per hour, and thundersnow was reported in several locations. Thirteen major climate sites set daily snowfall records, with a few sites ranking their daily snow total among their top five greatest for January. Strong winds of up to 76 mph (34 m/s) produced blizzard conditions in parts of New England and southeastern New York. More than 5,000 flights were cancelled nationwide, mostly in the Northeast. Kennedy and LaGuardia airports suspended operations, with Kennedy Airport being closed for around 20 hours. There were also power outages in the region. In addition, parts of coastal New England experienced high water levels and significant flooding. Boston, Massachusetts, had its highest tide on record (since 1921) and Portland, Maine, had its third highest tide on record (since 1912). Storm reports indicated that some areas were inundated by up to five feet (1.5 m) of water, with numerous impassable roads and flooded basements.
- An active weather pattern brought four major storms to the Northeast in March. On March 2, a snowstorm impacted much of central New York. Areas west of Albany, New York received up to 40 inches (101.6 cm) of snow, mainly in Schoharie County. Strong winds associated with the storm downed trees and power lines, which caused over 83,000 customers to lose power. Although much of the snow from this storm fell in New York, wind gusts greater than 90 miles per hour (40 m/s) were reported in southeastern Massachusetts, particularly areas near Barnstable and Nantucket, Massachusetts. A few days later on March 7, a nor'easter brought heavy, wet snow to eastern New York, northern New Jersey, and much of New England. Locations in western Massachusetts and southern Vermont received the most snow, with Woodford, Vermont reporting 36 inches (91.4 cm) of snow from this storm. Flooded streets led to road closures in Duxbury, Massachusetts, and many other coastal areas. The wind gusts from the storm also caused over 320,000 customers to lose power. Just a few days after that storm, another nor'easter moved through the region on March 13, impacting eastern New England. Penobscot, Maine received 30 inches (76.2 cm) of snow from this storm. Blizzard conditions were reported in Boston, Massachusetts, with winds gusting over 40 miles per hour (18 m/s), as well as in other locations along coastal Massachusetts and Rhode Island. Boston, Massachusetts and Worcester, Massachusetts ranked this storm as their largest one-day March snowfalls on record. A week later on March 21, another nor'easter moved through the Northeast, with the greatest snowfall totals reported in New York, New Jersey, Pennsylvania, and Maryland. This nor'easter closed schools in New York City and many surrounding areas, and also caused more than 5,000 flights to be cancelled. Patchogue, New York recorded 20.1 inches (51.1 cm) of snow. The snowfall pushed Islip, New York's monthly total into record territory. The site picked up 31.9 inches (81.0 cm) of snow this March, beating the previous record of 23.3 inches (59.2 cm) set back in March 1967. The four nor'easters during the month of March impacted many within the Northeast and led to numerous school cancellations, accidents, and travel delays throughout much of the region. These storms contributed to Islip, New York; Kennedy Airport, New York; and Worcester, Massachusetts, having their snowiest spring on record.
- Several heavy rain events led to flash flooding during late spring and summer. Torrential rain on May 27 caused catastrophic flooding in Ellicott City, Maryland, where estimates show the Patapsco River rose 17.8 feet (5.4 m) in less than two hours. In total, over nine inches (228.6 mm) of rain were reported near Catonsville, Maryland. The National Weather Service issued a flash flood emergency, its most severe flood alert. As Ellicott City was just finishing rebuilding from a similar flood event in 2017, this year's flood heavily damaged buildings and houses along the city's Main Street, and caused more than $20 million in damage. Parts of the region received heavy rain in late July. For instance, Dunkirk, Maryland, received 16.55 inches (420.4 mm) of rain over the span of five days, ending on July 26. The heavy rain caused several waterways to quickly rise. For example, on July 24, Swatara Creek in Pennsylvania rose to 17 feet (5.2 m), which is 15 feet (4.6 m) above its usual height. Significant flooding occurred, with evacuations, water rescues, road damage, and compromised home foundations reported. Knoebel's and Hershey Park in Pennsylvania had to close park operations for a period of time. A stagnant weather pattern in mid-August provided plenty of tropical moisture to slow-moving storms over the region. Receiving more rain in a day than what usually comes in a month, several areas in New York and New Jersey experienced significant flooding. From August 13 to 14, Lakewood, New Jersey, received 8.01 inches (203.5 mm) of rain. In nearby Brick, New Jersey, over 100 homes were evacuated due to flash flooding. In central New York, a similar sequence of events occurred during that same time frame. Hector, New York, recorded 6.38 inches (162.1 mm) of rain from August 13 to 14, then received another 5.15 inches (130.8 mm) during a 24-hour stretch ending August 15. The storms caused a mandatory boil water order to be in effect for nine days and resulted in the cancellation of the Phish Festival in Watkins Glen, New York, due to the unavailability of clean drinking water for the 30,000 people that were expected to attend. In both coastal New Jersey and central New York, the extreme rainfall led to road closures, damaged homes, and water rescues.
- October was an active month for tornadoes in the Northeast. On October 2, a rare tornado outbreak occurred in Pennsylvania when 14 tornadoes touched down in the state. This was the state's largest single-day tornado outbreak since June 2, 1998. Pennsylvania averages only 15 tornadoes for an entire year, and from 1950 to 2018, the state had only recorded a total of 13 October tornadoes. The tornadoes downed hundreds of trees and caused structural damage. Golf ball-sized hail also accompanied some of the storms. The same storm system also produced three tornadoes in southeastern New York and two in Connecticut. On October 20, another tornado touched down in New York. On October 23, four tornadoes touched down in southern New England-one in Rhode Island and three in Massachusetts. The tornado on the 23rd was the latest tornado in the calendar year for Rhode Island. The most recent October tornado in Massachusetts was in 1970. Severe weather struck again on October 29 when a tornado touched down in Connecticut and another touched down in New York, adding to the October tornado count in those states.
- An early season winter storm from November 15 to 16 dropped mixed precipitation and up to 18 inches (46 cm) of snow on the region. Newark, New Jersey, and Kennedy Airport, New York, had their greatest 1-day snowfall for November, with 6.4 inches (16 cm) and 4.8 inches (12 cm), respectively. The storm also made it Kennedy Airport's snowiest November on record. For Central Park, New York, and Newark, it was the earliest 6+ inch (15 cm) snowstorm on record. Thundersnow occurred in southern New England. The storm caused major travel disruptions. News reports indicated there were numerous accidents, commuters and students that were stranded for hours, and thousands of delayed and cancelled flights.
- For more information, please go to the Northeast Regional Climate Center Home Page.
Midwest Region: (Information provided by the Midwest Regional Climate Center)
- Annual averaged temperatures in the Midwest were near normal. The entire region was within 2 degrees F (1 C) of normal when averaged over the entire year. There were however periods of both warm and cold that offset each other. April was the 2nd coolest on record (1895-2018) while May set the record as warmest for the region. Other months were quite warm (Jun ranked 13th warmest and September ranked 15th warmest) or cool (November ranked 11th coolest) as well. There were notable swings in temperature across the region in 2018. Spring saw a sudden jump from cold in April to warm in May and fall had a similar sudden transition from warmth in September and the first 10 days of October to cold in the rest of October and November. There were also big swings of temperature in January, July, and December in 2018. Statewide temperatures set records in three months. April had new record cold in Iowa and Wisconsin. May had record warmth in Illinois, Indiana, Kentucky, Missouri, and Ohio. Ohio set another record for warmth in September. There were numerous other top-10 rankings for states including top-10 warmth in February (Kentucky and Ohio), May (all nine Midwest states), June (Iowa and Missouri), August (Michigan), and September (Illinois, Indiana, Kentucky, and Ohio). Top-10 statewide rankings on the cool side occurred in April (all nine Midwest states) and November (Illinois and Missouri).
- Precipitation was record breaking on the wet side in 2018. The Midwest as a whole was just wetter than 1993 (using preliminary data for December) with an average of 42.88 inches (1089 mm) across the region. Statewide totals ranked among the wettest in their histories (1895-2018) with Iowa, Kentucky and Wisconsin ranking 2nd wettest, Ohio 3rd, Indiana 5th, Michigan 11th, and Minnesota 17th. Only Missouri had below-normal annual precipitation falling 0.27 inches (7 mm) short of normal. Statewide values ranked among the wettest in several months including February, June, August, September, October, and November. Missouri also had a top-10 driest month in April. More than 120 stations in the region set new annual precipitation records (minimum of 30 years period of record) with dozens of those stations having periods of record exceeding 100 years. Some of the bigger cities that set such records in 2018 were Louisville and Lexington in Kentucky, Columbus in Ohio, Waterloo in Iowa, and Green Bay in Wisconsin. Each of these cities had period of record of at least 124 years.
- Drought in the Midwest began 2018 with just under 10 percent of the region in drought. In the summer drought expanded and intensified, particularly in Missouri and southern Iowa but also in Michigan, peaking in mid-August before being completely eradicated by the end of 2018. At its peak in August, nearly 20 percent of the region was in drought, with more than 8 percent in severe drought and 0.77 percent in exceptional drought (the highest category). More than 43 percent of the region was classified in drought or abnormally dry in mid-August but by the end of the year there was no drought and less than 1 percent of the region was classified as abnormally dry which was the lowest percentage since May of 2018.
- Flooding was a problem in the region for a good part of 2018. Flooding started in February and continued to pop up as a problem throughout the year as heavy rains fell, particularly in two large areas: northern Iowa to southern Wisconsin and into neighboring areas and also in the Ohio River Valley. During the year, at least 14 fatalities were attributed to flooding or flash flooding in the Midwest. Property damages were estimated at more than $300 million through September with data for the last three months still pending. Crop damages in Iowa and Wisconsin alone topped $17 million.
- Severe weather in the Midwest was not typical with very little in April, near the climatological peak, and yet with tornadoes in both January and December. The December 1st tornado outbreak in Illinois set a new state record with 28 tornadoes. There were about 500 homes damaged and 22 injuries in the EF-3 tornado that struck Taylorville, Illinois on the 1st. There was also a deadly tornado near Aurora, Missouri the previous day. Another significant severe weather event was the sinking of a duck boat in the Ozarks of Missouri on July 19th. The duck boat was being used to give a tour on the lake when a severe thunderstorm whipped up large waves and sank the boat.
- Spring planting, especially in the northern half of the region, was delayed due to wet and cold conditions in March and then cold and snowy conditions in April. Wet fields in the fall also affected harvest in many areas with fields too wet, and in some cases with standing water, to allow tracktors into the fields.
- Winter weather struck in April in the north bringing records snows to Iowa, Minnesota, and Wisconsin. The storm had snow totals of more than 2 feet (61 cm) in many locations. Green Bay, Wisconsin set a record for its snowiest April on record 36.7 inches (93 cm) which also ranked as the 2nd snowiest month all-time (December 2008). A blizzard hit on the Thanksgiving weekend in late November snarling air and ground traffic from Kansas City to Chicago.
- For further details on the weather and climate events in the Midwest, see the weekly and monthly reports at the Midwest Climate Watch page.
Southeast Region: (Information provided by the Southeast Regional Climate Center)
The top 10 weather and climate extremes that occurred across the region during the year are designated with 'Extreme' in parentheses. The numbers associated with each extreme are used as identifiers rather than rankings.
- Temperatures across the Southeast were warmer than normal in 2018, except for a few small and isolated pockets in Alabama, Florida, Georgia and the Carolinas. The majority of the region was 1-2 degrees F (0.6 to 1.1 degrees C) warmer than normal, although a few stations in Alabama and Florida reported annual temperatures that were more than 3 degrees F (1.7 degrees C) above normal. Nine long-term stations (records of 50 years or longer) reported mean temperatures that were in the top three warmest on record, including Key West, FL (1874-2018; 3rd warmest), Tampa, FL (1890-2018; 3rd warmest), Cape Hatteras, NC (1895-2018; 2nd warmest), and Greenville, SC (1958-2018; 3rd warmest). The only long-term station that reported a maximum temperature ranked in the top three warmest was Plant City, FL (1949-2018; 2nd warmest), while two stations reported maximum temperatures in the lowest three, including Covington, VA (1963-2018; 1st coldest) and Juncos, PR (1949-2018; 3rd coldest). By comparison, there were 44 long-term stations with minimum temperatures in the top three warmest, and none in the lowest three, including Asheville, NC (1894-2018; 1st warmest), Cedartown, GA (1942-2018; 1st warmest), and Louisa, VA (1920-2018; tied for 1st warmest). Temperatures varied significant across the region from month to month. In January, several long-term stations in the Carolinas and Virginia observed or tied their highest or second highest count of January days with a maximum temperature of 32 degrees F (0 degrees C) or less, including Greensboro, NC (1903-2018; 8 days), Williamsburg 2 N, VA (1952-2018; 7 days), New Bern, NC (1949-2018; 6 days), and Florence, SC (1948-2018; 4 days) (Extreme #1). After the cold start to the year, February roared in with 70 percent of the long-term stations reporting mean temperatures that were at least 8 degrees F (4.4 degrees C) warmer than normal. Every state in the region observed its warmest February on record except Virginia, which recorded its second warmest February (Extreme #2). The months of March through August were variable across the region but did not set many records for either warm or cold conditions. By late August, however, a strong ridge of high pressure began to dominate much of the Southeast, bringing record heat to the region, which lasted from late August until mid-October, when temperatures finally cooled off. Many mainland stations reported one of their warmest Septembers on record, including Shelby, NC (1936-2018; 1st warmest), Asheville, NC (1892-2018; 1st warmest), Tarpon Springs, FL (1894-2018; 1st warmest), Gainesville, FL (1890-2018; 1st warmest), and Atlanta, GA (1878-2018; 2nd warmest). Tampa, FL (1890- 2018) reported a monthly average temperature of 85.9 degrees F (29.9 degrees C), which broke the old monthly temperature record for any month previously held by June 1998 with a temperature of 85.6 degrees F (29.8 degrees C). Seven stations reported a temperature of 100 degrees F (37.8 degrees C) during the month; the 100-degree F (37.8 degrees C) reading in Macon, GA was the first September 100-degree F reading since September 8, 1990 (Extreme #3). Humidity was also very high in September, with a number of inland airport stations reported new records for the number of hours with a dew point temperature of 65 degrees F (18.3 degrees C) or higher, including Charlotte, NC, Greenville-Spartanburg, SC and Asheville, NC, which reported more than 500 additional hours of very humid conditions above their previous records. In early October, many stations reported temperatures greater than 90 F (32.3 C); a number of National Weather Service offices noted that these were the latest occurrences of over 90 F in any year for their locations. The year ended with a colder than normal November, especially in the northwestern part of the region, and a warmer than normal December. Several stations in eastern Virginia and North Carolina reported a record number of days in 2018 with maximum temperatures at or above 85 degrees F (29.4 degrees C), including Cape Hatteras, NC (1893-2018; 103 days), Wilmington, NC (1870-2018; 130 days), Charleston, SC (1938-2018; 157 days) and Savannah, GA (1871-2018; 170 days). Numerous stations along the East Coast reported a record-setting number of days with a minimum temperature at or above 70 degrees F (21.1 degrees C), including Gainesville, FL (1890-2018; 144 days), Birmingham, AL (1895-2018; 110 days), Atlanta, GA (1878-2018; 115 days), and Richmond, VA (1887-2018; 73 days). The coldest temperature of the year at any station in the Southeast was -14 degrees F (-26 degrees C) observed at Wakefield, VA on January 7 and the warmest temperature of the year was 105 degrees F (41 degrees C) observed at the University of South Carolina in Columbia, SC on July 11.
- Annual precipitation across the Southeast was well above normal in most areas of the region, with some small pockets of drier than normal precipitation. January through March was generally dry across the region, as wetter conditions generally prevailed for the rest of the year, especially the months of April through July and December. The driest areas of the Southeast were located along the East Coast of Florida, with deficits as much as 15.6 inches (396 mm) at Melbourne, FL (1936-2018; 7th driest) (Extreme #4). Puerto Rico also experienced drier than normal conditions, with San Juan, PR receiving 4.3 inches (109 mm) less than normal. Drought expanded in both of those locations at the end of 2018. Drier than normal conditions were also observed in southeastern Georgia and South Carolina, where a moderate drought developed earlier in the year before wetter conditions late in the year ended the drought. The rest of the region experienced wetter than normal conditions, particularly areas affected by tropical systems Gordon, Florence and Michael. In Florida, the Big Bend area stretching west along the Panhandle experienced precipitation amounts as much as 20 inches (508 mm) wetter than normal. Pensacola, FL (1879-2018; 4th wettest) received 90.01 inches (2286 mm), which was 24.7 inches (627 mm) above normal and Tallahassee (1892-2018; 9th wettest) received 79.86 inches (2028 mm), which was 20.6 inches (523 mm) wetter than normal. Farther north, precipitation amounts were even higher, especially areas affected by Hurricane Florence. Much of North Carolina and Virginia, as well as the District of Columbia, northern Georgia, and northwestern South Carolina received precipitation amounts that were more than 20 inches (508 mm) higher than normal. Wilmington, NC (1869-2018; 1st wettest) received 102.40 inches (2601 mm) of rain, which was 44.79 inches (1138 mm) wetter than normal. While Hurricane Florence contributed to this rainfall total, Wilmington was so wet in 2018 that they would have set their all-time precipitation record even without the rainfall from Florence (Extreme #5), Jocassee, SC (123.45 inches or 3136 mm), Montebello, VA (104.70 inches or 2659 mm), Sperryville, VA (86.08 or 2186 mm) and Mount Mitchell, NC (139.94 inches or 3554 mm) all set potential new state records for annual precipitation, which will have to be evaluated for accuracy by State Climate Extremes committees (Extreme #6). Numerous locations in North Carolina and Virginia set their all-time record high precipitation in 2018, including Washington, DC (1979-2019; 66.29 inches or 1684 mm), Lynchburg, VA (1892-2018; 65.7 inches or 1669 mm), Morganton, NC (1900-2018; 76.46 inches or 1942 mm), and Carrollton, GA (1945-2018; 73.86 inches or 1876 mm). An additional 36 long-term stations observed precipitation that was ranked 2nd or 3rd wettest, including Atlanta, GA (1878-2018; 70.03 inches or 1779 mm; 2nd wettest), Cape Hatteras, NC (1895-2018; 90.07 inches or 2287 mm; 2nd wettest), and Walhalla, SC (1917-2018; 84.38 in or 2143 mm; 2nd wettest). A number of stations also set records for the number of days with measurable rain, including Pensacola, FL (1880-2018; 156 days), Anniston, AL (1939-2018; 141 days), Toccoa, GA (1899-2018; 161 days), and Lexington, VA (1899-2018; 157 days). Measurable snowfall was recorded in every state across the region during January, with two winter storms producing some of the greatest monthly accumulations in portions of south-central and southeastern Virginia, central and eastern North Carolina, and coastal South Carolina. Portions of northern Florida and southern Georgia observed their first winter storm since December 1989, a span of over 28 years. With a tenth of an inch (2.5 mm) of snow recorded on the 3rd, Tallahassee, FL (1893-2018) observed its first measurable snowfall during the month of January and its greatest 1-day snowfall since December 1989. In southeastern Georgia, Alma (1949-2018) observed its greatest 1-day snowfall for January and its second greatest 1-day snowfall for any month on record, with an accumulation of 3.0 inches. Charleston, SC (1939-2018) observed its greatest 1-day snowfall for January and its third greatest 1-day snowfall for any month on record, with an accumulation of 5.3 inches (135 mm). On February 11, several long-term stations in central and western Virginia observed their wettest February day on record, including Wise 1 SE (1956-2018; 3.74 inches, 95 mm), Appomattox (1938-2018; 2.73 inches, 69.3 mm), and Buckingham (1895-2018; 2.71 inches, 68.8 mm). Well-above-normal snowfall was recorded across portions of North Carolina and Virginia during March, with some of the greatest monthly totals including 36.0 inches (914 mm) on Mt. Mitchell, NC (19.6 inches or 498 mm above average) and 25.2 inches (640 mm) at Burkes Garden, VA (17.8 inches or 452 mm above average). On March 24th and 25th, another winter storm produced 3 to more than 12 inches (76.2 to more than 305 mm) of snowfall across portions of northwestern North Carolina and southwestern Virginia, including 16.3 inches (414 mm) near Long Spur, 16.2 inches (411 mm) near Pilot, and 14.0 inches (356 mm) near Dublin. In addition, 15.0 and 12 inches (381 and 305 mm) of snow fell at Burkes Garden, VA (1896-2018) and Pulaski 2 E, VA (1922-2018), respectively, breaking the greatest 1-day snowfall on record for March and surpassing daily snowfall totals that were recorded during the 'Storm of the Century' in March 1993. On May 24, Talbotton, GA (1893-2018) and Thomaston 4 SE, GA (1956-2018) observed their second and fifth highest 1-day precipitation total for any month on record, with 8.57 and 5.42 inches (218 and 138 mm), respectively. From May 15th through June 1st, Athens, GA (1857-2018) observed its longest streak of 18 consecutive days with measurable precipitation, surpassing its previous record in June 1963 by 4 days. In spite of a rainy summer, the period from mid-August to early September was one of the driest on record for parts of northern Georgia, most of South Carolina, and some stations in North Carolina. In September, Hurricane Florence brought torrential rain to North and South Carolina. The highest rainfall amount from Florence in North and South Carolina was 35.93 inches (913 mm) northwest of Elizabethtown and 23.63 inches (600 mm) west of Loris, respectively. These will likely become new record hurricane rainfalls for those two states. Most of southeastern North Carolina and parts of northeastern South Carolina received rain in excess of a 1000-year return period. Snow was observed unusually early in the season in the Washington D. C. area on November 15, as a developing low-pressure system moved up the East Coast. This resulted in the first measurable snow that occurred there in November in the last 22 years. Reagan International Airport received 1.4 inches (35 mm) and Dulles International Airport received 3.0 inches (76 mm). The snow, which was mixed with sleet and freezing rain, snarled traffic and closed schools. December also brought the first major snowstorm of the year to the Southeast. A low-pressure system skirted the Gulf and Atlantic coasts on December 8-10, as a high pressure to the north provided a source of cold air. Mount Mitchell, NC reported 32 inches (812 mm), Jefferson, NC received 20 inches (508 mm), and Boone, NC recorded 15 inches (381 mm) of snow in the storm. Many sites receive more than a foot of snow, which is close to the annual average snowfall for those locations.
- Four tropical systems (Tropical Storm Alberto, Tropical Storm Gordon, Hurricane Florence and Hurricane Michael) passed through the Southeast in 2018, bringing heavy rain and inland flooding, high winds, tornadoes, storm surge, and other significant impacts to parts of the region. Alberto formed as a subtropical depression over the northwestern Caribbean Sea, became a subtropical storm over the southeastern Gulf of Mexico, and then transformed into a tropical storm before making landfall along the coast of the Florida Panhandle on May 28. Alberto produced heavy rainfall and flooding across the southern and central Appalachian Mountains, which took the lives of eight people in North Carolina and Virginia. Heavy rainfall fell over the Florida peninsula over a multi-day period as Alberto moved northward across the eastern Gulf of Mexico, with a maximum six-day total of 11.80 inches reported at Taylor Creek on the northern shore of Lake Okeechobee from 25-30 May. Maximum rainfall totals of 12.30 inches were reported near Helen in northeastern Georgia, 12.21 inches near Jonas Ridge in western North Carolina, and 5.48 inches near Lewis Mountain Camp in Virginia. The heavy rains caused flooding of several rivers, especially across western North Carolina. Tropical Storm Gordon moved inland along the Florida Panhandle on September 4, bringing heavy rain to Pensacola, FL and northwest into much of Alabama. Pensacola, FL received 18.25 inches (464 mm) of rain for the month, 12.27 inches (312 mm) wetter than normal; of that, 6.40 inches (163 mm) fell on September 5 alone as a feeder band from Gordon brought hours of rain to the station. The rainfall total from Gordon in Pensacola was 12.73 inches (323 mm). In Alabama, the highest rainfall from Gordon was 8.53 inches (217 mm) north of Bay Minette in the southeast part of the state. The strongest winds from Tropical Storm Gordon were reported at Dauphin Island, AL (74 mph; 33 m/s), Mobile, AL (57 mph; 25 m/s), and Pensacola, FL (52 mph; 23 m/s) on September 4, as the center of circulation approached the coast. Hurricane Florence (Extreme #7) approached the North Carolina coast on September 13 as a strong hurricane but weakened to a Category 1 storm before making landfall on the 14th, and the most severe impacts of the storm came from the 10-foot storm surge followed by the extreme impacts of more than 30 inches (762 mm) of rain across a large portion of southeastern North Carolina. At one point, more than a dozen river gauges in North Carolina alone had reached major flood stage, and portions of I-40 and I-95 were both closed due to the flooding. In New Bern, NC, storm surge from Florence damaged or destroyed more than 4,300 homes and 300 businesses, resulting in a loss of $100 million in combined residential and commercial damage. The North Carolina Division of Public Safety reported that 5,214 people and 1,067 animals were rescued from the high waters. Hurricane Michael (Extreme #8) made landfall near Mexico Beach, FL on October 10 as a Category 4 hurricane, and moved northeast across the Florida panhandle and southwest Georgia. It was still a hurricane when it was south of Macon in central Georgia on the 11th. Widespread damage occurred from Michael as the center of circulation passed over the Southeast. Hurricane Michael attained peak winds of 155 mph (69.3 m/s), as it made landfall near Mexico Beach, FL on October 10, becoming the first system to do so in the region as a Category 4 hurricane. A maximum wind gust of 129 mph (57.7 m/s) was measured at Tyndall Air Force Base near the point of landfall. Catastrophic damage occurred along the Florida coast at Mexico Beach and Panama Beach due to the extreme winds and storm surge. The 9 to 14 feet (2.7 to 4.3 m), storm surge wiped out nearly every structure along the coast near the point of landfall. The highest gust reported in Georgia was 115 mph (51.4 m/s) by a University of Georgia weather station at the Donalsonville airport. Michael moved rapidly across South and North Carolina and parts of Virginia, as it began it transition to an extra-tropical cyclone. At least 60 deaths were attributed to Michael in the United States alone. Utility companies estimated that over 3.1 million people were affected by loss of power due to the storm, with a peak outage of 1.6 million customers early in the morning of October 12.
- There were 3,621 reports of severe weather in 2018 across the region, which is 122 percent of the average of 2,948 for the period from 2000-2017. A third of the reports (1,220, compared to an average of 721) came from June alone. The total number of tornadoes confirmed in 2018 was 167, which is 109 percent of the average value of 153 from 2000-2017. All but three of the tornadoes were rated EF-2 or lower. The season got off to a slow start in January and February, with less than half of the average number of severe reports occurring in each of those months. The number of reports in January (20, with one tornado and the rest damaging winds) was the lowest number in that month since 2004. In spite of the low total number of severe weather reports, February had 13 confirmed tornadoes, almost double the average number (7). On March 4th through the 7th, a powerful cyclone situated over the Northwest Atlantic Ocean generated exceptionally large swells with waves of 25 to 30 feet in height along the coastline of Puerto Rico and the U.S. Virgin Islands, which are located about 1,500 miles away. Coastal flooding caused significant beach erosion and damaged numerous structures along the northern and western coast of Puerto Rico. The largest hail reported in the Southeast in 2018 occurred in March and April. Hail accounted for nearly 45 percent (99 of 227) of the severe weather reports during March, including nine reports of 2-inch (i.e., hen egg-sized) or larger hailstones. On March 19th, extremely large hail with diameters ranging from 2.75 inches (baseball-sized) to more than 4 inches (softball-sized) caused extensive damage and destruction to homes, businesses, and vehicles across Cullman County, AL. An exceptionally large hailstone found in the community of Walter measured 5.38 inches (137 mm) in diameter, with a circumference of 13.75 inches (349 mm) and a weight of 9.8 ounces (0.26 kg) (Extreme #9). This is officially the largest hailstone on record for the state of Alabama, surpassing the old record of 4.5 inches (114 mm). On March 19th, an EF-3 tornado tracked over 35 miles from Calhoun County in northeastern Alabama to Haralson County in northwestern Georgia, with a maximum path width exceeding one mile and four reported injuries. The greatest damage occurred in the city of Jacksonville, AL, where many homes were rendered uninhabitable and several buildings on the campus of Jacksonville State University sustained major damage. In April, three reports of large hail were recorded, including 3-inch (tea cup-sized) hail in St. Johns County, FL on the 10th and 2.75-inch (baseball-sized) hail in Gaston County, NC on the 15th. In June, about 95 percent (1,154 of 1,220) of the severe weather reports during the month were for strong thunderstorm winds, and nearly half (556 of 1,154) of these reports occurred in Georgia and South Carolina. Some of the highest thunderstorm wind gusts that were recorded during the month included 70 mph at Shaw Air Force Base near Sumter, SC and 69 mph at North Perry Airport near Hollywood, FL. Thunderstorm winds were responsible for 2 fatalities and 9 injuries in Alabama and Georgia, with most of these casualties caused by falling trees. On April 15, an EF-3 tornado tracked across portions of three counties in central Virginia, including the western portion of Lynchburg. Hundreds of trees were snapped or uprooted, and dozens of homes sustained major damage or destruction along its 25.8-mile (42 km) path, with at least 12 reported injuries. On June 28th, a southward-moving derecho produced a 300-mile (190-km) swath of wind damage, extending from northern Alabama and northwestern Georgia to the Gulf of Mexico along the Florida Panhandle. Some of the highest measured wind gusts included 58 mph at Birmingham-Shuttlesworth International Airport, AL and 52 mph at Tuscaloosa Regional Airport, AL, and Falcon Field in Peachtree City, GA. Hundreds of trees were blown down across these areas, with 1 fatality and 2 injuries caused by trees falling onto moving vehicles in central Alabama. In Madison County, AL, straight-line winds estimated at 100 mph snapped a 300-yard-wide swath of trees near the town of Gurley. A total of 231,000 customers lost power in Alabama following the derecho. Twelve people were injured at Traditions Park near Hayden AL on August 16, when a large tent collapsed on a crowd of approximately 150 people. The tent collapse occurred even though winds were estimated to be below severe limits and no other damage was reported in the vicinity. On December 2, an EF-3 tornado caused four injuries at Kings Bay Naval Base in Camden County, GA along the coast. A docked Coast Guard vessel reported a wind gust of 144 mph from the storm, as it passed near the coast.
- 2018 began with a broad area of moderate drought (D1) and abnormally dry conditions (D0) covering significant parts of every state in the region except for the Florida peninsula and the coastal plains of North and South Carolina. During January, drought expanded and worsened due to relatively dry conditions, particularly in southwestern Georgia, southeastern Alabama, and parts of the Florida panhandle. Severe drought (D2) spread to northern Alabama and Georgia and covered the entire Florida panhandle during that time. Near the end of January, 80 percent of the region was covered by drought or abnormally dry conditions, and an area of extreme drought (D3) was identified in central Alabama on January 30 before wetter conditions improved soil moisture in that area, eliminating the worst drought conditions. In contrast, heavier rain in the Carolinas and Virginia reduced drought conditions in those areas. Colder than normal temperatures in January caused minor damage to citrus crops, Vidalia onions and other vegetables, and stunted the growth of winter grains and pastures. However, it provided ample chill hours for fruit crops like nuts and peaches and built up cold tolerance in citrus orchards as well as killing off insect pests that had survived the previous two warmer winters. By mid-February, heavier precipitation eliminated all severe drought (D2) from the region, in spite of record-setting warm conditions. The very warm conditions (as much as 10 degrees F or 5.5 degrees C) led to early blooming of fruit trees and blueberries, making them vulnerable to frost. Heavier rain in the month caused problems for farmers in Alabama, Georgia, North Carolina and Virginia who were delayed in preparation of fields for planting due to the wet soil. The February warmth did contribute to the development of new regions of severe (D2) drought beginning in early March in southeastern Georgia and in early April in southern Florida, regions that were missed by the rain that soaked Alabama and northwestern Georgia as well as North and South Carolina and Virginia. These moderate drought areas persisted until mid-May, when a wet spell across the region removed all drought and most abnormally dry conditions from the region. Colder and drier conditions in March and April caused further delays in field preparation and planting of row crops and led to several episodes of sub-freezing temperatures, which damaged blossoming fruit in several states (Extreme #10). About 10 to 50 percent of the flowering blossoms on peach trees in northern and central Georgia were lost to excessively cold temperatures. However, 2018's yield was higher than the past two years because the early frosts did less damage this year compared to the two previous winters. Moderate damage to the blueberry crop in southern Georgia was also reported, particularly in farms lacking frost protection. Dry conditions in early May improved field conditions for farmers, allowing them to catch up with planting and field work and reducing disease pressure. However, the rain that occurred later in the month caused flooding which damaged livestock pastures in southern Florida and drowned newly planted crops in low-lying areas. Wet conditions in June and July continued to cause problems for agricultural producers by delaying needed spraying of agricultural chemicals like fungicides, which were sorely needed in the humid conditions. For the rest of the year, drought conditions covered a much lower percentage of the region, mainly in coastal Georgia and southern South Carolina. Impacts on agriculture in the fall were dominated by the effects of the tropical systems, which passed through the Southeast. Tropical Storm Gordon caused losses for cotton, pecan and peanut farmers in southeastern Alabama and western Florida. Hurricane Florence, which dropped excessive rains over parts of North and South Carolina, caused significant impacts to vegetable production and flooded out numerous hog farms and chicken houses. In South Carolina, agricultural losses alone were estimated to surpass $125 million, including an estimated loss of 75 percent of the cotton crop ($56 million). In North Carolina, estimated losses to agricultural alone top $1.1 billion. Losses to row crops such as corn, soybeans and tobacco were estimated at $987 million, including 50 to 100 percent of unharvested tobacco. Other losses include $70 million to commercial forests, $30 million for lawn and landscaping, $27 million for vegetables and horticultural crops, and $23 million for livestock. The storm killed an estimated 5,500 hogs and 4.1 million chickens and turkeys. In all, the damage from Hurricane Florence was estimated at $18 billion. In October, Hurricane Michael caused tremendous damage to timber and decimated the Georgia cotton crop, which was just beginning to be harvested. Numerous pecan orchards, some of which had been planted nearly a century ago, were destroyed by the high winds. Georgia was the worst hit state in the Southeast, with an estimated $4 billion in agricultural losses. Losses in Alabama were estimated at $204 million, led by losses in cotton at $108 million. Florida's agricultural losses were estimated at $1 to 2 billion, including the loss of over 3 million acres of timber valued at $1.3 billion and crop losses of $158 million. Cotton along the path of the storm in Florida was considered nearly a total loss. Peanuts fared better than other crops since they were still in the ground in many fields. A new region of moderate drought (D1) developed in southern Florida in early November and was expanding at year's end. By the end of the year, the Florida drought covered 21 percent of the state, including the eastern half of the Florida peninsula stretching from the Everglades to Cape Canaveral. The dry conditions impacted planting of vegetables in that area and reduced the growth of pastures, leading to increased feeding of hay to livestock. In Puerto Rico, no abnormally dry conditions were observed in January through May, but returned to the island during the second half of the year. No drought was observed in Puerto Rico until the very end of the year when a small area of moderate drought (D1) developed in the central part of the island.
- For more information, please go to the Southeast Regional Climate Center Home Page.
High Plains Region: (Information provided by the High Plains Regional Climate Center )
- 2018 was a tale of extremes across the High Plains, as the region experienced both sides of the temperature and precipitation spectrums. In northern and eastern areas of the High Plains, it was cool and wet, which brought a variety of positive and negative impacts. For instance, this pattern was welcome in the Northern Plains where long-term drought conditions improved dramatically, but the constant wetness brought flooding and challenges to agriculture. In western areas of the High Plains, drought persisted throughout the year, causing a devastating fire season, low water supplies, recreation and tourism revenue loss, and damage to crops and pastures. Thankfully, winter came early this year in this part of the region, and mountain snowpack got off to a promising start. Winter conditions in 2018 were partially influenced by a weak La Niña, which contributed to the cold conditions in the Northern Plains, as well as the high snowpack in the Northern Rockies and the low snowpack in the Southern Rockies.
- Despite unfavorable conditions for agriculture in the region, row crops did especially well. For instance, Nebraska and South Dakota had record-high corn and soybean yields. Although cold and wet conditions brought about a late start to the growing season, the warmth of May and June helped Growing Degree Days (GDDs) accumulate very quickly, allowing for rapid progress in crop growth. Corn matured early and was less impacted than soybeans by the unfavorable harvest conditions during the fall. Additionally, early crop maturation reduced the risk for damaging fall freezes. Soybean harvest was very slow in the High Plains; in fact, it was the slowest soybean harvest on record nationwide, a record that goes back to 1995. The winter wheat crop struggled in Kansas and Colorado during winter 2018-18 due to a number of factors, including the presence of drought conditions and the lack of snow cover during cold air outbreaks. As of the end of the year, this season's crop was faring much better in Colorado, thanks to timely precipitation. However, approximately 65 percent of the winter wheat crop in Kansas was planted late due to wet conditions, and it was not faring well.
- Temperatures were below normal for the year across the northern part of the High Plains region, while temperatures were above normal in Colorado and southern Wyoming. The period January-April was very cold for the Northern Plains. However, temperatures turned around dramatically in May, as May and June were especially warm. The warmth was beneficial for crop progress because the cold start to the growing season caused crop growth to fall behind, while the warmth of May and June allowed crop growth to progress quickly. In fact, it was so warm in May and June that corn matured early in some places. Below-normal temperatures returned in July, and in the Northern Plains, cooler temperatures stuck around until December. On the other hand, above-normal temperatures dominated the year throughout Colorado and southern Wyoming until October.
-
The following locations had notable temperature records during 2018:
- Aberdeen, South Dakota: Lowest April temperature on record at -6.0 degrees F (-21.1 degrees C), April 4 (period of record 1893-2019)
- Pierre, South Dakota: Lowest April temperature on record at 0.0 degrees F (-17.8 degrees C), April 4 (period of record 1933-2019)
- Concordia, Kansas: Lowest April temperature on record at 12.0 degrees F (-11.1 degrees C), April 7 (period of record 1885-2019)
- Dodge City, Kansas: Most number of days with temperatures reaching 90.0 degrees F (32.2 degrees C) in May (15) (period of record 1874-2019)
- Salina, Kansas: Most number of days with temperatures reaching 90.0 degrees F (32.2 degrees C) in May (15) (period of record 1948-2019)
- Denver, Colorado: Tied for highest June temperature on record at 105.0 degrees F (40.6 degrees C), June 28 (period of record 1872-2019)
- It was a wet year for a large part of the High Plains, especially throughout southern South Dakota, Nebraska, and Kansas. The excessive wetness resulted in the wettest year on record for several locations, creating flooding issues and delays during the growing season. On the contrary, it was a dry year for Colorado and southern Wyoming, where drought was present throughout most of the year. While precipitation varied across the region each month, October and December were most notable for being wet, particularly in Nebraska and Kansas. While it was consistently dry across Colorado and areas of Wyoming throughout the year, there were no months that were particularly notable for widespread dryness.
- The snowpack was plentiful in the Upper Missouri Basin during the 2018-18 season, which contributed to high runoff and streamflows in the spring. However, Colorado snowpack was abysmal, causing a shortened ski season and concerns over water supply. As for Plains snowpack, snowfall was plentiful in the Northern Plains, particularly in South Dakota and Nebraska. The following locations ranked in the top 10 for snowiest season (July 2018-June 2018): North Platte, NE (5th snowiest), Sioux Falls, SD (5th snowiest), Pierre, SD (10th snowiest), and Rapid City, SD (10th snowiest). Snowfall was scarce throughout Colorado and parts of Kansas, however. Locations ranking in the top 10 for least snowiest season included: Alamosa, CO (least snowiest), Dodge City, KS (3rd least snowiest), Pueblo, CO (4th least snowiest), Denver, CO (5th least snowiest), and Grand Junction, CO (tied for 5th least snowiest). This season's snowpack started off quite well across the High Plains, thanks to cool temperatures and early-season snowfall.
- Due to a cold and snowy start to spring, the severe weather season got off to a slow start but ramped up after the late-spring warmup. Numerous hail events damaged crops throughout the region, and some unusual events occurred as well. For instance, in June, a tornado touched down near Gillette, Wyoming and destroyed numerous structures, snapped trees and utility poles, and caused two injuries. This tornado was rated an EF-3 on the Enhanced Fujita Scale. According to records from the National Centers for Environmental Information (NCEI), the last time a tornado of this strength was reported in Wyoming was 1987. Also in June, strong winds kicked up dirt and dust over dry areas of northeastern South Dakota and produced a dust storm, reducing visibilities and causing traffic issues and damage to vegetation.
-
The following locations had notable precipitation records during 2018:
- Wichita, Kansas: Longest streak of no measurable snow at 393 days, ended January 14 (period of record 1888-2019)
- Wichita, Kansas: Longest streak of no measurable snow at 393 days, ended January 14 (period of record 1888-2019)
- Omaha, Nebraska: 2nd highest 2-day total precipitation of 8.33 inches (212 mm) in any month, August 14-15 (period of record 1871-2019)
- Wichita, Kansas: Earliest measurable snow of 0.7 inches (2 cm), October 14 (period of record 1888-2019)
- The big story regarding drought in the region in 2018 was the improvement of conditions in the Northern Plains and the development and intensification of drought in Colorado, Wyoming, and Kansas. According to the U.S. Drought Monitor, over the course of the year the area in the High Plains experiencing drought or abnormal dryness (D0-D4) decreased from approximately 81 percent to 32 percent. However, areas experiencing moderate to exceptional drought (D1-D4) only decreased from 28 percent to 18 percent.
- The Northern Plains drought, which plagued the region in 2018, improved significantly during 2018 thanks to the wet conditions that dominated for much of the year. By the end of December, the only drought that remained was moderate drought (D1) in north-central North Dakota.
- On the other hand, drought intensified in Colorado, southern Wyoming, and portions of Kansas during the first three-quarters of the year. In Kansas, drought developed in southwestern and northeastern areas of the state, prompting the governor to make drought declarations in multiple counties. Fortunately, heavy rainfall provided drought relief during the summer to southwestern Kansas and southeastern Colorado, and heavy rains in the fall alleviated drought in northeastern Kansas. Drought remained in Colorado, however, despite some improvements due to a good start to the water year and the mountain snowpack season. While the drought caused many impacts, perhaps the most notable was the devastating fire season across Colorado.
-
Noteworthy Events:
- Cold Start to the Year: The High Plains had a very cold start to the year, with monthly temperatures averaging below normal for a large portion of the region through April. The early spring cold delayed planting, particularly in the Northern Plains, as soils remained frozen. Ultimately, the High Plains was the only region in the U.S. with below-normal temperatures for the year.
- Heavy Rainfall: It was a wet year for much of the High Plains, with several locations in South Dakota, Nebraska, and Kansas having their wettest or near-wettest year on record. Locations such as Brookings, South Dakota and Manhattan, Kansas experienced impactful urban flooding events, and melting snow caused flooding along the Big Sioux River in eastern South Dakota, impacting the Flandreau Indian Reservation. However, heavy rains helped improve long-term drought conditions throughout the Northern Plains.
- High Runoff in the Upper Missouri Basin: A strong snowpack year followed by heavy spring rains and a rapid warmup in May ultimately led to the 3rd highest runoff ever recorded in the Upper Missouri Basin, according to the U.S. Army Corps of Engineers. High runoff prompted the Corps to slowly evacuate stored floodwaters throughout the summer and fall, causing flows downstream to run high, especially in South Dakota and Nebraska.
- Colorado/Kansas Drought: Drought developed and intensified rapidly during the year throughout Colorado and portions of Kansas, damaging crops and compromising water supplies. While wet conditions during the summer and fall alleviated the drought in Kansas, drought remained in Colorado, which had its warmest and 2nd driest water year on record (October 2018-September 2018). It was a devastating fire season across the state, with the most notable being the Spring Creek Fire, which burned 100,000+ acres and was the 3rd largest wildfire in Colorado history.
- Crop Damage from Hailstorms: The cold temperatures at the beginning of spring brought about a slow start to the severe weather season. However, by June, severe weather ramped up across the region, mostly in the form of damaging hail events. For instance, during the last week of June, two hailstorms decimated corn and soybean fields in South Dakota between Rapid City and Pierre, leaving hail scars on the landscape.
- Unfavorable Conditions for Planting/Harvesting: Cold conditions in the spring and wet conditions throughout the growing season created unfavorable conditions for planting and harvesting. April brought frigid temperatures and snowstorms, delaying planting. Wet conditions in the fall, including early snowstorms in October, significantly slowed harvest progress. Nationwide, it was the slowest soybean harvest on record, dating back to 1995.
- For more information, please go to the High Plains Regional Climate Center Home Page.
Southern Region: (Information provided by the Southern Regional Climate Center)
- The year 2018 proved to be a warm year for the Southern Region. Temperatures were consistently above normal throughout most of the year. There were four months where all six states averaged above normal temperatures. These months were May, June, July, and September. There were also three months were all six states averaged below normal temperatures. These months were January, April, and November. For the year there were areas in all six states that averaged between 2 to 3 degrees F (1.11 to 1.67 degrees C) above normal, and small areas in Texas and Louisiana averaged 3 to 4 degrees F (1.67 to 2.22 degrees C) above normal. There were scattered areas of below normal temperatures across Texas, Oklahoma, Arkansas, Louisiana, and Mississippi, with a couple of areas in Texas that averaged 1 to 2 degrees F (0.56 to 1.11 degrees C) below normal. All state rankings are based on the period spanning 1895-2018.
- The 2018 annual precipitation totals indicate that precipitation for the year varied spatially over the Southern Region, but the values do not provide a clear picture of how precipitation varied temporally over the year. The year started drier than normal for all six states, immediately followed by every state except for Texas reporting a top-10 wettest February on record. March and April were around normal, with most states reporting wetter than normal conditions. However, the period from May through July saw states experiencing drier than normal conditions. In August, the pattern shifted, and most states reported wetter than normal conditions to close out the year. There were two months where all six states reported wetter than normal conditions (February and September) and one month where all six states reported drier than normal conditions (January). While no state reported a top-10 driest month on record, three states (Arkansas, Tennessee, and Texas) recorded a wettest month on record. By the end of the year, the area experiencing drought or abnormally dry conditions decreased from just under 69 percent of the region down to just over 12 percent of the region. All state rankings are based on the period spanning 1895-2018.
-
Severe Weather and Impacts:
- Winter was warmer and wetter than normal for the Southern Region. Every state experienced a wetter than normal winter, with Arkansas reporting its fourth-wettest winter on record. Temperatures were warmer than normal for every state except for Arkansas, which reported a slightly cooler than normal winter. December 2017 was predominantly warmer than normal, with only Tennessee reporting cooler than normal temperatures, but precipitation varied. Arkansas, Mississippi, and Texas were wetter than normal, while Louisiana, Oklahoma, and Tennessee were drier than normal. As a result, the region as a whole was slightly drier than normal. January was cooler and drier than normal across all six states. February saw the region experience its wettest February on record, as every state except for Texas experienced a top-10 wettest February on record. Arkansas and Tennessee reported their wettest February on record, Mississippi reported their second-wettest February on record, Oklahoma reported their fourth-wettest February on record, and Louisiana reported their seventh-wettest February on record. Temperatures were warmer than normal across much of the region, with only Oklahoma reported a cooler than normal February. Tennessee reported their third-warmest February on record, while Louisiana and Mississippi both reported their fourth-wettest February on record. All state rankings are based on the period spanning 1895-2018.
- Spring was warmer and drier than normal for the Southern Region. Every state experienced warmer than normal temperatures, with Texas recording their ninth-warmest spring on record. Every state except Tennessee reported drier than normal conditions. March was mainly warmer and wetter than normal, with Tennessee reporting cooler than normal temperatures and Oklahoma reporting drier than normal conditions. April was much cooler than normal, with every state except Texas reporting a top-5 coldest April on record and the region as a whole reporting their fourth-coldest April on record. Oklahoma reported their second-coldest, Arkansas and Mississippi reported their third-coldest, Tennessee reported their fourth-coldest, and Louisiana reported their fifth-coldest April on record. Precipitation was predominately wetter than normal, with Oklahoma and Texas reporting drier than normal conditions. May saw a shift in these conditions, as every state was much warmer than normal and every state except Tennessee was drier than normal. Arkansas and Oklahoma recorded their warmest May on record, as did the region as a whole. Tennessee and Texas recorded their second-warmest May on record, while Louisiana and Mississippi recorded their third and fourth-wettest May on record, respectively. All state rankings are based on the period spanning 1895-2018.
- Summer was warmer and drier than normal for the Southern Region. Every state reported warmer than normal temperatures, with Texas reporting their fifth warmest summer on record. Precipitation was wetter than normal for most states, with Louisiana and Texas reporting drier than normal conditions. June was warmer than normal for every state. The region recorded their tenth-driest June on record, while Texas (third-warmest), Louisiana (eighth-warmest), Arkansas (ninth-warmest), and Oklahoma (tenth-warmest) each reported a top-10 warmest June on record. Precipitation was predominantly drier than normal, with only Tennessee reporting wetter than normal conditions. July followed a similar pattern, with each state reporting warmer than normal temperatures and each state except for one (Oklahoma) reporting drier than normal conditions. August saw each state but one (Louisiana) report wetter than normal conditions, while every state but two (Arkansas and Oklahoma) reported warmer than normal temperatures. Arkansas reported their eighth-wettest August on record. All state rankings are based on the period spanning 1895-2018.
- Autumn was wetter and slightly warmer than normal for the Southern Region. The region reported their fifth-wettest autumn on record as Louisiana (ninth-wettest), Oklahoma (ninth-wettest), Tennessee (ninth-wettest) and Texas (first-wettest) each recorded a top-10 wettest autumn on record. Temperatures varied spatially, as three states (Louisiana, Mississippi, and Tennessee) reported warmer than normal conditions while the other three states (Arkansas, Oklahoma, and Texas) reported cooler than normal conditions. September saw each state in the region report warmer than normal and wetter than normal conditions. With respect to temperature, Tennessee (sixth-warmest), Mississippi (seventh-warmest), and Louisiana (tenth-warmest) each recorded a top-10 warmest September on record. With respect to precipitation, Texas (first-wettest), Tennessee (third-wettest), Louisiana (tenth-wettest), and Mississippi (tenth-wettest) each recorded a top-10 wettest September on record, and the region as a whole recorded their third-wettest September on record. October was predominantly wetter and warmer than normal. Every state except one (Mississippi) reported wetter than normal conditions, with Texas recording their second consecutive wettest month on record and Oklahoma (seventh-wettest) record a top-10 wettest October on record. Temperatures were warmer than normal across every state but two (Oklahoma and Texas). November saw a shift in temperatures as every state reported cooler than normal conditions, with Arkansas (seventh-coldest) and Oklahoma (ninth-coldest) recording a top-10 coldest November on record. Precipitation was still mainly wetter than normal, with Oklahoma and Texas reporting drier than normal conditions.
- Drought conditions exhibited a cyclical pattern throughout the Southern Region during 2018. Almost 70 percent of the region was experiencing drought or abnormally dry conditions at the beginning of the year. These conditions deteriorated through winter until almost 85 percent of the region was experiencing drought or abnormally dry conditions by the beginning of February. Spring saw a decrease in the area experiencing drought or abnormally dry conditions, but areas experiencing exceptional drought increased, with a peak of just over 5.5 percent areal coverage in early May. Due to the drier than normal condition in late spring and much of summer, drought and abnormally dry conditions spread, peaking in early August when over 70 percent of the region was experiencing at least abnormally dry conditions. When August and much of autumn saw wetter than normal conditions, drought improved across the region to the point where, by late November, less than 3 percent of the region was experiencing drought or abnormally dry conditions. However, drought conditions would slightly deteriorate through December, and by the end of the year, just over 12 percent of the region was experiencing mainly abnormally dry conditions. Overall, from the beginning of the year to the end of the year, the region saw marked improvement in drought conditions, but it was not a continuous process.
- There were approximately 3,925 severe weather reports throughout the Southern Region for 2018, with 283 tornado reports, 1,000 hail reports, and 2,642 wind reports. Louisiana had the most tornado reports (86) while Texas had the most hail (508) and wind (589) reports. Texas had the most severe weather reports total (1149) while Louisiana had the least (380).
- For more information, please go to the Southern Regional Climate Center Home Page.
Western Region: (Information provided by the Western Region Climate Center)
- Average temperatures in 2018 were slightly above normal in the Pacific Northwest, cooler than normal in the inland Northwest, and well above normal across the Southwest. Montana and northern Wyoming observed much wetter than normal conditions. With the exception of a few areas in Arizona and the northern Great Basin, the Southwest was drier than normal. Oregon also reported below normal precipitation.
- Cooler than normal temperatures dominated along the northern tier of the region in the first few months of 2018 and again in the autumn season, resulting in below normal annual temperatures. In north-central Montana, Havre reported an average temperature of 43.4 F (6.4 C), 2.5 F (1.4 C) above normal and the 10th coolest calendar year since records began in 1961. Outside of Montana, northern Idaho, and northern Wyoming, temperatures were slightly to well above normal. Many locations in the Southwest reported top-10 warmest calendar years. Average temperature in Las Vegas, Nevada, was 72.2 F (22.3 C), 2.5 F (1.4 C) above normal and the 2nd warmest since records began in 1948. Further south, Tucson, Arizona, had its 4th warmest year in a 73-year record at 71.8 F (22.1 C), 2.4 F (1.3 C) above normal.
- Above normal precipitation was observed throughout Montana as well as southern Arizona and parts of the western Great Basin. Billings, Montana, reported its 7th wettest year in an 84-year record at 19.01 in, 139% of normal. Reno, Nevada, reported 9.26 in (235 mm), 125% of normal. Further south, Tucson, Arizona logged 13.44 in, 116% of normal. Elsewhere, drier than normal conditions dominated, especially in western Oregon and the Four Corners area. Eugene, Oregon, had one of its bottom-10 driest years on record at 27.86 in, 60% of normal. In northwestern New Mexico, Farmington reported 4.32 in (110 mm), 39% of normal the 2nd driest year since records began in 1941. This year began with 9% of the West in severe or worse drought according to the US Drought Monitor but expanded to 27% by year's end. The areas seeing the greatest change were the Four Corners region and Oregon. Drought conditions present during the preceding five years persisted throughout 2018 in southern California due to below normal precipitation and above normal temperatures in the area. Drought conditions improved this year across eastern Montana as well as the southern portions of Arizona and New Mexico.
- Snowpack was well below normal during January and February in the Sierra Nevada, Cascades, and southern Rocky Mountains. At the end of February, snowpack was less than 60% of normal in nearly all basins in this region. However, an active storm track in March featuring several atmospheric rivers delivered above normal precipitation to a wide swath of the West stretching from central California northeastward to western Montana. These storms increased snowpack in the Sierra Nevada; April 1 values (typically peak of snowpack) exceeded 75% of normal in nearly all Sierra Basins. In contrast, well above normal snowpack developed early in the season in the northern Cascades, Inland Northwest, and northern Rockies and increased or maintained through the season. April 1 snowpack was 106% of normal averaged across the Pacific Northwest basins, and 115% of normal for the Missouri River basin. The Upper Colorado reported 74% of normal. The above normal snowpack in the Northwest led snowmelt flooding in these areas in the spring. The snow season beginning late 2018 ended the calendar year >75% of normal across the West.
- Calendar year temperatures were above normal across Alaska, with the greatest departures from normal in the northern and western portions of the state with temperatures closer to normal in the Southeast. In the northwestern part of the state, Kotzebue reported its 2nd warmest year since records began in 1897 29.5 F (-1.4 C), 6.8 F (3.8 C) above normal; temperatures were above normal for every month of 2018. Precipitation was near normal in the western part of the state and slightly to well above normal in the North Slope, Interior, and Southcentral regions. Drier than normal conditions dominated in the Southeast, leading to development of moderate drought conditions over the course of the year. Ketchikan logged 106.59 in (2707 mm) for the year, 75% of normal. Further south, several hurricanes as well as cool season storms in early 2018 contributed to wetter than normal conditions across much of Hawaii. Hilo reported its 3rd wettest year since records began in 1949 at 176.36 in (4479 mm), 139% of normal. Further northwest in the state, Lihue, Kauai recorded 51.95 in (1319 mm) and 140% of normal, the 14th wettest in a 69-year record. Large areas of the state saw improvements through the course of the year. At year's end, abnormally dry to moderate drought conditions were present on the leeward side of all Hawaiian Islands.
-
Significant Events of 2018:
- January 9: Deadly post-wildfire debris flow in Montecito, California: Soils were burned at moderate to high severity during December's Thomas Fire in the mountains above the communities of Montecito and Carpinteria. This resulted in water repellant soil conditions that produce much higher runoff rates than unburned areas. A band of intense precipitation in an otherwise moderate storm produced rain rates as high as 0.6 in (15 mm) in 5 minutes. Runoff from this intense precipitation scoured ash, boulders, soil, and burned vegetation from the steep channels, producing a debris flow that killed 21 people and destroyed over 100 homes.
- January and February: Low snowpack impacts on Sierra Nevada, New Mexico, Colorado Ski Resorts: Vail Resorts, a large resort operator, reported that visitation and retail sales are down approximately 10% this season through the first week of January. Many resorts have scaled back operations due to the low snowpack and have not been able to open all terrain. In northern New Mexico, Taos has only 25 of 111 runs open at the end of January. The lack of snow throughout February caused downhill and cross-country ski areas to close early or fail to open for the season. On February 21 the Yosemite Ski and Snowboard Area in the Sierra Nevada determined there would not be is enough snow to open the resort during the 2018-18 season. Throughout February, Royal Gorge Cross Country Ski Area near Lake Tahoe, the largest cross-country resort in North America, was unable to open due to a lack of snow. Shasta Ski Park in northern California had to temporarily close due to a lack of snow and warm weather. Ski Apache in New Mexico has only recorded 37 inches of snow for the season and a local business noted sales are down 75%.
- April 14-15: Heavy rainfall caused major flooding and landslides on the island of Kauai, Hawaii: A rain gauge in Waipa on Kauai's North Shore reported 49.69 in (1262 mm) of rain in a 24-hour period. This total is under consideration for the United States 24-hour rainfall record. The heavy precipitation resulted in landslides that closed the Kuhio Highway, the main roadway along the North Shore. Floodwaters damaged or destroyed homes, businesses, and roads and and hundreds of people had to be rescued. Many people are cut off from their jobs or cannot work due to business closure and decrease in tourism following the event.
- April-November: Wildfire impacts across the West: April, May: Early start to fire season in Arizona, Utah: Dry winter and early spring conditions as well as above normal temperatures and high winds supported an early start to Arizona's primary fire season, which typically begins in late May. The Tinder Fire was ignited on April 27, destroyed 33 homes and burned over 16,000 acres (6475 hectares). In southwestern Utah, officials declared the fire season as beginning on May 16, two weeks earlier than is usual. A dry winter and spring combined with windy conditions have dried out vegetation, creating fire hazard.
- July: In northern California, the Carr Fire was ignited on July 23 and burned over 230,000 acres (93,000 ha) and destroyed over 1600 structures and caused 8 deaths. In southwestern Oregon, the Taylor Creek Fire was started by lightning on July 15 and has burned over 53,000 acres (21,000 ha). By the end of July, the Washington State Department of Natural Resources had responded to over 900 fires in 2018, compared to 853 in all of 2018. However, most of these fires were contained while relatively small.
- August: The Mendocino Complex Fire in northern California became the largest in the state's history at over 451,000 acres (182,5000 hectares). In northern Nevada, the Sugarloaf Fire was ignited by a lightning strike on August 17 and burned over 232,000 acres (93,900 hectares).
- September: In northern California, the Delta fire started on September 5 and burned over 60,000 acres (24,281 hectares) and destroyed 20 structures. In northeast Nevada the Range 2 Fire began on September 30th in the Ruby Mountains and has burned over 9,000 acres (3,642 hectares). The Lamoille Canyon area of the Ruby Mountains is a popular tourist destination for camping, hiking, fishing, and other outdoor activities and remains closed until further notice.
- November: Devastating wildfires in California: The Camp Fire in Butte County, northern California, was ignited November 8 and became, by far, the most destructive wildfire in California history. The fire impacted the town of Paradise, resulting in 85 deaths and 18,804 structures destroyed. During the same wind event, in southern California, the Woolsey Fire burned over 96,000 acres (39,000 ha), destroyed 1,500 structures, and resulted in three deaths.
Air quality impacts: Smoke from the various wildfires this year reduced air quality throughout large areas of the West, with notable impacts in central and northern California, western Nevada, and southern Oregon. In some cases, such as during November's Camp Fire, periods of poor air quality were prolonged and impacted heavily populated areas (San Francisco Bay Area). - Mid-April through May: Snowmelt flooding in northern/central Montana, Northwest: In April, floodwaters washed out roads, inundated fields, and prompted evacuations from threatened homes. The Governor declared a flood emergency in seven counties. In May, with a period of above normal temperatures and, in some cases, compounded by above normal May precipitation, resulted in further flooding and prompted Montana's governor to declare a statewide flood emergency. In Missoula, over 60 homes were evacuated along the Clark Fork River, which reached major flood stage for the first time since 1981. North-central Washington also experienced snowmelt flooding in May, notably along the Okanogan River. On May 10, the Washington governor declared a State of Emergency for 20 central and eastern Washington counties.
- July Mid-month: Monsoon-related flash flooding in Southwest: Flash floods damaged homes and farmland in central and southern Utah. On July 13th, thunderstorms resulted in debris flows and derailing of a freight train, leading to multiple hours of road closure on US Highway 95 near the California-Nevada border. Roughly 20 homes were damaged by flash floods on July 15 in the small town of San Antonio, New Mexico.
- August 22-26: Hurricane Lane impacts Hawaii: Hurricane Lane weakened to a Category 3 or less as it approached and tracked southwest of the state. Lane caused flooding across the Hawaii as well as landslides, washed out roads, widespread road closures, and downed powerlines due to high winds. Strong winds caused a brush fire to spread rapidly near Lahaina, Maui, damaging or destroying over 20 homes.
- September All Month: Widespread drought impacts agriculture in Utah: For the first time in ten years an emergency meeting of the Utah Drought Review and Reporting Committee was called to investigate the potential need for an emergency declaration across the state. Many farmers in southern Utah have run out of surface water. Pasture and range conditions are some of the worst in the country with 71% of the grazable land in poor or very poor condition according to the Climate Prediction Center.
- October 1-3: Thunderstorms associated with remnants of Hurricane Rosa cause flooding, damage in Arizona: At least two people died in Arizona due to flash flooding associated with this storm. A 30-ft section of Highway 89 near Cameron, Arizona collapsed, resulting in one death. The collapse prompted the Navajo Nation to declare a state of emergency, as the highway serves several of its communities.
- Early October: Hurricane Walaka impacts Northwestern Hawaiian Islands: Category 5 Hurricane Walaka resulted in the submersion of a small, uninhabited sandy island known as East Island. The area is part of Papahanaumokuakea Marine National Monument and serves as a refuge for endangered species.
- For more information, please go to the Western Regional Climate Center Home Page.