National Overview:

Supplemental August/summer 2018 Information
- Regional autumn extremes
- August, summer and year-to-date county maps
- Summer record setters
- Summer station temperature ranks
- Summer station precipitation ranks
- Year-to-date station temperature evolution
- Year-to-date station precipitation evolution
- Climate Highlights — August
 August Average Temperature Departures |
 August Percent of Average Precipitation |
Temperature
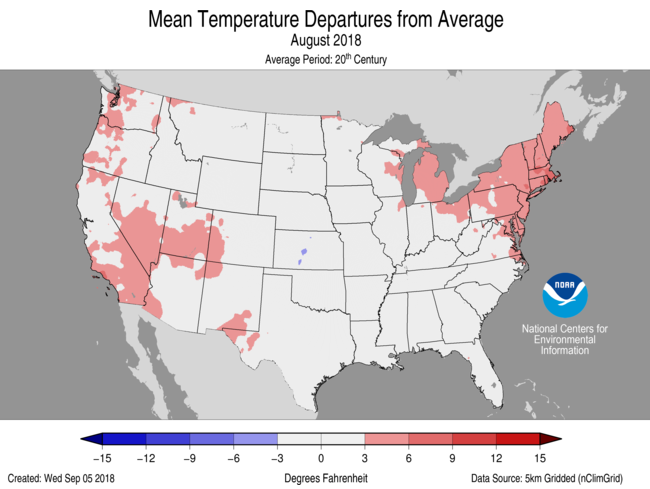
- For August, the average contiguous U.S. temperature was 73.6°F, 1.5°F above the 20th century average and the 17th warmest on record.
- Above-average August temperatures were observed along both coasts. Five states in the Northeast – Connecticut, Delaware, Massachusetts, New Hampshire and Rhode Island – each had a record warm August with six additional states in the region having a top 10 warm August. The record and near-record warmth across the Northeast was driven largely by record warm overnight low temperatures. Four states in the Southwest also had a top 10 warm month.
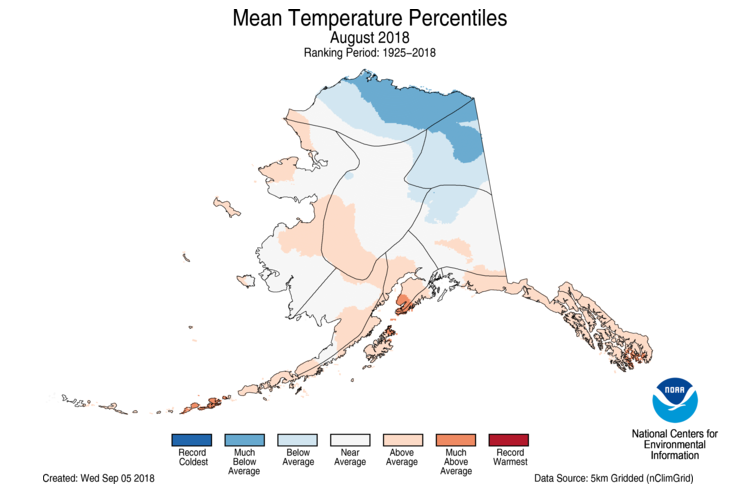
- Near- to below-average conditions were present in the Plains and parts of the Southeast. Kansas and Nebraska were both cooler than average. To the north, parts of Alaska were much cooler than average in August. Barrow (Utqia'vik) had its coldest August since 2006.
- The contiguous U.S. average maximum (daytime) temperature during August was 86.0°F, 0.9°F above the 20th century average, ranking in the warmest third of the historical record. Above-average maximum temperatures were observed across the West and from the Midwest to Northeast. Below-average maximum temperatures stretched from the Central and Southern Plains to the Southeast.
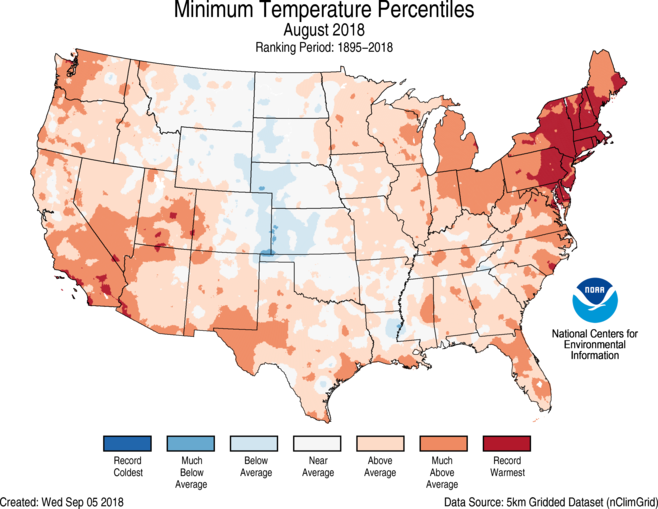
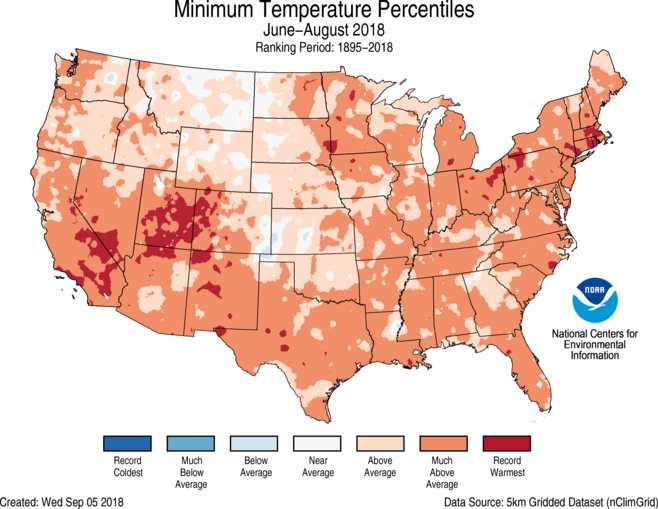
- The contiguous U.S. average minimum (nighttime) temperature during August was 61.1°F, 2.1°F above the 20th century average, marking the ninth warmest value on record. Much-above-average maximum temperatures were observed across the Southwest and in the Northeast. Eleven states from Maryland to Maine had record warm minimum temperatures. Near-average conditions were observed across the Rockies and Great Plains.
- During August there were 4,079 record warm daily high (1,320) and low (2,759) temperature records, which was more than two times the 1,741 record cold daily high (1,233) and low (508) temperature records.
- Based on NOAA's Residential Energy Demand Temperature Index (REDTI), the contiguous U.S. temperature-related energy demand during August was nearly twice the long-term average and was the seventh highest value on record.

August 2018 Statewide Temperature Ranks
Precipitation

August 2018 Statewide Precipitation Ranks
- The August precipitation total for the contiguous U.S. was 2.99 inches, 0.37 inch above average, and tied as the 20th wettest August in the 124-year period of record.
- Above-average precipitation was observed for many locations from the Great Plains to the East Coast where slow-moving weather systems dropped heavy rainfall. Eight states from the Lower Mississippi Valley to New England had much wetter than average conditions with record precipitation in parts of the Midwest and Mid-Atlantic. Alaska had its fourth wettest August on record. No state was record wet.
- Below-average precipitation stretched from the West Coast to Rockies with California tying its 10th driest August on record. Across the West, several large and destructive wildfires, including many that began earlier in the summer, burned in August. Monsoonal moisture helped to boost precipitation totals for localized areas in the Southwest.
- In late August, Hurricane Lane skirted to the southwest of the Hawaiian Islands. The storm brought heavy rainfall and strong winds across the state. Significant flooding was observed on the east side of the Big Island, with preliminary reports of more than 50 inches of precipitation. Ongoing drought in the state combined with strong winds from Lane fanned a wildfire that destroyed more than 20 homes on Maui.
- According to the August 28 U.S. Drought Monitor report, 34.4 percent of the contiguous U.S. was in drought, up slightly from 34.1 percent at the end of July. Drought conditions improved in parts of the Southwest, Central to Southern Plains, Deep South and Northeast. Drought conditions worsened in parts of the Northwest, Northern Plains, mid-Mississippi Valley, central Great Lakes and southern Texas. Drought only improved slightly in Hawaii with many of the drought-stricken parts of the state missing out on the heavy rains from Lane.
- Climate Highlights — summer (June-August)
 June-August Average Temperature Departures |
 June-August Percent of Average Precipitation |
Temperature
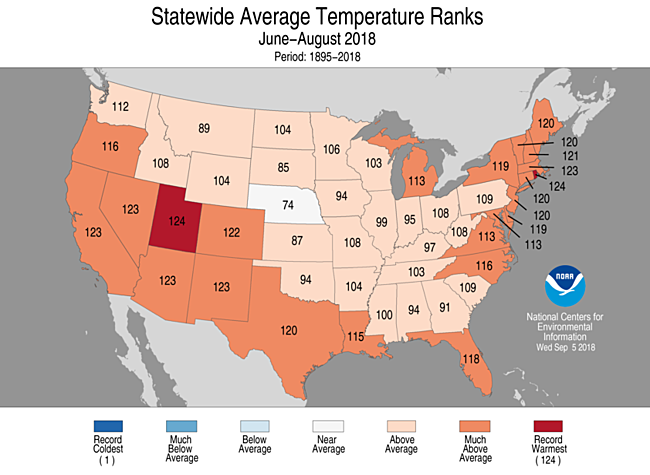
- During meteorological summer (June-August), the average temperature for the Lower 48 was 73.5°F, 2.1°F above average, tying with 1934 as the fourth warmest summer on record.
- Above-average summer temperatures spanned most of the nation, with only one state having near-average June-August temperatures. Twenty-three states across the West, South and Northeast had much-above-average summer temperatures. This included Rhode Island and Utah, which were record warm.
June-August Statewide Temperature Ranks
- The contiguous U.S. average maximum (daytime) temperature during summer was 86.1°F, 1.8°F above the 20th century average, ranking as the 11th warmest on record. Much-above-average maximum temperatures were observed across the West, Southern Plains and Northeast. Near-average conditions were observed for the Central Plains, Midwest, Southeast, and Mid-Atlantic.
- The nationally averaged minimum temperature (overnight lows) was exceptionally warm during summer at 60.9°F, 2.5°F above average and 0.1°F warmer than the previous record set in 2016. Every state had an above-average summer minimum temperature with five states record warm. In general, since records began in 1895, summer overnight low temperatures are warming at a rate nearly twice as fast as afternoon high temperatures for the U.S. and the 10 warmest summer minimum temperatures have all occurred since 2002.
- Based on NOAA's Residential Energy Demand Temperature Index (REDTI), the contiguous U.S. temperature-related energy demand during August was 125 percent above average and was the fourth highest value on record.
Precipitation
- The summer precipitation total for the contiguous U.S. was 8.95 inches, 0.63 inch above average, and was the 25th wettest summer in the 124-year period of record.
- Above-average precipitation was observed for many locations from the Great Plains to the East Coast, with much-above-average precipitation in parts of the Midwest and Mid-Atlantic. Pennsylvania had its wettest summer on record with 18.78 inches of precipitation, 6.56 inches above average. This surpassed the previous record of 17.78 inches in 1928.
- Below-average precipitation was observed for much of the West and parts of the South. Washington State had its 11th driest summer on record receiving about half the seasonal average. Monsoonal moisture helped to boost local precipitation in parts of the Southwest, but the region overall was drier than average.

June-August Statewide Precipitation Ranks
Extremes
- The U.S. Climate Extremes Index (USCEI) for the year-to-date was 55 percent above average and ranked as the ninth highest value in the 109-year period of record. This was also the highest summer USCEI since 2012. On the national scale, extremes in warm minimum (record high) and maximum temperatures (14th highest), the spatial extent of dry conditions (16th highest) and one-day precipitation totals (2nd highest) were much above average.
- On the regional scale, the Southwest had a record high CEI value for the summer, while the West had its fifth highest and the Northeast had its seventh highest.
- Climate Highlights — year-to-date (January-August)
 Jan-August Average Temperature Departures |
 Jan-August Percent of Average Precipitation |
Temperature
- Above-average year-to-date temperatures were observed for much of the nation with record warmth in the Southwest. Arizona and New Mexico each had their warmest January-August on record. Near- to below-average temperatures were observed in the Northern Plains and Upper Midwest. Afternoon high temperatures were particularly cooler than average for the Northern Plains.
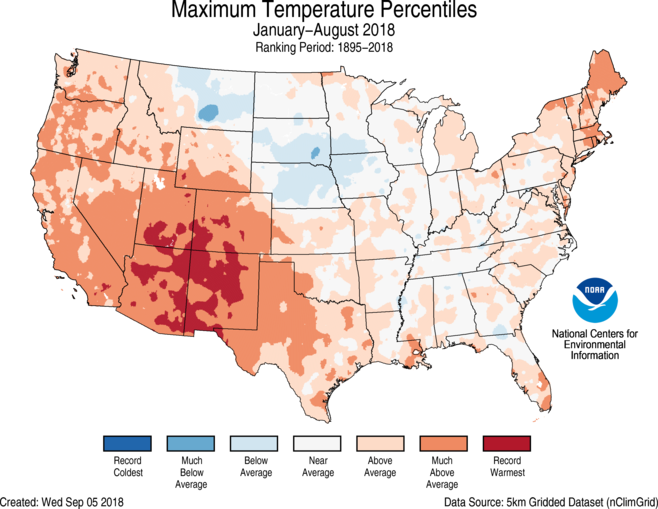
- The contiguous U.S. average maximum (daytime) temperature during January-August was 67.8°F, 1.8°F above the 20th century average, ranking as the 11th warmest on record. Much-above-average maximum temperatures were observed across the West, Southern Plains and Northeast. Arizona and New Mexico each had a record warm year-to-date maximum temperatures. Below-average conditions were observed for the Central Plains and Northern Plains.
- The contiguous U.S. average minimum (nighttime) temperature during January-August was 43.6°F, 1.8°F above the 20th century average, also ranking as the 11th warmest on record. Much-above-average maximum temperatures were observed across the West, Southern Plains and along the East Coast. Arizona set a record warm year-to-date minimum temperature. Near-average conditions were observed for the Central Plains and Northern Plains.
- Based on NOAA's Residential Energy Demand Temperature Index (REDTI), the contiguous U.S. temperature-related energy demand during August was 15 percent above average and ranked near the median value in the 124-year period of record.
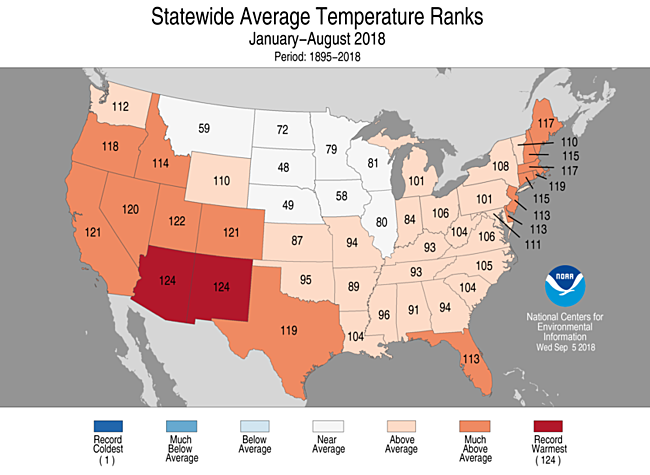
Jan-August Statewide Temperature Ranks
Precipitation
- The January-August precipitation total for the contiguous U.S. was 21.67 inches, 0.96 inch above average, and ranked among the wettest third of the historical record.
- Above-average January-August precipitation stretched across the Northern Plains, Upper Midwest and from the Southeast to Mid-Atlantic. Maryland and Pennsylvania each had their wettest year-to-date on record. Below-average precipitation fell across parts of the West and Southern Plains. Colorado and New Mexico were both much drier than average.

Jan-August Statewide Precipitation Ranks
Extremes
- The U.S. Climate Extremes Index (USCEI) for the year-to-date was 45 percent above
- On the regional scale, the Southwest had a record high CEI value for the year to date.
Regional Highlights:
These regional summaries were provided by the six Regional Climate Centers and reflect conditions in their respective regions. These six regions differ spatially from the nine climatic regions of the National Centers for Environmental Information.
- Northeast Region: (Information provided by the Northeast Regional Climate Center)
- The Northeast experienced its second warmest August on record with an average temperature of 71.5 degrees F (21.9 degrees C), which was 3.3 degrees F (1.8 degrees C) above normal. All twelve states in the region recorded average temperatures this month that were above normal. New Hampshire, Massachusetts, Rhode Island, Connecticut, and Delaware each experienced a record-warm August, while Maine, Vermont, and New Jersey all had their second warmest August on record. Maryland experienced its third warmest August, followed by New York with its fourth warmest, and Pennsylvania recording its sixth warmest on record. Temperature departures for the month ranged from 4.7 degrees F (2.6 degrees C) above normal in Rhode Island to 1.4 degrees F (0.8 degrees C) above normal in West Virginia. This summer was also warmer than normal for all twelve states in the Northeast. With an average temperature of 69.3 degrees F (20.7 degrees C) for the region, this was the sixth warmest summer on record for the Northeast. Rhode Island experienced its warmest summer on record, with a temperature departure of 2.3 degrees F (1.3 degrees C) above normal for the season. Each state ranked this summer among their twenty warmest on record: Massachusetts, third warmest; Connecticut, New Jersey, Maine, New Hampshire, and Vermont, fifth warmest; Delaware and New York, sixth warmest; Maryland, 13th warmest; Pennsylvania, 16th warmest; and West Virginia, 18th warmest.
- The Northeast received 5.27 inches (133.9 mm) of precipitation on average this month, which was 135 percent of normal, ranking this as the 11th wettest August on record for the region. On average, Maine and Vermont were slightly drier than normal, but the other states in the region recorded a wetter-than-normal August. Pennsylvania ranked this as its ninth wettest August on record. It was the tenth wettest for New York, followed by the 11th wettest for Massachusetts, New Hampshire, and West Virginia. With an average of 15.06 inches (382.5 mm) of precipitation recorded for the region, this was the eighth wettest summer on record for the Northeast. After receiving an average of 18.78 inches (477.0 mm) of precipitation, this summer was the wettest on record for Pennsylvania. Maryland experienced its fourth wettest summer, and West Virginia had its seventh wettest summer on record. Summer precipitation departures ranged from 6.91 inches (175.5 mm) above normal in Maryland to 1.77 inches (45.0 mm) below normal in Rhode Island.
- Dry conditions improved across the Northeast as the month progressed. At the beginning of August, dry conditions were largely present in northern New York and New England. Abnormal dryness was impacting 18 percent of the Northeast, and 10 percent of the region was in moderate drought. Abnormal dryness eased in much of New Hampshire and southern Maine throughout the course of the month. By the end of August, 13 percent of the Northeast was abnormally dry and seven percent of the region was experiencing moderate drought.
- Heavy rain led to flooding in parts of Pennsylvania, New York, and New Jersey throughout this past month. On August 2, an EF-0 tornado touched down in Queens, New York, damaging a few homes and downing trees and power lines in its short path, but no injuries were reported. Severe weather moved through New England a few days later on August 4, resulting in minor damage from an EF-0 tornado that moved through in Windham County, Connecticut. Later that same day, an EF-1 tornado in Webster, Massachusetts led to structural damage downtown and displaced about 30 residents from their homes. These storms caused more than 9,000 customers to lose power. A line of strong thunderstorms moved across Long Island, New York on the night of August 7. Fallen trees damaged homes in Selden, New York and house fires were reported from lightning strikes associated with these powerful storms. Railroad services were suspended across parts of Long Island and more than 10,000 customers were without power that night. On August 13, Lakewood, New Jersey received 8.01 inches (203.5 mm) of rain, which led to the evacuation of over 100 homes in the Ocean County, New Jersey as flash flooding impacted the area. In Seneca County, New York, a similar sequence of events occurred during that same time frame. Hector, New York recorded 6.38 inches (162.1 mm) of rain from August 13-14 and then received another 5.15 inches (130.8 mm) during a 24-hour stretch ending August 15. Road closures were reported along coastal New Jersey and in southern New York that same week as rivers started to overflow their banks, prompting a state of emergency to be issued in many of those areas. The severe storms on August 15 caused a mandatory boil water order to be in effect for nine days and resulted in the cancellation of the Phish Festival in Watkins Glen, New York due to the unavailability of clean drinking water for the 30,000 people that were expected to attend. Flooding in Lancaster County, Pennsylvania on August 21 resulted in closed parks and roadways as streets became flooded. An EF-1 tornado touched down in Brockway, Pennsylvania that same day, and was on the ground for about four miles, but no injuries were reported.
- For more information, please go to the Northeast Regional Climate Center Home Page.
- Midwest Region: (Information provided by the Midwest Regional Climate Center)
- Precipitation in August was a mix of above and below normal rainfall. All nine Midwest states had areas with both above and below normal totals. The driest areas in August were in north central Minnesota where less than half the normal rain fell. Other areas with less than 75 percent of normal were in Minnesota, eastern Upper Michigan, and near the confluence of the Ohio and Wabash rivers at the southwestern tip of Indiana. Scattered pockets of rainfall more than two times normal were scattered across every Midwest state except Minnesota. Region wide, rainfall was 133 percent of normal with statewide totals of 89 percent in Minnesota and above normal values in the other eight states. Totals ranged from 128 percent of normal in Michigan to 152 percent of normal in Missouri. Very heavy rains fell on the 20th and 21st just to the west of Madison, Wisconsin with unofficial reports of 11 to 15 inches (279 to 381 mm) which would exceed the 24-hour record for the state. The Wisconsin record was set on June 24, 1946 near Mellen, Wisconsin with 11.72 inches (298 mm). Daily precipitation records were set over 500 times during August. Each state had at least 30 such records with 107 in Wisconsin, 95 in Iowa, and 88 in Illinois. Summer precipitation was also a mix of above and below normal values. Summer values ranged from just under 75 percent of normal to nearly twice normal.
- August temperatures were near normal in the western and southern portions of the region and slightly above normal in the northeastern sections. Temperatures averaged 2 to 4 degrees F (1 to 2 C) above normal in much of Lower Michigan and the northeastern half of Ohio. Minimum temperatures were above normal for much of the Midwest with only Iowa and northwestern Minnesota near normal for August. Minimum temperatures were 4 to 5 degrees F (2 to 3 C) above normal in parts of Lower Michigan and northeastern Ohio. There were few extreme temperatures, just 57 daily record high maximums and 46 record low minimums, but there were numerous record low maximums (439) and record high minimums (206) mostly in the last week of the month when heavy rains were falling.
- Drought in August was mainly focused on two regions. The first was Missouri and southeastern Iowa where extreme and exceptional drought were reported throughout August. The other region was in Lower Michigan where widespread moderate drought and even some severe drought were reported. Drought peaked in mid-August at just under 20 percent of the Midwest and over 80 percent of Missouri. In Missouri, extreme drought covered more than 25 percent of the state and exceptional drought covered more than 5 percent of the state. Rains late in August brought those numbers down slightly as the month came to a close.
- Flooding and flash flooding occurred at numerous locations throughout the month of August as heavy rains fell in numerous locations during August. Some of the worst flooding was in southern Wisconsin. There was possibly a Wisconsin state record for 24-hour precipitation set west of Madison on the 20th-21st and then heavy rains in the last week of the month across southern Wisconsin. Some areas were hit with rainfall totals that matched their normal totals of all of July and August in just a few days. There were evacuations, record flood stages, interrupted Amtrak services, cancelled classes, and six counties were declared in a state of emergency. Roads were closed for days due to flooding and some washouts. Lake Mendota and Lake Monona both had high water levels that led to flooding in Madison which caused at least $44 million in damages to public infrastructures.
- Tornadoes were reported in the Midwest on 13 days including clusters of reports on the 19th in southwestern Missouri and on the 28th in central Wisconsin. There were 17 confirmed tornadoes in Wisconsin on the 28th with the strongest rated as EF-2 on the enhanced Fujita scale. Damage to trees and agriculture was widespread but there were no reported fatalities or injuries. Hail was reported on 21 days in August and wind damage was reported on 25 days.
- For further details on the weather and climate events in the Midwest, see the weekly and monthly reports at the Midwest Climate Watch page.
- Southeast Region: (Information provided by the Southeast Regional Climate Center)
- Temperatures during August were near average (i.e. within 2 degree F (1.1 degrees C)) across most of the Southeast region, including Puerto Rico and the U.S. Virgin Islands. Temperatures were most above normal across far eastern Virginia and northeastern North Carolina, with observed temperatures 3-4 degrees F (1.7 to 2.2 degrees C) above normal. Cape Hatteras NC (1874-2018; tied for first warmest) reported a mean temperature of 82.2 F (27.9 C), 3.7 degrees F (2.1 degrees C) above normal. Norfolk VA (1871-2018; tied for fourth warmest) reported a mean monthly temperature of 81.0 F (27.2 C). Wallops Island/Chincoteague VA (1967-2018; tied for warmest) reported a mean temperature of 80.6 F (27.0 C) that was 5.1 degrees F (2.8 degrees C) above normal. The coolest temperatures in the Southeast were found in western Georgia and parts of Alabama, where frequent precipitation and clouds helped keep daytime temperatures low. Because of the humid conditions, maximum temperatures across the region were generally a little below average while minimum temperatures were slightly elevated, except in the areas with the warmest conditions in Virginia and North Carolina. Only six stations reported maximum temperatures ranked in the top three warmest in August compared to 13 locations, which reported average monthly minimum temperatures in the top three warmest. Fairhope AL (1917-2018; first coldest) reported a minimum temperature that was 3.5 degrees F (1.9 degrees C) below normal. The highest daily maximum temperature of 102 degrees F (38.9 degrees C) was reported at Columbia SC on August 30. No other station in the Southeast reported a temperature exceeding 100 F (37.8 degrees C) in August. Mount Mitchell NC reported the lowest daily temperature across the region during the month with 39 degrees F (3.9 degrees C) on the 23rd. These cool temperatures occurred in the wake of a cold frontal passage, which brought much-appreciated relief from the hot and humid conditions. Many stations in the Southeast observed their coldest temperatures of month during this period.
- Precipitation was highly variable across the Southeast in August, as is common during the summer. The driest areas included most of the Florida peninsula and South Carolina, and eastern Georgia. Dry conditions were also noted in far eastern Virginia and North Carolina, where the hottest conditions occurred, as noted above. Parts of the Georgia coast and northeastern South Carolina received less than 50% of their normal rainfall this month. The Key West FL International Airport (1948-2018; second driest) reported only 1.89 inches (48.0 mm) for the month, 2.49 inches (88.6 mm) below normal; the record of 1.20 inches (30.5 mm) was set in 2007. Manteo Airport (1966-2018; second driest) in far eastern North Carolina reported 1.90 inches (48.3 mm) for August, 4.74 inches (120.4 mm) below normal. Two other long-term stations in Brunswick GA and Andrews SC reported amounts that were the 5th driest for their locations. The areas that were most above normal in precipitation included the Appalachian Mountains, central North Carolina and Virginia, western Georgia, and eastern Alabama. Most of western North Carolina and Virginia as well as parts of western Georgia and southeastern Alabama reported amounts that were 150-300 percent of normal precipitation this month. In those areas, 21 long-term stations observed precipitation totals that were ranked within their five highest values on record. Murphy NC and Saltville VA both reported their wettest Augusts on record in stations with 50 or more years of data. Asheville NC reported 10.41 inches (264.4 mm), 6.01 inches (152.7 mm) above normal, their third wettest in 125 years of record. As is typical of August, localized heavy rainfall produced flash flooding across parts of the region. Thunderstorms that began on the evening of July 31 and continued into August 1 brought precipitation amounts of over 4 inches in a 24-hour period to Albemarle County in Virginia and surrounding counties. Flooding from the heavy downpours resulted in numerous water rescues from cars that drove through water-covered streets. On August 11, Naples FL reported 3.72 inches (94.5 mm) in thunderstorms that also brought a 63 mph (101 kilometers per hour) wind gust to the station. Atlanta GA received their 5th wettest one-day August rain with 3.61 inches (91.7 mm) on August 2 and Gainesville FL received 3.73 inches (mm) on August 23, their 7th wettest one-day August rain event. In general, the wettest periods were from August 1 to 4 and August 19 to 23 as strong cold fronts approached the area. The driest period occurred between August 24 and 29, as a strong ridge of high pressure was positioned over the area.
- There were 534 severe weather reports across the Southeast during August, which is 165 percent of the median monthly frequency of 323 reports during 2000-2016. At least one severe weather report was recorded in the region on 25 days during the month. Three small confirmed tornadoes were reported in all during August, two on the 1st of the month in Georgia and South Carolina, and one on the 2nd in Virginia, compared to a median number of eight for August based on 2000-2016 data. By far the most reports were from severe winds (506, or almost 95% of the total count). Wet soils from the rainy conditions in many parts of the region in July and early August likely promoted more tree fall and thus increasing the wind damage. A church steeple was blown off the Langley First Baptist Church in Burnettown SC on the afternoon of August 6 due to thunderstorm winds. On August 9, one person was injured when a tree fell on a home in Cottageville SC, during a strong evening thunderstorm. Twelve people were injured at Traditions Park near Hayden AL on August 16, when a large tent collapsed on a crowd of approximately 150 people. The tent collapse occurred even though winds were estimated to be below severe limits and no other damage was reported in the vicinity. On August 28, four mobile homes were damaged near Venice FL, due to straight lines winds just before midnight.
- Drought conditions (D1 and greater) were not observed across the Southeast region for the third consecutive month, though small pockets of abnormal dryness (D0) persisted across Alabama and grew slightly in the interior Carolinas. No abnormally dry conditions were identified in Georgia, Florida and Virginia this month except in part of Escambia County in the far western Panhandle of Florida. In Puerto Rico, abnormally dry conditions expanded from the south-central part of the island to cover more than half of Puerto Rico by the end of the month. Wet conditions, especially early in August, led to disease problems in many crops, particularly fungal diseases linked to the moist conditions. Wet soils in many parts of the Southeast kept producers from bringing heavy machinery into their fields, reducing their ability to spray and harvest and causing problems for some crops like soybeans, peanuts and alfalfa. Hay producers had trouble finding enough dry days to produce good quality hay. Grape growers in Georgia harvested some varieties early to reduce yield loss from rot caused by the humid conditions but were pleased by drier harvest conditions at the end of the month. Irrigation was in use in some of the drier regions of the Piedmont to help improve crop yields as their growing seasons drew to a close.
- For more information, please go to the Southeast Regional Climate Center Home Page.
- High Plains Region: (Information provided by the High Plains Regional Climate Center )
- Similar to July, August was rather cool across much of the High Plains region. While most areas saw only slightly below-normal temperatures, the Black Hills region of South Dakota experienced temperature departures exceeding 4.0 degrees F (2.2 degrees C) below normal. Despite below-normal temperatures in July and August, the warmth experienced in June led to near-normal summer temperatures on the whole. The notable exception was Colorado, where temperatures remained above normal for most of the summer. With widespread temperature departures of 2.0-4.0 degrees F (1.1-2.2 degrees C) above normal, several locations across the state had a top 10 warmest summer on record.
- Precipitation in August varied throughout the region. Portions of Nebraska and Kansas saw record-breaking rainfall and flooding, while much of the rest of the region was dry. As for summer precipitation, it also varied across the High Plains. An area of excessively wet conditions extended from the Black Hills region southward and eastward into Nebraska and central Kansas. Although streamflows ran high and flooding occurred in some locations, drought conditions significantly improved in parched areas. Meanwhile, much of Colorado and eastern Kansas experienced a very dry summer, and as a result, drought expanded and intensified and streamflows were especially low.
- Harvest is around the corner, and as of the end of August, row crops were generally in decent shape across the region. Corn was still on track to mature early due to the extreme warmth in the early part of the summer, which should minimize the risk for a damaging frost. As of August 1st, the U.S. Department of Agriculture was predicting record-high corn yields for South Dakota and Nebraska, and Nebraska was also predicted to have record-high soybean yields this year. However, flooded fields in parts of Kansas and Nebraska may slow harvest in these areas, and late-season crop diseases were detected. For instance, bacterial leaf streak disease was reported in corn in Nebraska and South Dakota.
- Much of the region experienced cooler temperatures in August. Temperatures ranged from approximately 1.0-3.0 degrees F (0.6-1.7 degrees C) below normal throughout Kansas, Nebraska, Wyoming, the western Dakotas, and eastern Colorado. The average temperature for August in Rapid City, South Dakota was 4.0 degrees F (2.2 degrees C) below normal, and Rapid City tied for its 6th coolest August on record. The western half of Colorado continued to be warm, with temperatures ranging from 1.0-3.0 degrees F (0.6-1.7 degrees C) above normal. However, the warmth was not record-breaking.
- Despite temperatures being below normal for the month as a whole, there were still several heat spells throughout the region. For instance, in mid-August, temperatures reached 100.0 degrees F (37.8 degrees C) on several days in western North Dakota and eastern Wyoming. On the 12th, the temperature reached 108.0 degrees F (42.2 degrees C) in Williston, North Dakota, which tied for its highest temperature ever recorded in August and 4th highest temperature ever recorded in any month.
- Summer temperatures varied across the region, but most areas experienced a warmer than normal summer season. The greatest departures occurred in western Colorado, with temperatures up to 5.0 degrees F (2.8 degrees C) above normal. Not coincidentally, this was also one of the driest areas in the High Plains this summer. Top 10 rankings for warmest summer on record in Colorado are as follows: Grand Junction (3rd), Alamosa (4th), Pueblo (tied for 6th), Colorado Springs (8th), and Denver (10th).
- Both wet and dry conditions were present across the High Plains in August. Wetter areas included northern Wyoming, eastern Nebraska, and much of Kansas. Omaha, Nebraska and Dodge City, Kansas had their 4th and 5th wettest Augusts on record, respectively. Meanwhile, dryness was prevalent throughout a large portion of the Dakotas, Colorado, western Nebraska, and southern Wyoming. Akron, Colorado only received 0.29 inches (7 mm) of precipitation and had its 7th driest August on record.
- Severe weather continued to impact the High Plains region in August. For instance, severe thunderstorms dropped large hail at least 2.0 inches (5 cm) in diameter across eastern Colorado and western Nebraska on the 6th. Colorado Springs, Colorado was hit especially hard, as large hail caused damage and injuries at the Cheyenne Mountain Zoo. The zoo's infrastructure was damaged, as well as vehicles parked there. Several people and animals were injured by falling hail, and a few animals were killed.
- Flooding occurred throughout portions of Kansas and Nebraska during August as well. On the 14th-15th, heavy rains caused flooding in southeast Kansas, prompting evacuations in Montgomery County. Unfortunately, two people died in their car after being swept away by floodwaters. On the 19th-20th, record rainfall and flooding occurred across Omaha, Nebraska. Two-day total precipitation was 8.33 inches (212 mm) at Eppley Airfield, which was the 2nd highest two-day total precipitation ever recorded in any month at this location.
- Topsoil moisture both improved and degraded across the region in August. Heavy rains replenished soil moisture in Nebraska and Kansas. However, dryness caused soil moisture depletion in North Dakota, South Dakota, and Wyoming. Statewide, Colorado experienced little change in soil moisture conditions in August.
- As for the summer season (June-August), several areas experienced record-breaking precipitation. The following locations had a top 10 wettest summer on record: Rapid City, South Dakota (2nd wettest), Sioux Falls, South Dakota (3rd wettest), Valentine, Nebraska (3rd wettest), McCook, Nebraska (10th wettest), Norfolk, Nebraska (10th wettest), and Omaha, Nebraska (10th wettest).
- Streamflows continued to vary across the High Plains during August. According to the U.S. Geological Survey, streamflows were much above normal throughout most of Nebraska, as well as western and southern South Dakota. The high streamflows were due to above-normal precipitation in July and August. Higher-than-average releases from all Missouri River Mainstem projects continued in August, and the U.S. Army Corps of Engineers announced that these releases will be maintained to prepare for the 2019 Missouri River runoff season. There will be a 10-day extension to navigation flow support on the Missouri River this year. Streamflows improved across portions of Kansas in August, thanks to welcomed precipitation. However, streamflows remained below normal in the northeastern part of the state. Low streamflows continued in western and central Colorado where there has been little drought relief.
- Despite some areas receiving relief, overall the area in drought or abnormal dryness (D0-D4) increased across the High Plains in August, according to the U.S. Drought Monitor. The greatest improvements occurred in eastern Colorado as well as portions of Kansas. A continuation of above-normal precipitation, much of which was due to the monsoon, brought additional relief to eastern Colorado in August, where exceptional drought (D4) and extreme drought (D3) were pulled back. August was a particularly wet month for parts of Kansas, as heavy rainfall events led to improvements in drought conditions in the southwestern, central, and southeastern portions of the state.
- Meanwhile, conditions continued to worsen in portions of the Dakotas, northwestern Colorado, southern and western Wyoming, and northeastern Kansas. While some of these areas experienced slightly above-normal precipitation in August, it was not enough to improve or maintain conditions, as July was very dry across these areas. Several impacts have been reported as a result of the drought. For instance, in eastern Kansas, an additional 22 counties were placed into a drought emergency, which brought the total number of counties in a drought emergency to 72. Several communities issued water-use restrictions, and corn was being cut for silage. In the Red River Valley of North Dakota, damage to soybean crops was reported. It is worth noting that drought conditions were present in North Dakota last summer, and lingering impacts may exacerbate issues caused by the current drought.
- For more information, please go to the High Plains Regional Climate Center Home Page.
- Southern Region: (Information provided by the Southern Regional Climate Center)
- Temperatures for the month of August varied spatially throughout the Southern Region. Parts of extreme northwestern Oklahoma and northwestern Arkansas experienced temperatures 3 to 4 degrees F (1.67 to 2.22 degrees C) below normal. Parts of northeastern, eastern, and northwestern Oklahoma; northwestern, western, central, northeastern, and southeastern Arkansas; western and southern Mississippi, northeastern Louisiana, and southwestern Texas experienced temperatures 2 to 3 degrees F (1.11 to 1.67 degrees C) below normal. Northern and southeastern Louisiana, eastern Mississippi, northwestern and part of southwestern Tennessee, southwestern Oklahoma, and much of Texas experienced temperatures 1 to 3 degrees F (0.56 to 1.67 degrees C) above normal. Far southern, southeastern, and far western Texas experienced temperatures 3 to 5 degrees F (1.67 to 2.78 degrees C) above normal. The statewide monthly average temperatures were as follows: Arkansas—78.80 degrees F (26.00 degrees C), Louisiana—82.10 degrees F (27.83 degrees C), Mississippi—80.40 degrees F (26.89 degrees C), Oklahoma—79.80 degrees F (26.56 degrees C), Tennessee—76.50 degrees F (24.72 degrees C), and Texas—83.10 degrees F (28.39 degrees C). The statewide temperature rankings for August were as follows: Arkansas (fifty-second coldest), Louisiana (forty-second warmest), Mississippi (fifty-fourth warmest), Oklahoma (forty-fifth coldest), Tennessee (fifty-first warmest), and Texas (thirty-third warmest). All state rankings are based on the period spanning 1895-2018.
- Precipitation values for the month of August varied spatially throughout the Southern Region. Parts of western and southern Texas received 5 percent or less of normal precipitation. Northern, northeastern, eastern, southeastern, southern, western, and central Texas; areas in southwestern and eastern Oklahoma, northern, central, and part of eastern Louisiana; southwestern Arkansas, southwestern Tennessee, and areas in northeastern and southwestern Mississippi received 50 percent or less of normal precipitation. In contrast, parts of western, southwestern, southern, central, and northeastern Texas; western, central, southern, southeastern, eastern, and northeastern Oklahoma; extreme southeastern Louisiana, most of Arkansas, southern, northwestern and northeastern Mississippi; and parts of western, northern, southeastern, and northeastern Tennessee received 150 percent or more of normal precipitation. Parts of northeastern Texas, eastern and northeastern Oklahoma, western, central, northeastern, and southeastern Arkansas; and part of northwestern Tennessee received 300 percent or more of normal precipitation. The state-wide precipitation totals for the month were as follows: Arkansas—6.40 inches (162.56 mm), Louisiana—4.46 inches (113.28 mm), Mississippi—4.64 inches (117.86 mm), Oklahoma—4.29 inches (108.97 mm), Tennessee—4.16 inches (105.66 mm), and Texas—2.23 inches (56.64 mm). The state precipitation rankings for August were as follows: Arkansas (eighth wettest), Louisiana (fifty-ninth driest), Mississippi (thirty-seventh wettest), Oklahoma (twentieth wettest), Tennessee (fifty-second wettest), and Texas (fifty-ninth wettest). All state rankings are based on the period spanning 1895-2018.
- At the end of August, exceptional drought conditions were present in southwestern Texas. Extreme drought classifications were present in southwestern and southern Oklahoma, southwestern, northern, central, and eastern Texas; and northwestern Louisiana. Severe drought classifications were present throughout parts of northern, central, southwestern, and northeastern Texas; southwestern and northeastern Oklahoma, southwestern Arkansas, and northwestern Louisiana. Moderate drought classification was present throughout extreme western, northern, central, southern, and eastern Texas; extreme western, southwestern, southeastern, and northeastern Oklahoma; southwestern and northwestern Arkansas, eastern, northwestern, and part of southwestern Louisiana; and parts of southwestern and northeastern Mississippi. There were no drought conditions in Tennessee.
- In August, there were a total of 251 storm reports across Texas, Oklahoma, Arkansas, Louisiana, Tennessee, and Mississippi. Oklahoma tallied the most wind (48) and hail (14) reports, while both Texas and Arkansas tallied the most tornado reports (2). Oklahoma tallied the most reports total (63) while Louisiana tallied the least (19).
- On August 1, 2018, a wind gust of 79 mph (127.14 kph) was reported near Umbarger, Texas.
- On August 7, 2018, two landspout tornadoes were reported near Groves, Texas and Klondike, Louisiana.
- On August 10, 2018, a wind gust of 70 mph (112.65 kph) was reported near Elk City, Oklahoma.
- On August 11, 2018, a landspout tornado was reported near Big Springs, Texas. No damage was reported.
- On August 13, 2018, a possible downburst in Madill, Oklahoma knocked two mobile homes off their foundations and scattered them roughly five feet. No injuries were reported.
- On August 14, 2018, tennis ball sized hail was reported near Pampa, Texas. Also, a wind gust of 67 mph (107.83 kph) was reported near Mangum, Oklahoma.
- On August 16, 2018, estimated wind gusts of 60-70 mph (96.56—112.65 kph) were reported in Springdale, Arkansas.
- On August 17, 2018, an EF-1 tornado was reported near Madison, Mississippi. This tornado reportedly caused a 97 mph (156.11 kph) wind gust at the Bruce Campbell Airport. No injuries were reported.
- On August 18, 2018, a wind gust of 72 mph (115.87 kph) was reported near Dell City, Texas.
- On August 19, 2018, a tornado was reported near Mazie, Oklahoma, destroying a barn and damaging multiple trees and buildings.
- On August 20, 2018, a tornado was reported near Walcott, Arkansas. A fatality was reported near Spearsville, Louisiana, after strong winds downed a tree on a mobile home. A wind gust of 76 mph (122.31 kph) was reported near Monroe, Louisiana.
- On August 21, 2018, a wind gust of 80 mph (128.75 kph) was reported near Keyes, Oklahoma.
- On August 25, 2018, a wind gust of 65 mph (104.61 kph) was reported near Amherst, Texas.
- On August 30, 2018, there were two reports of trees falling on houses in Elizabethton and Goodlettsville, Tennessee. No injuries were reported.
- For more information, please go to the Southern Regional Climate Center Home Page.
- Western Region: (Information provided by the Western Region Climate Center)
- Temperatures were near normal across much of the western US this month, though a few locations in the Southwest reported well above normal temperatures. Monsoon activity brought above normal precipitation to some areas of the Southwest; above normal precipitation was also observed along the Montana-Wyoming border.
- A few low-pressure systems moved across the West this month, helping to moderate temperatures. Across most of the region, temperatures were within 2 F (1.1 C) of August normals. Some areas of the Southwest experienced well above normal temperatures including southern California, southern Nevada, and southern Utah. Reno, Nevada, experienced its third warmest August in an 82-year record at 77.4 F (25.2 C), 4.2 F (2.3 C) above normal. On August 25, Reno ended a 56-day streak of days with a high temperature of 90+ F (32.2 C) the longest such streak on record. Temperatures were also much warmer than normal in portions of southern California. San Diego reported its warmest August since records began in 1939 at 78.1 F (25.6 C), 6.5 F (3.6 C) above normal. This is likely tied to the record sea surface temperatures observed at the Scripps Pier this month. On August 1, sea surface temperatures reached 78.6 F (25.9 C), surpassing the previous record of 78.4 F (25.8 C) set on July 30, 1931. Some areas of the Pacific Northwest also observed above normal temperatures. Seattle recorded an average temperature of 68.8 F (20.4 C), 2.7 F (1.5 C) above normal. This was the 5th warmest August at this location since records began in 1945. Persistent cloudiness and precipitation this month moderated temperatures in Montana, northern Wyoming, and eastern Idaho. Bozeman, Montana, reported an average of 64.6 F (18.1 C), 3.6 F (2 C) below normal.
- The coastal states as well as Nevada and Idaho generally received little to no precipitation, typical for August. However, some isolated areas in these regions that commonly see summertime thunderstorm development experienced above normal precipitation. Bodie, California, in the lee of the High Sierra, observed 3.27 in (83 mm), 726% of normal, due to thunderstorms on the first two days of the month. This was the wettest August for Bodie since records began in 1895. Many locations of western and central Arizona received above normal precipitation in association with an active Southwest Monsoon. Tempe, Arizona logged 2.61 in (66 mm), 192% of normal and the 9th wettest August since records began in 1948. In southern Utah, St George observed 1.4 in (36 mm), 184% of normal. Active weather brought near to well above normal precipitation to much of south-central Montana and northern Wyoming. Billings recorded 1.45 in (37 mm) total precipitation for the month, 193% of normal. A cold low-pressure system moved across the northern Rockies during the last week of August, bringing a few inches of wet snow to higher elevation locations. Drought conditions improved in small areas of southern Arizona, southern Utah, and eastern New Mexico in association with August precipitation in these areas. Drought conditions expanded in southern and eastern Oregon and portions of western Washington, and abnormally dry conditions were introduced in eastern Idaho.
- Hurricane Lane brought impressive precipitation across the State of Hawaii. A gauge at Mountain View on the eastern side of the Big Island reported 52.02 in (1321 mm) over the course of the storm. This total makes Hurricane Lane the second wettest tropical system to impact the U.S., behind Hurricane Harvey in 2017, where 60.58 in (1,539 mm) of rainfall was measured in Nederland, Texas. Many other records were set as well. Hilo, on the eastern side of the Big Island, reported its wettest 3-day period on record August 22-24 at 31.85 in (809 mm). The monthly total at Hilo was 49.03 in (1,245 mm), 493% of normal, setting a record for wettest August and 3rd wettest month of all-time. Records for Hilo began in 1949. Further north, temperatures across Alaska were generally near normal, though a few North Slope locations were much cooler than normal. Coleville Village had its coldest August in a relatively short (23 year) record at 37.8 F (3.2 C), 4.8 F (2.7 C) below normal. A few locations were warmer than normal, especially in the southeast. Yakutat observed an average temperature of 56.6 F (13.7 C), 2.8 F (1.6 C) above normal and the 4th warmest since records began in 1917. Precipitation was near to above normal across the state, except in the far Southeast. Fairbanks recorded 4.15 in (105 mm), 221% of normal and the 4th wettest August in a 90-year record. In the southwestern part of the state, King Salmon reported 5.45 in (138mm), 185% of normal and the 7th wettest since records began in 1917.
- All Month: Wildfire impacts across the West: The Mendocino Complex Fire in northern California became the largest in the state's history at over 451,000 acres (182,5000 hectares). A number of large fires continued to burn or were ignited in August in Oregon. The Taylor Creek and Klondike fires in the southwestern part of the state began in mid-July and have burned over 150,000 acres (60,702 hectares). In northern Nevada, the Sugarloaf Fire was ignited by a lightning strike on August 17 and burned over 232,000 acres (93,900 hectares). Western fires have caused significant and persistent air quality impacts locally, and smoke impacts have been reported as far east as the Midwest.
- Aug 22-26: Hurricane Lane impacts Hawaii: Hurricane Lane reached a maximum intensity of Category 5 to the southeast of Hawaii, and weakened to a Category 3 or less as it approached and tracked southwest of the state. Lane caused flooding across the Hawaii as well as landslides, washed out roads, widespread road closures, and downed powerlines due to high winds. Significant flooding was observed on the eastern side of the Big Island, where storm rainfall totals were highest. Strong winds caused a brush fire to spread rapidly near Lahaina, Maui, damaging or destroying over 20 homes. On Kauai, flooding impacted areas on the north side of the island still recovering from heavy rains in April. Impacts to the island of Oahu were minimal.
- For more information, please go to the Western Regional Climate Center Home Page.