National Overview:

- Climate Highlights — March
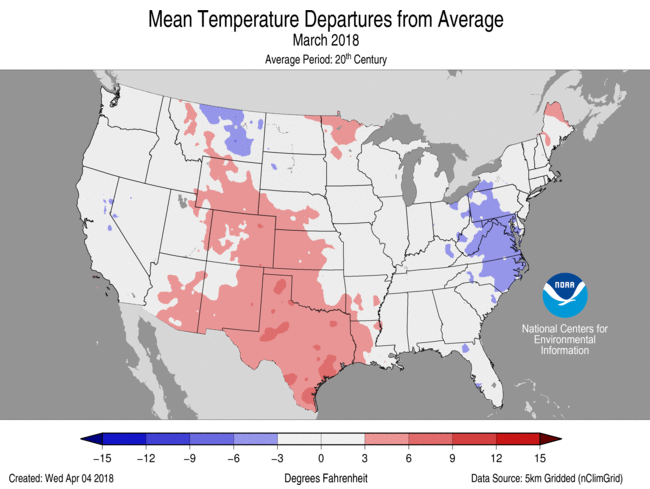 March Average Temperature Departures |
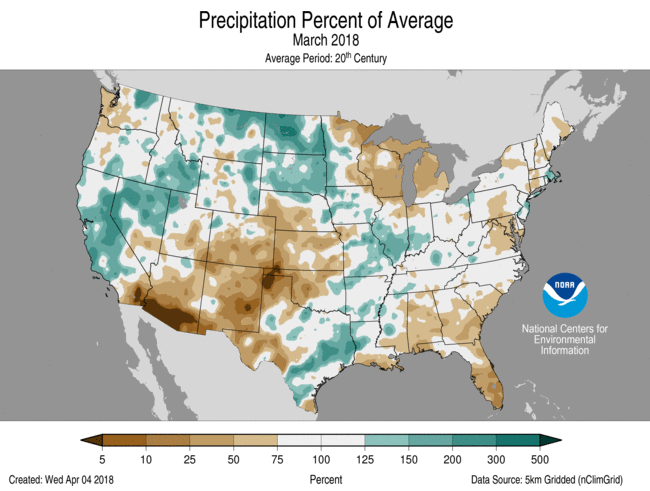 March Percent of Average Precipitation |
Temperature
- During March, the average contiguous U.S. temperature was 42.6°F, 1.1°F above the 20th century average. This ranked near the median value in the 124-year period of record.
- Below-average temperatures were observed along parts of the East Coast, Northern High Plains and West. In the East, the cooler-than-average March was preceded by a record and near-record warm February. Some locations observed March temperatures that were cooler than February, an unusual but not unprecedented occurrence.
- Above-average temperatures were observed across the south-central U.S., stretching from the Central Rockies through the Southwest and the Southern Plains. Above-average temperatures were also observed in parts of New England and the Upper Midwest.
- The contiguous U.S. average maximum (daytime) temperature during March was 53.9°F, 0.9°F above the 20th century average, ranking near the median value. Below-average maximum temperatures were observed across much of the East with much-below-average temperatures in the mid-Atlantic. Above-average maximum temperatures were observed in the Southwest, Central Rockies and Southern Plains.
- The contiguous U.S. average minimum (nighttime) temperature during March was 31.4°F, 1.4°F above the 20th century average, ranking in the warmest third of the record. Above-average conditions were observed in the Southwest, New England, and parts of the Rockies and Great Plains. Below-average minimum temperatures were observed across the East Coast from the Mid-Atlantic to Florida and for parts of the Northern High Plains and West.
- The Alaska March temperature was 17.7°F, 6.9°F above the long-term average. This tied the ninth warmest March in the 94-year period of record for the state. Northern and western Alaska were much warmer than average, with near-average temperatures in southern Alaska. Utqia'vik (Barrow) had its warmest March on record, while Kotzebue had its second warmest and St. Paul its third warmest.
- During March there were 1,515 record warm daily high (620) and low (985) temperature records, which was about 46 percent more than the 1,031 record cold daily high (663) and low (368) temperature records.
- Based on NOAA's Residential Energy Demand Temperature Index (REDTI), the contiguous U.S. temperature-related energy demand during March was 2 percent above average and ranked near the median value in the 124-year period of record.

March 2018 Statewide Temperature Ranks
Precipitation
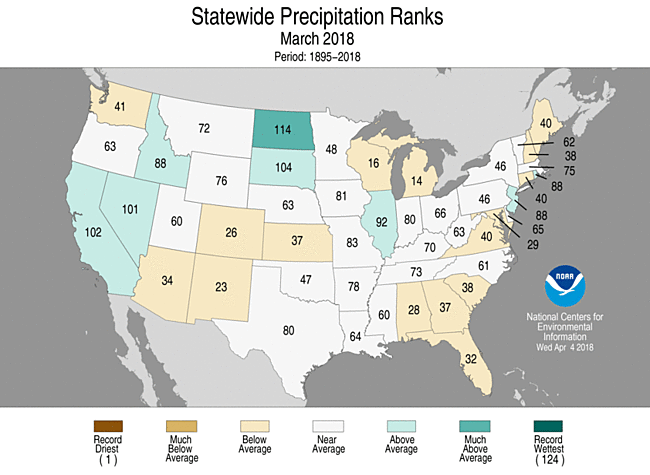
March 2018 Statewide Precipitation Ranks
- The March precipitation total for the contiguous U.S. was 2.42 inches, 0.09 inch below average, and ranked near the median value in the 124-year period of record.
- During March, four strong winter storms known as Nor’easters impacted the East, bringing heavy snow across parts of the Midwest and from the Southern Appalachians to New England. Some locations in the East had more snow during March than during the preceding winter months combined. Numerous locations had a top five March snowfall total during 2018, including Boston, Massachusetts; Albany, New York; and Philadelphia, Pennsylvania.
- Above-average precipitation was observed across parts of the West, Northern Rockies and Plains, Midwest and South. The beneficial precipitation helped to boost snowpack totals in parts of the Sierra Nevada, which were below-average during much of their wet season. However, snowpack totals remained below average in the region.
- Below-average precipitation was observed across parts of Northwest, Southwest, Great Lakes, Southeast and East Coast. The general lack of precipitation and above-average temperatures in the Southwest contributed to a continuation of very low snowpack in the Southern Rockies and parts of the Great Basin.
- According to the April 3 U.S. Drought Monitor report, 29.4 percent of the contiguous U.S. was in drought, down from 31.3 percent at the end of February. Drought conditions improved in California, the Northwest, Northern Plains, and parts of the Southern Plains, Mid-Mississippi Valley and interior Southeast. Drought conditions worsened across parts of the Southwest, Central Plains, southern Texas and the coastal Southeast. Drought also developed in the Alaska Panhandle due to several months of below-average precipitation.
- According to NOAA data analyzed by Rutgers Global Snow Lab, the March snow cover extent was 303,860 square miles above the 1981-2010 average and ranked as the sixth highest value in the 52-year period of record. This was the highest March snow cover extent since 1979. Above-average snow cover was observed across parts of the West, Northern Rockies, Northern Plains, Midwest and Northeast. Below-average snow cover was observed in parts of the Southern Rockies, Central Plains and Great Lakes.
- Climate Highlights — year-to-date (January-March)
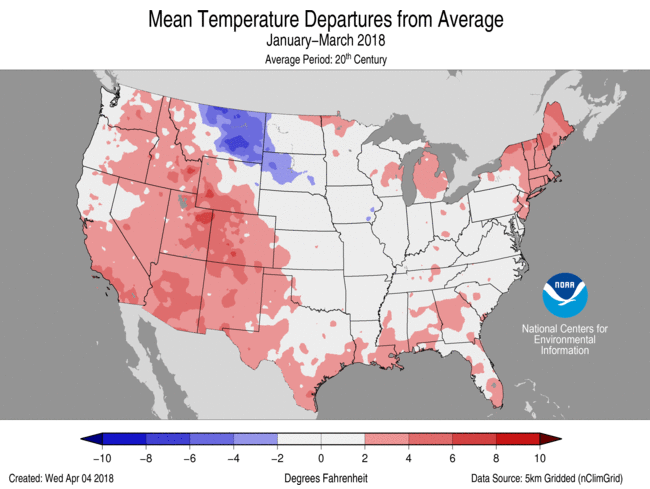 Jan-Mar Average Temperature Departures |
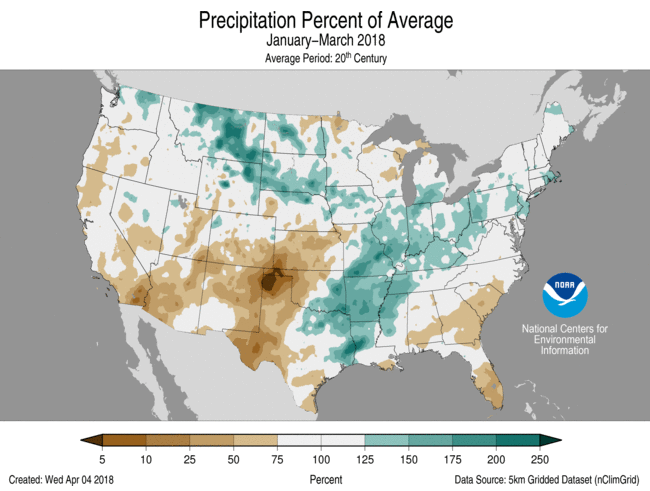 Jan-Mar Percent of Average Precipitation |
Temperature
- The year-to-date (January-March) average contiguous U.S. temperature was 36.8°F, 1.6°F above average, ranking among the warmest third of the record. This was the coldest start to a year since 2014 for the nation.
- Above-average temperatures were observed across much of the West, South and Northeast. Arizona, Maine and New Mexico each had a January-March temperature that ranked among the 10 warmest on record. Near-average conditions stretched from the Great Plains through the Midwest to Mid-Atlantic with below-average conditions in the Northern High Plains.
- The contiguous U.S. average maximum (daytime) temperature during January-March was 47.9°F, 1.8°F above the 20th century average, ranking in the warmest third of the historical record. Above-average conditions were observed across much of the West, Southern Plains, and parts of the Southeast, Midwest and Northeast. Below-average maximum temperature stretched from the Northern High Plains into parts of the Midwest.
- The contiguous U.S. average minimum (nighttime) temperature during January-March was 25.6°F, 1.4°F above the 20th century average, ranking in the warmest third of the record. Above-average conditions were observed across the West, Southeast and Northeast. Below-average conditions were observed in the Northern High Plains.
- The Alaska January-March temperature was 12.4°F, 6.5°F above the long-term average, the ninth warmest on record for the state. Record and near-record temperatures were observed across northern and western parts of the state with near-average conditions across southern Alaska and the panhandle. Utqia'vik (Barrow) had its warmest January-March on record, while St. Paul had its second warmest year to date.
- Based on REDTI, the contiguous U.S. temperature-related energy demand during January-March was 25 percent above average and the 26th lowest value on record.

Jan-Mar Statewide Temperature Ranks
Precipitation
- The year-to-date precipitation total was 7.13 inches, 0.17 inch above average, also ranking near the median value.
- Below-average precipitation was observed in the Southwest, the Southern High Plains, and the Southeast. Parts of the central and southern High Plains of southwest Kansas, northeast New Mexico and parts of the Oklahoma and Texas panhandles observed record dryness for the first three months of the year. Above-average precipitation was observed in the Northern Rockies and Plains, the Mid- to Lower-Mississippi Valley, the Ohio Valley and parts of the Northeast. Arkansas had hits fourth wettest January-March on record with 20.01 inches of precipitation, 7.48 inches above average.

Jan-Mar Statewide Precipitation Ranks
Extremes
- The U.S. Climate Extremes Index (USCEI) for the year-to-date was 30 percent below average and ranked near the median value in the 108-year period of record. Despite the below-average national value, there were elevated extremes in warm maximum temperatures and one-day precipitation totals. This was the lowest January-March CEI since 2013. The USCEI is an index that tracks extremes (falling in the upper or lower 10 percent of the record) in temperature, precipitation and drought across the contiguous United States.
- On the regional scale, the CEI in the Southwest ranked as the ninth highest value on record due to extremes in warm maximum and minimum temperatures, the spatial extent of dry conditions and one-day precipitation totals.
- Climate Highlights — cold season (October 2017-March 2018)
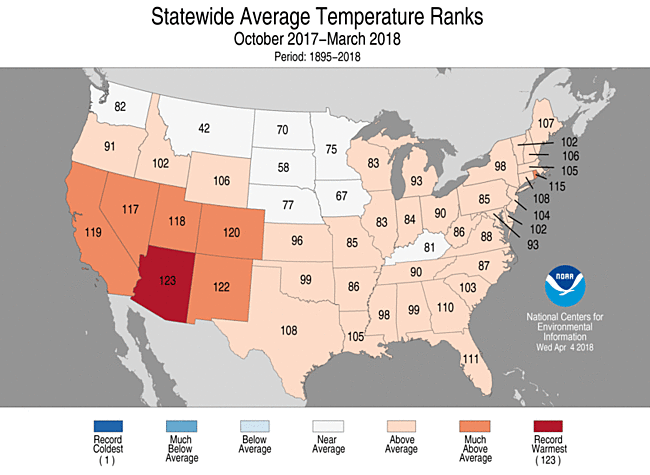
- The cold season (October-March) average contiguous U.S. temperature was 40.9°F, 1.9°F above average, the 16th warmest on record. This was the coolest cold season since 2014/15.
- Above-average temperatures were observed across much of the West, South, Midwest and along the East Coast. Arizona had its warmest cold season on record with a statewide average temperature of 52.6°F, 4.9°F above average. This bested the previous record of 52.4°F in 2014/15. Below-average temperatures were observed in the Northern High Plains of Montana.
- The contiguous U.S. average maximum (daytime) temperature during October-March was 52.2°F, 2.1°F above the 20th century average, the 11th warmest on record. Above-average conditions were observed across much of the West, Southern Plains, and parts of the Southeast, Midwest and Northeast. Record and near-record warm maximum temperatures were observed in the Southwest, where Arizona and New Mexico each had a record warm cold-season maximum temperature. Below-average maximum temperature stretched from the Northern High Plains into parts of the Midwest.
- The contiguous U.S. average minimum (nighttime) temperature during January-March was 29.6°F, 1.7°F above the 20th century average, ranking in the warmest third of the record. Above-average conditions were observed across parts of the West, Great Plains, and along the East with much-above-average conditions in the Southwest, Central Rockies and scattered locations across the East. Below-average minimum temperatures were observed in the Northern Plains.
- The Alaska October-March temperature was 16.9°F, 7.2°F above the long-term average, the third warmest on record for the state. Record and near-record temperatures were observed across western and northern Alaska with near-average conditiosn for the panhandle.
- Based on REDTI, the contiguous U.S. temperature-related energy demand during October-March was 35 percent below and was the 18th lowest on record.
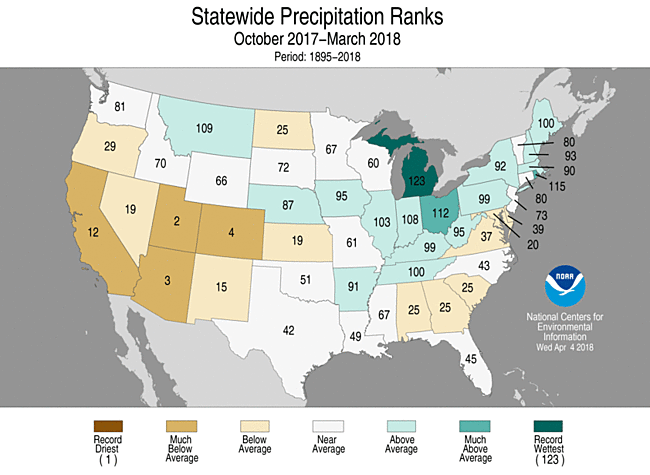
- The cold season precipitation total was 12.95 inches, 0.75 inch below average, and ranked in the lowest third of the historical record.
- Below-average precipitation accumulated in the Southwest, Southern High Plains, the Southeast and parts of the Northern Plains. Utah had its second driest cold season, Arizona the third driest, Colorado the fourth driest and California the 12th driest. The below-average precipitation and above-average temperatures in the Southwest contributed to record low snowpack in parts of the Southern Rockies and Great Basin during much of the cold season.
- Above-average precipitation was observed in the Northwest, Northern Rockies, Midwest, Great Lakes and parts of the Northeast and Ohio Valley. Michigan had its wettest cold season on record with 134 percent of average precipitation. This bested the previous record set in 1984/85. Ohio had its 12th wettest cold season.
- The USCEI for the cold season was 25 percent above average in the highest third of the 108-year period of record. Nationally, extremes in warm maximum and minimum temperatures and landfalling tropical cyclones were above average.
- On the regional scale, the CEI in the Southwest ranked as the third highest value on record due to extremes in warm maximum and minimum temperatures and the spatial extent of dry conditions.
**A comparison of the national temperature departure from average as calculated by NCDC's operational dataset (nClimDiv), the U.S. Historical Climatology Network (USHCN), and the U.S. Climate Reference Network (USCRN) is available on our National Temperature Index page.**
Regional Highlights:
These regional summaries were provided by the six Regional Climate Centers and reflect conditions in their respective regions. These six regions differ spatially from the nine climatic regions of the National Centers for Environmental Information.
- Northeast Region: (Information provided by the Northeast Regional Climate Center)
- March was only slightly warmer than February in the Northeast. The region's average temperature for March was 32.4 degrees F (0.2 degrees C), 2.1 degrees F (1.2 degrees C) colder than normal, compared to February's average temperature of 32.1 degrees F (0.1 degrees C), 5.9 degrees F (3.3 degrees C) warmer than normal. Ten of the region's twelve states were colder than normal, with departures for all states ranging from 4.4 degrees F (2.4 degrees C) below normal in Maryland to 1.7 degrees F (0.9 degrees C) above normal in Maine.
- March wrapped up on the dry side of normal for the Northeast, with the region receiving 3.12 inches (79.25 mm) of precipitation, 89 percent of normal. Nine of the twelve states were drier than normal, with precipitation for all states ranging from 64 percent of normal in Maryland to 113 percent of normal in New Jersey.
- Dry conditions within a small region of the Northeast have persisted throughout most of March, mainly in parts of Maryland. At the beginning of March, about two percent of the entire Northeast was abnormally dry. By the end of the month, one percent of the Northeast was experiencing abnormal dryness. Drought conditions improved over the course of the month within Maryland. At the start of the month, 47 percent of Maryland was abnormally dry, and three percent of the state was experiencing moderate drought. By the end of March, 23 percent of Maryland was abnormally dry, and two percent of the state was experiencing moderate drought.
- An active weather pattern brought four major storms to the Northeast this month. On March 2, a snowstorm impacted much of central New York. Areas west of Albany, New York received up to 40 inches (101.6 cm) of snow, mainly in Schoharie County. Strong winds associated with the storm downed trees and power lines, which caused over 83,000 customers to lose power. Although much of the snow from this storm fell in New York, wind gusts greater than 90 miles per hour (40 m/s) were reported in southeastern Massachusetts, particularly areas near Barnstable and Nantucket, Massachusetts. A few days later on March 7, a nor'easter brought heavy, wet snow to eastern New York, northern New Jersey, and much of New England. Locations in western Massachusetts and southern Vermont received the most snow, with Woodford, Vermont reporting 36 inches (91.4 cm) of snow from this storm. Flooded streets led to road closures in Duxbury, Massachusetts and as well as many other coastal areas. The wind gusts from the storm also caused over 320,000 customers to lose power. Just a few days after that storm, another nor'easter moved through the region on March 13, impacting eastern New England. Penobscot, Maine received 30 inches (76.2 cm) of snow from this storm. Blizzard conditions were reported in Boston, Massachusetts, with winds gusting over 40 miles per hour (18 m/s), as well as in other locations along coastal Massachusetts and Rhode Island. Boston, Massachusetts and Worcester, Massachusetts ranked this storm as their largest one-day March snowfalls on record. A week later on March 21, another nor'easter moved through the Northeast, with the greatest snowfall totals reported in New York, New Jersey, Pennsylvania, and Maryland. This nor'easter closed schools in New York City and many surrounding areas, and also caused more than 5,000 flights to be cancelled. Patchogue, New York recorded 20.1 inches (51.1 cm) of snow. The snowfall pushed Islip, New York's monthly total into record territory. The site picked up 31.9 inches (81.0 cm) of snow this March, beating the previous record of 23.3 inches (59.2 cm) set back in March 1967. The four nor'easters during the month of March impacted many within the Northeast and led to numerous school cancellations, accidents, and travel delays throughout much of the region.
- For more information, please go to the Northeast Regional Climate Center Home Page.
- Midwest Region: (Information provided by the Midwest Regional Climate Center)
- Precipitation totals in March varied from less than 0.50 inches (13 mm) to more than 6.00 inches (152 mm). Totals, viewed as a percentage of normal, ranged from less than 25 percent of normal in northeastern Minnesota to nearly twice normal in southern Illinois and western Minnesota. Below-normal totals stretched from eastern Minnesota, across Wisconsin and nearly all of Michigan, northeastern Iowa, northern Illinois, and northwestern Indiana. Western Missouri was also below normal. Above-normal conditions stretched from western Minnesota, across Iowa from northwest to southeast, eastern and central Missouri, central and southern Illinois, southern Indiana, and much of Kentucky and Ohio. The region as a whole was very near normal with statewide values in Wisconsin and Michigan about half of normal and Minnesota also well below normal, while the other six states ranged from 104 to 128 percent of normal for the month.
- March temperatures were near or below normal across the Midwest. Statewide values ranged from 0.3 degrees F (0.2 C) below normal in Minnesota to 3.3 degrees F (1.8 C) below normal for Ohio. The regional average for March was 1.5 degrees F (0.8 C) below normal. Minimum temperatures were close to normal, within 2 degrees F (1 C) of normal, across the region with low maximum temperatures responsible for the departure from normal. Maximum temperatures were at least 3 degrees F (2 C) below normal in parts of every Midwest state except Wisconsin.
- March saw several snow events that each impacted a portion of the region. Totals for the month were generally below normal except for a swath from Minnesota to Kentucky. Much of western Minnesota had more than twice its normal total while southeastern and northwestern Minnesota were below normal. The swath of snow at 200 percent of normal was relatively narrow as is stretched southeastward across northeastern Iowa and central Illinois, with totals dropping well below normal 50 miles (80 km) north or south. Snow totals ranging from two to seven times normal covered most of the region including the southern half of Indiana, southwestern Ohio, and the state of Kentucky.
- Drought eased slightly in March falling from over 4 percent of the region to about 2.5 percent during the month. Flooding that carried over from February also eased in the first half of March as the waters worked their way down the Mississippi River. Late in March, heavy rains in the southern third of the Midwest had rivers in the Ohio Basin on the rise. Minor and moderate flooding on the Wabash River had either begun in March or was forecast in early April due to the late March rains.
- Wet fields and cold soils in the region have spring planting on hold. The conditions need to improve to allow field work and planting to get underway.
- For further details on the weather and climate events in the Midwest, see the weekly and monthly reports at the Midwest Climate Watch page.
- Southeast Region: (Information provided by the Southeast Regional Climate Center)
- Temperatures ranged from near average to well below average across the Southeast region during March. Monthly mean temperatures were at least 3 degrees F (1.7 degrees C) below average for approximately 37 percent of the 193 long-term (i.e., period of record equaling or exceeding 50 years) stations across the region. About two thirds (48 of 71) of these stations were located in North Carolina, Virginia, and Washington, D.C., including Raleigh, NC (-5.8 degrees F, -3.2 degrees C), Richmond, VA (-4.7 degrees F, -2.6 degrees C), Greensboro, NC (-4.7 degrees F), and Washington Dulles International Airport, VA (-4.6 degrees F, -2.6 degrees C). However, only 11 long-term stations observed monthly mean temperatures that were ranked within their five coldest values on record, including St. Thomas, USVI (1953-2018; coldest on record), Covington Filtration Plant, VA (1961-2018; coldest on record), and New Bern, NC (1949-2018; tied for second coldest). On the 3rd, St. Thomas recorded its lowest minimum temperature during March since 1995, reaching 65 degrees F (18.3 degrees C). Several locations in North Carolina and Virginia observed or tied their highest or second highest count of March days with a maximum temperature lower than 60 degrees F (15.6 degrees C), including Luray 5 E, VA (1941-2018; 28 days), Williamsburg 2 N, VA (1952-2018; 27 days), Statesville 2 NNE, NC (1902-2018; 23 days), and Wilson 3 SW, NC (1917-2018; 22 days). Other long-term stations observed or tied their second or third highest count of March days with a minimum temperature at or below 30 degrees F (-1.1 degrees C), including Washington Dulles International Airport, VA (1962-2018; 21 days), Lynchburg, VA (1893-2018; 20 days), Louisville 1 E, GA (1893-2018; 9 days), and Augusta, GA (1875-2018; 8 days). The coldest weather of the month across the Southeast occurred on the 9th and 15th, as continental high pressure systems ushered in unseasonably cold, dry air from the northwest. Daily minimum temperatures fell below 32 degrees F (0 degrees C) as far south as northern Florida, with the western half of North Carolina and Virginia reaching 25 degrees F (-3.9 degrees C) or lower. In contrast, the warmest weather of the month occurred from the 28th through the 29th, as the circulation around the Bermuda High, situated off the Atlantic coast, transported warm, humid air over the Southeast. Daily maximum temperatures exceeded 75 degrees F (23.9 degrees C) across much of the region, with portions of every state reaching 80 degrees F (26.7 degrees C) or higher.
- Precipitation was near normal to well below normal across much of the Southeast region during March. The driest locations were found across much of Florida, as well as portions of southern Alabama, southeastern Georgia, and coastal South Carolina. Monthly precipitation totals were 50 to less than 10 percent of normal in these areas. Several long-term stations in Florida observed March precipitation totals that were ranked within their five lowest values on record, including Miami (1896-2018; 0.19 inches, 4.8 mm), Vero Beach (1943-2018; 0.32 inches, 8.1 mm), Apalachicola (1931-2018; 0.54 inches, 13.7 mm), and Lakeland Regional Airport (1949-2018; 0.84 inches, 21.3 mm). From the 8th through the 19th, Washington Dulles International Airport, VA (1962-2018) tied its third longest March streak of 12 consecutive days with no measurable precipitation. In contrast, Roanoke, VA (1912-2018) tied its third highest count of 16 days during March with measurable precipitation. Well-above-normal snowfall was recorded across portions of North Carolina and Virginia during March, with some of the greatest monthly totals including 36.0 inches (914 mm) on Mt. Mitchell, NC (19.6 inches or 498 mm above average), 30.7 inches (780 mm) at Mustoe 1 SW, VA (24.3 inches or 617 mm above average), 27.0 inches (686 mm) on Beech Mountain, NC (11.3 inches or 287 mm above average), and 25.2 inches (640 mm) at Burkes Garden, VA (17.8 inches or 452 mm above average). Several long-term stations observed March snowfall totals that were ranked within their three highest values on record, including Blacksburg, VA (1953-2018; 22.7 inches, 577 mm), Pulaski 2 E, VA (1922-2018; 20.0 inches, 508 mm), and Reidsville 2 NW, NC (1962-2018; 9.9 inches, 251 mm). On the 12th and 13th, a mid-latitude cyclone strengthening off the Atlantic coast produced 1 to more than 6 inches (25.4 to more than 152 mm) of snowfall across much of northern North Carolina, as well as central and southern Virginia. Measurable snowfall was also recorded along portions of coastal Virginia and the Outer Banks of North Carolina. Some of the greatest snowfall accumulations included 11.8 inches (300 mm) near Mustoe, VA, 10.0 inches (254 mm) on Mt. Mitchell, NC, 8.5 inches (216 mm) near Galax, VA, and 8.0 inches (203 mm) near Jefferson, NC. Icy roadways caused hundreds of vehicle accidents across North Carolina and Virginia, resulting in at least 2 fatalities and 3 injuries. On the 24th and 25th, another winter storm produced 3 to more than 12 inches (76.2 to more than 305 mm) of snowfall across portions of northwestern North Carolina and southwestern Virginia. The greatest snowfall accumulations occurred in the higher elevations of southwestern Virginia, including 16.3 inches (414 mm) near Long Spur, 16.2 inches (411 mm) near Pilot, and 14.0 inches (356 mm) near Dublin. On the 25th, Burkes Garden, VA (1896-2018; 15.0 inches, 381 mm), Wytheville 1 S, VA (1893-2018; 13.9 inches, 353 mm), and Pulaski 2 E, VA (1922-2018; 12.0 inches) observed their greatest 1-day snowfall on record for March, surpassing daily snowfall totals that were recorded during the 'Storm of the Century' in March 1993. In addition, Burkes Garden tied its second greatest 1-day snowfall for any month on record, while Wytheville observed its third greatest 1-day snowfall for any month on record. Over 70,000 customers in southwestern Virginia lost power, and a NASCAR race at Martinsville Speedway was postponed due to treacherous track conditions.
- There were 227 severe weather reports across the Southeast during March, which is near the median monthly frequency of 217 reports during 2000-2016. Approximately 75 percent (172 of 227) of the monthly reports were recorded during a severe weather outbreak on the 19th and 20th, with over 70 percent (126 of 172) of these reports occurring in Alabama and Georgia. About half (109 of 227) of the severe weather reports during the month were for thunderstorm winds, which caused at least 1 injury. On the 20th, strong thunderstorm winds estimated at 95 to 105 mph damaged four industrial buildings in Augusta, GA, where large portions of roofing were uplifted and blown away. In addition, four nearby vehicles were shifted from their parked locations by the wind gusts and flying debris. Later that day, several thunderstorm wind gusts exceeding 50 mph were recorded in Florida, including 74 mph on a 54-foot tower at the Cape Canaveral Air Force Station, 62 mph at Sebring Regional Airport, and 53 mph near the Sunshine Skyway Bridge in Tampa Bay. Hail accounted for nearly 45 percent (99 of 227) of the severe weather reports during March, including nine reports of 2-inch (i.e., hen egg-sized) or larger hailstones. On the 19th, extremely large hail with diameters ranging from 2.75 inches (baseball-sized) to more than 4 inches (softball-sized) caused extensive damage and destruction to homes, businesses, and vehicles across Cullman County, AL. An exceptionally large hailstone that was found in the community of Walter measured 5.38 inches in diameter, with a circumference of 13.75 inches and a weight of 9.8 ounces. This is officially the largest hailstone on record for the state of Alabama. Prior to this event, the largest hailstone recorded in Alabama was 4.5 inches in diameter (grapefruit-sized), with a total of 9 observations since 1955. Nineteen tornadoes (4 EF-0s, 10 EF-1s, 4 EF-2s, and 1 EF-3) were confirmed across the region during the month, which is close to the median frequency of 18 tornadoes observed during March. On the 19th, an EF-3 tornado tracked over 35 miles from Calhoun County in northeastern Alabama to Haralson County in northwestern Georgia, with a maximum path width exceeding one mile and four reported injuries. The greatest damage occurred in the city of Jacksonville, AL, where many homes were rendered uninhabitable and several buildings on the campus of Jacksonville State University sustained major damage. In addition, the tornado downed thousands of trees along its path, including a swath of the Talladega National Forest. An hour later, a short-lived EF-2 tornado touched down about 10 miles west of Hartsfield-Jackson Atlanta International Airport in Fulton County, GA. Over 50 homes near the town of Fairburn were visibly damaged, with at least half of these homes sustaining major damage. On the 2nd, a mid-latitude cyclone undergoing rapid intensification (i.e., bombogenesis) off the Atlantic coast produced non-convective wind gusts exceeding 50 mph across broad portions of North Carolina, Virginia, and Washington, D.C. Some of the highest recorded wind gusts included 75 mph near Dahlgren, VA, 71 mph at Washington Dulles International Airport, VA, 70 mph near Chincoteague, VA, 66 mph in downtown Washington, D.C., 66 mph at Oregon Inlet, NC, 62 mph at Roanoke Regional Airport, VA, and 57 mph at Asheville Regional Airport, NC. The 71 mph wind gust for Washington Dulles International Airport tied its highest wind gust on record, which previously occurred during the derecho of June 29, 2012. Dulles Airport recorded wind gusts exceeding 50 mph for over 12 consecutive hours, leading to a brief evacuation of the air traffic control tower. A regional jet traveling from Charlottesville, VA encountered severe turbulence on its approach to Dulles Airport, with nearly all of the passengers experiencing airsickness. Hundreds, if not thousands, of trees were blown down across these areas, with many falling onto power lines, homes, and vehicles. At least 2 fatalities and 10 injuries were caused by falling trees, and most of these casualties occurred in vehicles. Over 500,000 customers in North Carolina, Virginia, and the Washington, D.C. area lost power, and hundreds of flights were cancelled at Dulles Airport and Ronald Reagan Washington National Airport. From the 2nd through the 5th, strong and persistent offshore winds associated with the mid-latitude cyclone produced significant ocean overwash and coastal flooding along the Outer Banks of North Carolina, while record low water levels were observed in the Neuse and Pamlico Rivers farther inland. From the 4th through the 7th, the powerful cyclone situated over the Northwest Atlantic Ocean generated exceptionally large swells with waves of 25 to 30 feet in height along the coastline of Puerto Rico and the U.S. Virgin Islands, which are located about 1,500 miles away. Coastal flooding caused significant beach erosion and damaged numerous homes, roads, docks, and other structures along the northern and western coast of Puerto Rico.
- Drought intensified and expanded in coverage across the southern half of the region during March, with about 22 percent of the Southeast classified in moderate-to-severe (D1-D2) drought at the end of the month. The greatest drought coverage was found in Georgia and South Carolina, where more than 50 and 30 percent of each state, respectively, were covered in moderate-to-severe drought in late March. Additional development of moderate drought occurred in northwestern Alabama and portions of the Florida Peninsula, while drought conditions were nearly eliminated in northeastern Virginia and the Florida Panhandle. By the end of March, North Carolina was the only drought-free (i.e., less than D1) state in the Southeast. Cooler-than-normal weather during March delayed the preparation and planting of crop fields and slowed the growth of small grains, livestock pastures, and hayfields across much of the region. Pastures and hayfields in southern Florida were stressed by a persistent lack of rainfall during the month, while several frosts damaged and slowed the green-up of pastures in northern Florida. Due to the poor grazing conditions across much of Florida, livestock producers continued to provide water and supplemental feed to their cattle. Below-average precipitation required many fruit and vegetable producers in Florida, including the citrus industry, to use their irrigation systems extensively during the month. Periods of sub-freezing temperatures during March damaged the early-season peach crop in several states. About 10 to 50 percent of the flowering blossoms on peach trees in northern and central Georgia were lost to excessively cold temperatures. Moderate damage to the blueberry crop in southern Georgia was also reported, particularly in farms lacking frost protection. While these crops were able to acquire sufficient chill hours from December through January, extreme warmth during February caused the fruit trees to bud or bloom prematurely, which increases their vulnerability to spring freezes.
- For more information, please go to the Southeast Regional Climate Center Home Page.
- High Plains Region: (Information provided by the High Plains Regional Climate Center )
- March yielded contrasting climate conditions across the High Plains region. In the Northern Plains, it was cold and snowy, as frequent cold air outbreaks and ample moisture produced several rounds of snow across the Dakotas. Several locations ended up in the top 10 of wettest and/or snowiest Marches on record, particularly in North Dakota. While cold temperatures were not record-breaking for the month, the continuation of below-normal temperatures throughout the winter and early spring combined with the lack of available feed due to last year's drought led to increased instances of cattle and calf deaths across the Dakotas and Montana.
- Farther south, precipitation deficits continued to accumulate in March, and drought expanded and intensified across portions of Colorado and Kansas. While the Colorado Rockies received some beneficial snowfall in March, mountain snowpack was still well below normal for the season, and with the normal peak of the mountain snowpack season approaching, it is unlikely that the deficit will be made up. Although the drought developed over winter, it has already impacted agriculture. For instance, the lack of precipitation and snow cover may have damaged alfalfa in the San Luis Valley in south-central Colorado, according to an extension agent in the region. In Kansas, the worsening drought situation prompted the governor to make an official drought declaration for the entire state. Shortly after the drought declaration, Kansas lawmakers requested emergency haying and grazing of Conservation Reserve Program (CRP) lands. Another immediate concern was wildfires, as conditions in March were ripe for wildfires to develop and spread.
- Although winter conditions allowed for the improvement of drought across the Northern Plains, this region is still dealing with impacts, such as the lack of available feed contributing to cattle deaths as mentioned above. According to NOAA, the 2017 Northern Plains drought had an economic impact of $2.5 billion on the Dakotas and Montana. Producers are concerned that this region will endure a second year of drought, hampering recovery from last year's drought.
- Temperatures were cooler in the Northern Plains and warmer in the Central Plains during March, ranging from 5.0 degrees F (2.8 degrees C) below normal across parts of North Dakota to 4.0 degrees F (2.2 degrees C) above normal in southwestern Kansas. Temperatures were generally not record-breaking region-wide, although Akron, Colorado had its 9th warmest March on record.
- Throughout the month, warm and cold spells caused temperatures to fluctuate over short periods of time, which is common for March. The combination of cold air outbreaks and snow cover kept temperatures below normal for most of the month in the Northern Plains, especially across North Dakota. Meanwhile, persistently dry conditions throughout southwestern Kansas allowed temperatures to soar during warm spells. For instance, a warm spell on the 23rd and 24th produced temperatures in the low 90s across this region. The warmest location was Cimarron, which reached 92.0 degrees F (33.3 degrees C) on the 24th and had its 4th highest March temperature on record (period of record 1911-2018).
- Heading into April, many producers are concerned about the cold start to spring that has occurred in some parts of the High Plains. Combined with recent wet conditions in some areas, it has been difficult for producers to conduct field work to prep their fields for spring planting. Additionally, planting will likely need to be delayed to allow for temperatures to warm up and the soils to dry out. Unfortunately, the outlook for April indicates a higher likelihood for below-normal temperatures across the Northern and Central Plains, which would be problematic for planting.
- March was wet for the Northern Plains, while dry conditions prevailed throughout the Central Plains. Eastern Wyoming and the Dakotas experienced above-normal precipitation, with the greatest departures occurring throughout western and central North Dakota where precipitation exceeded 200 percent of normal. Meanwhile, March was dry across much of Nebraska, Kansas, Colorado, and western Wyoming, as these regions received 50-75 percent of normal precipitation, at best. The driest area was southwestern Kansas, where very little precipitation fell.
- The wetness in the Dakotas and eastern Wyoming was due to several snowstorms that traversed the region. For instance, a snowstorm impacted the Dakotas on the 5th-6th, producing high snowfall totals. Blizzard conditions occurred in Bismarck, North Dakota, causing flights to be cancelled into and out of Bismarck Municipal Airport. Bismarck received 8.5 inches (22 cm) of snow from the storm, which was just shy of its normal March snowfall total of 9.1 inches (23 cm). Bismarck ended up receiving 21.0 inches (53 cm) of snow for the month, which was its 9th snowiest March on record. Another winter storm occurred on the 16th, impacting the Black Hills region of South Dakota, northwestern Nebraska, and eastern Wyoming. Rapid City, South Dakota got 9.6 inches (24 cm) of snow out of the storm, which was its 8th highest 1-day total snowfall on record for March. This storm caused multiple crashes on Interstate 80, forcing the highway to close.
- Farther south, it was a much drier month, with drought continuing to spread and intensify across Colorado and Kansas. Warmer temperatures contributed to the lack of snow across these areas as well, which resulted in several locations having a top 10 least snowiest March on record. For instance, Pueblo, Colorado had its 5th driest March, receiving only 0.06 inches (2 mm) of precipitation. Pueblo received only a trace of snowfall, tying last year (and several other years) for its 2nd least snowiest March on record. Season-to-date snowfall was well below normal throughout Colorado and Kansas as well. In fact, several locations are on track to have a top 10 least snowiest season on record. The following rankings are for July-March snowfall: Wichita, KS (least snowiest), Dodge City, KS (2nd least snowiest), Alamosa, CO (5th least snowiest), Grand Junction, CO (tied for 5th least snowiest), Denver, CO (8th least snowiest), and Pueblo, CO (8th least snowiest).
- Upper Missouri Basin snowpack continued to be above normal in March. According to the U.S. Army Corps of Engineers, Snow Water Equivalent (SWE) above Fort Peck Reservoir and between Fort Peck and Garrison Reservoirs was 127 percent of normal as of the end of March. Normally by April 1, about 97 percent of the peak mountain SWE has occurred in both reaches, with the normal peak occurring around April 15. Wyoming mountain snowpack was near to slightly above normal in late March. Colorado snowpack was only 70 percent of normal, with southern basins continuing to fare the worst. In the Plains, snow covered the ground across North Dakota, northern South Dakota, and northeastern Wyoming at the end of the month. However, dryness and warmer temperatures resulted in snow-free conditions for much of Nebraska, Kansas, and Plains areas of Colorado and Wyoming.
- Drought conditions improved across the north while worsening throughout the southern portion of the High Plains during March. According to the U.S. Drought Monitor, the overall area experiencing drought or abnormal dryness (D0-D4) decreased from 69 percent to 63 percent, but areas experiencing severe (D2), extreme (D3), and exceptional (D4) drought increased. As for improvements, a wet pattern prevailed throughout March in the Dakotas, bringing drought relief to the region. Heavy snows fell across this region during the early part of the month, removing drought across the eastern Dakotas and improving conditions in the west.
- However, the drought situation continued to worsen throughout Colorado and Kansas. This region missed out on much-needed precipitation, with the majority of the two states receiving less than 50 percent of normal precipitation for the month. As a result, D2 and D3 conditions expanded across southern, central, and eastern portions of Colorado and Kansas, and D4 conditions expanded across southwestern Kansas. As for impacts, topsoil moisture and winter wheat conditions were suffering from the lack of precipitation. According to the March 27th U.S. Department of Agriculture Weekly Weather and Crop Bulletin, topsoil moisture was rated 69 percent and 63 percent short to very short in Kansas and Colorado, respectively. Winter wheat conditions were rated 49 percent poor to very poor in Kansas and 21 percent poor to very poor in Colorado. Spring precipitation is badly needed for winter wheat growth and for other crops to be planted.
- For more information, please go to the High Plains Regional Climate Center Home Page.
- Southern Region: (Information provided by the Southern Regional Climate Center)
- March temperatures had a defined gradient throughout the Southern Region. In western Oklahoma, central and northern Louisiana, and most of Texas temperatures were 4 to 6 degrees F (2.22 to 3.33 degrees C) above normal. Parts of central and southern Texas experienced 6 to 8 degrees F (3.33 to 4.44 degrees C) above normal. In contrast, parts of central Mississippi and eastern Tennessee were 2 to 4 degrees F (1.11 to 2.22 degrees C) below normal. The statewide monthly average temperatures were as follows: Arkansas–53.70 degrees F (12.06 degrees C), Louisiana–62.10 degrees F (16.72 degrees C), Mississippi–57.00 degrees F (13.89 degrees C), Oklahoma–52.90 degrees F (11.61 degrees C), Tennessee–48.20 degrees F (9.00 degrees C), and Texas–61.60 degrees F (16.44 degrees C). The statewide temperature rankings for March were as follows: Arkansas (thirty-eighth warmest), Louisiana (twenty-seventh warmest), Mississippi (forty-sixth warmest), Oklahoma (twenty-eighth warmest), Tennessee (fifty-seventh coldest), and Texas (thirteenth warmest). All state rankings are based on the period spanning 1895-2018.
- Precipitation values for the month of March varied spatially throughout the Southern Region. Parts of western and eastern Texas and west central Louisiana received 200–300 percent of normal precipitation. Southwestern Tennessee, northwestern and central Mississippi, southern Arkansas, western Louisiana and parts of central Texas received 150–200 percent of normal precipitation. In contrast, western Oklahoma and northern and western Texas received 5 percent or less of normal precipitation. Areas of extreme southern Louisiana and southern, west central, and northern Texas received 50 percent or less of normal precipitation. The state-wide precipitation totals for the month were as follows: Arkansas–5.45 inches (138.43 mm), Louisiana–4.82 inches (122.43 mm), Mississippi–5.68 inches (144.27 mm), Oklahoma–1.97 inches (50.04 mm), Tennessee–5.56 inches (141.22 mm), and Texas–1.98 inches (50.29 mm). The state precipitation rankings for the month were as follows: Arkansas (forty-seventh wettest), Louisiana (sixty-first wettest), Mississippi (sixtieth driest), Oklahoma (forty-seventh driest), Tennessee (fifty-second wettest), and Texas (forty-fifth wettest). All state rankings are based on the period spanning 1895-2018.
- In March, the exceptional drought classification appeared in northwestern Oklahoma and northern Texas. The severe drought classification was expanded through parts of central Texas and drought conditions worsened to moderate in southern Texas. The moderate drought classification was expanded throughout parts of western Texas. Drought conditions improved from moderate to no official drought designation in central Oklahoma and north central Arkansas. Conditions also improved from abnormally dry to normal or wetter than normal conditions in central Mississippi, southeastern Tennessee and northwestern Arkansas.
- In March, there were 12 days with severe weather reports throughout the region. There were 459 severe weather events (29 tornadoes, 288 hail, and 142 wind events) reported throughout the Southern Region. Sixteen of the tornado events and 75 of the wind events occurred throughout Texas, Louisiana, and Mississippi on March 28. On March 10, there were 93 hail events reported throughout Texas, Arkansas, and Mississippi.
- On March 5, 2018, two tornadoes, eight hail, and three wind events were reported throughout the region. In Edwards, Mississippi, a tornado caused a few trees to be uprooted and snapped. In Duce, Arkansas and Belmont, Texas, golf ball sized hail was reported.
- On March 10, 2018, there were five tornadoes, 93 hail, and 29 wind events reported mainly throughout Arkansas, Mississippi, and Texas. A tornado in Flora, Mississippi had peak winds of 75 mph (120.7 kph). In Metcalfe, Mississippi and Scottsville, Texas baseball sized hail was reported. In Marion Texas, one person passed away and seven others were injured due to strong straight line winds. There was also one fatality in White Oak, Texas when a large oak tree fell on a mobile home.
- On March 11, 2018, two tornadoes were reported, one in Echo, Louisiana which injured four people and one in Bentonia, Mississippi. There were also six severe wind events reported in Louisiana.
- On March 17, 2018, Baseball sized hail was reported in Eddy, Texas and a 60 mph (96.56 kph) wind gust was reported Rogersville and Johnson City, Tennessee.
- On March 18, 2018, two tornadoes were reported in Texas. Baseball sized hail was reported in Caldwell, Burleson and Bosque, Texas.
- On March 23, 2018, there were 13 hail reports throughout Texas, Oklahoma, and Arkansas.
- On March 26, 2018, there were 34 hail reports in Texas and 7 wind reports throughout Texas and Oklahoma. There were two 60 mph (96.56 kph) wind gusts reported in Haslet and Cundiff, Texas.
- On March 27, 2018, two tornadoes were reported in the Southern Region, one in Bonanza, Arkansas and one in Caldwell, Texas. A severe wind event caused downed trees in Fort Smith, Arkansas.
- On March 28, 2018, there were 16 tornadoes reported throughout Texas, Louisiana, and Mississippi. A tornado in Mangham, Louisiana caused four injuries. Also, a 70 mph (112.65 kph) wind gust was reported in Matagorda Island, Texas.
- On March 29, 2018, a tornado knocked down some large branches and twisted some tops off of trees in Clarence, Louisiana.
- For more information, please go to the Southern Regional Climate Center Home Page.
- Western Region: (Information provided by the Western Region Climate Center)
- An active storm track featuring several atmospheric rivers delivered above normal precipitation to a wide swath of the West stretching from central California northeastward to western Montana. Temperatures were below normal in the northern and western parts of the region, while temperatures in the southeastern part of the West were slightly warmer than normal.
- Above normal March precipitation was extremely beneficial to areas such as the Sierra Nevada, southern Cascades, Great Basin, and central Rockies, which observed below normal winter season precipitation and snowpack. Many basins in these areas were at 30-50% of median snowpack at the beginning of March, but ended the month at more than 60-70% of median. Many locations stretching from central California to western Montana observed one of their top-10 wettest Marches on record. Paso Robles, in coastal southern California, received 6.18 in (157 mm) of rainfall, 222% of normal and the 7th wettest since records began in 1894. In the northern Sierra Nevada, Tahoe City, California, observed its 4th wettest March on record at 12.32 in (313 mm), 261% of normal. Tahoe City also had its 3rd snowiest March on record, logging 102.5 in (260 cm) of snowfall. Records for Tahoe City began in 1903. At the western edge of the Great Basin, Reno, Nevada, reported 2.35 in (60 mm) of precipitation, 309% of normal and the 2nd wettest in an 82-year record. Further east, Elko, Nevada, observed 1.96 in (50 mm), 196% of normal and the 11th wettest March since records began in 1888. In southwestern Montana, Ennis recorded 2.07 in (53 mm) of precipitation, 256% of normal and the 2nd wettest in a 101-year record.
- In the US Drought Monitor valid 27 March, 43% of the West was experiencing drought conditions. Improvements were observed in California, northern Oregon, and eastern Montana in association with this month's above normal precipitation. Severe to extreme drought conditions were present in 27% of the region, all within the Four Corners states and southern California. With the exception of southwestern California, these areas generally observed below normal March precipitation. Phoenix, Arizona, reported 0.04 in (1 mm), 4% of normal. Albuquerque, New Mexico logged 0.18 in (5 mm), 32% of normal. These regions most affected by drought depend on spring and summer snowmelt from the Colorado River Basin; the Upper Basin reported 71% and the Lower Basin 31% of median snowpack at month's end.
- Temperatures were within 3 F (1.7 C) of normal across much of the West, though well below normal temperatures were observed in northern Montana. Havre, Montana, reported an average temperature of 20.9 F (-6.2 C), 11.9 F (6.6 C) below normal and the 5th coldest March since records began in 1961. Cold February and March temperatures have made calving season difficult for Montana ranchers, as calves are vulnerable to hypothermia. Temperatures 3-5 F (1.7-2.8 C) below normal were also observed in the northern portions of the Great Basin and Sierra Nevada. Tahoe City, California, reported an average temperature of 30.6 F (-0.8 C), 3.6 F (2 C) below normal.
- Warmer than normal temperatures were observed in the northern and western parts of Alaska. Utqia'vik (Barrow) recorded its warmest March since records began in 1920 at -0.7 F (-18.2 C), 12 F (6.7 C) above normal. Kotzebue had its 2nd warmest March in a more than 60-year record at 12.8 F (-10.7 C), 11.7 F (6.5 C) above normal. Arctic sea ice extent reached its second lowest annual maximum extent in a 39-year record this month, contributing to above normal temperatures. Precipitation was above normal across much of the state, except for the south-central and southeastern regions where precipitation was generally <75% of normal. Nome reported 2.46 in (62 mm) of precipitation, the highest March total since 1935. Further south, precipitation was variable across Hawaii. The southern to southeastern portions of the islands observed above normal precipitation while other areas reported near or slightly below normal precipitation. Lihue received 9.03 in (229 mm), 196% of normal and the 9th wettest March since records began in 1950. A storm on the 14th-15th caused flooding and road closures on Maui and Kauai; some areas of Kauai received over 6 in (152 mm) of rainfall in 24 hours.
- March 3-4: Avalanche deaths in West: A wet storm over the first few days of the month destabilized the snowpack creating dangerous avalanche conditions. Two snowmobilers died and two were injured in Kittitas County, Washington. Also in Washington, four skiers were trapped in an avalanche in Methow Valley, one of whom was killed. Sierra Nevada ski resorts were also impacted; an avalanche in Squaw Valley Ski Resort trapped five people, injuring two. A massive avalanche at Mammoth Mountain ski resort partially trapped eight people.
- March 20-22: Major storm impacted central California: The region of California between roughly San Francisco Bay and Los Angeles experienced high precipitation totals and at times high intensity rainfall during this storm event. Mud and rockslides resulted in flooded roadways and road closures throughout the area. San Luis Obispo County was hit particularly hard by the storm. Ten people were rescued from the Salinas River as waters rose quickly on the morning of the 22nd. Severe flooding occurred in Mariposa and eastern Merced County due to heavy rainfall associated with a line of intense thunderstorms; thousands of residents were evacuated in Mariposa and surrounding communities. Enhanced runoff associated with the Detwiler burn scar contributed to the flash flooding in the Mariposa area. Ahead of the event, evacuations were issued for more than 30,000 people living near burn scars in southern California, though no major debris flows were noted.
- For more information, please go to the Western Regional Climate Center Home Page.
 Oct-Mar Average Temperature Departures |
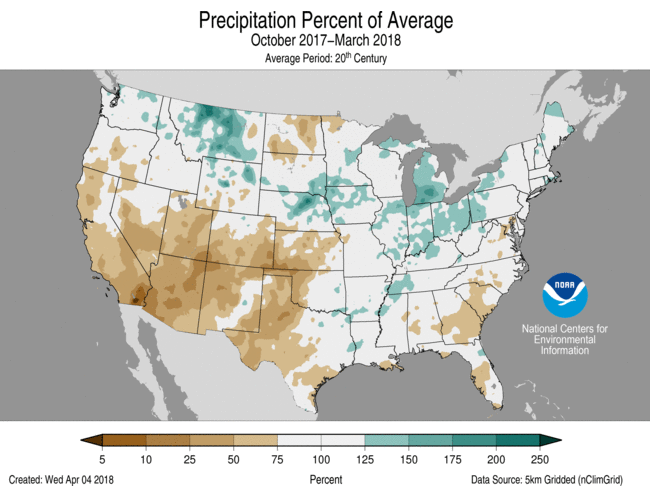 Oct-Mar Percent of Average Precipitation |
Temperature
Oct-Mar Statewide Temperature Ranks
Precipitation
Oct-Mar Statewide Precipitation Ranks