National Overview:
- Climate Highlights — winter (December 2015-February 2016)
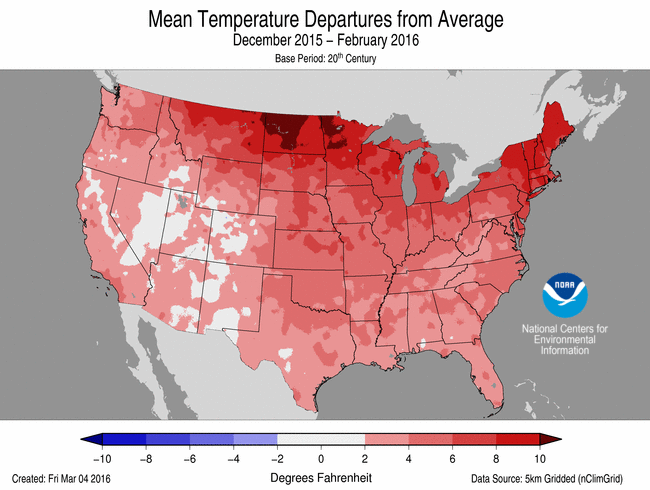 Dec-Feb Average Temperature Departures |
 Dec-Feb Percent of Average Precipitation |
Temperature
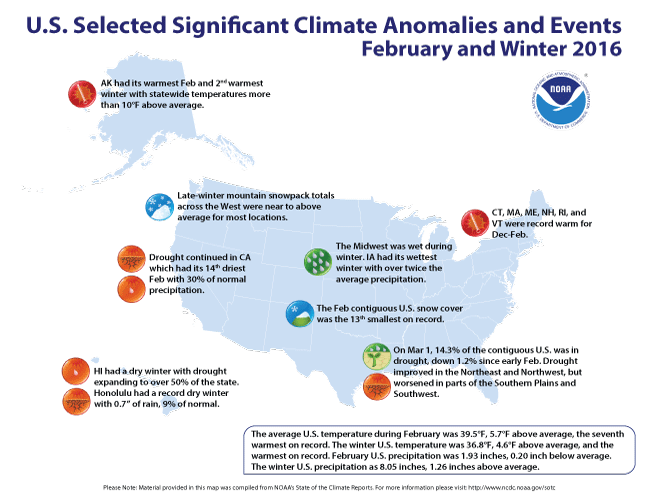
- The December-February average temperature for the contiguous U.S. was 36.8°F, 4.6°F above the 20th century average, surpassing the previous record of 36.5°F set in 1999/2000. The record warm December boosted the contiguous U.S. winter temperature.
- The contiguous U.S. average maximum (daytime) temperature during winter was 46.9°F, 4.2°F above the 20th century average, the fourth warmest on record. The average minimum temperature was 26.7°F, 4.9°F above average, second only to the winter minimum temperature of 1997/1998.
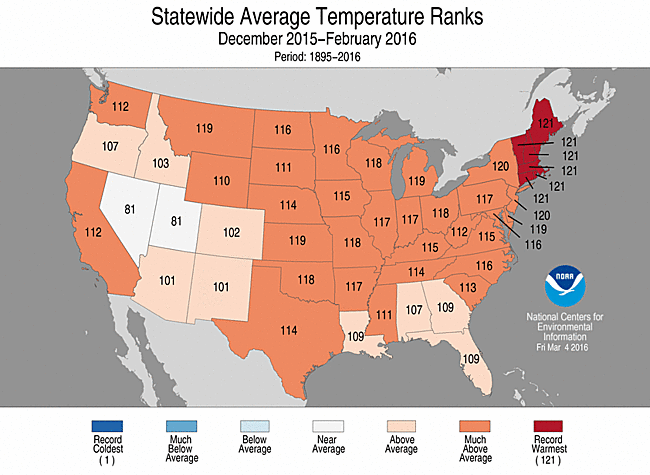
- Forty-six states across the contiguous U.S. had a winter temperature that was above average. Much-above average winter temperatures were observed across the Great Plains, Midwest, Southeast, Northeast, and parts of the West. Each of the six New England states had a winter temperature that was record warm.
- Alaska had its second warmest December-February with a statewide temperature of 14.2°F, 10.6°F above average. Several locations across Alaska were record warm including Barrow and King Salmon, while Anchorage and Juneau had their second warmest December-February.
- Based on NOAA's Residential Energy Demand Temperature Index (REDTI), the contiguous U.S. temperature-related energy demand during winter was zero and the lowest value on record. The record and near-record warm temperatures in the densely populated Midwest and Northeast contributed to the record low REDTI value.
Precipitation
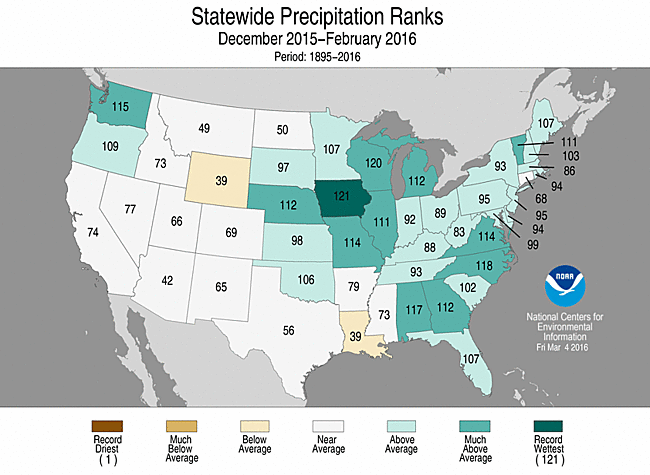
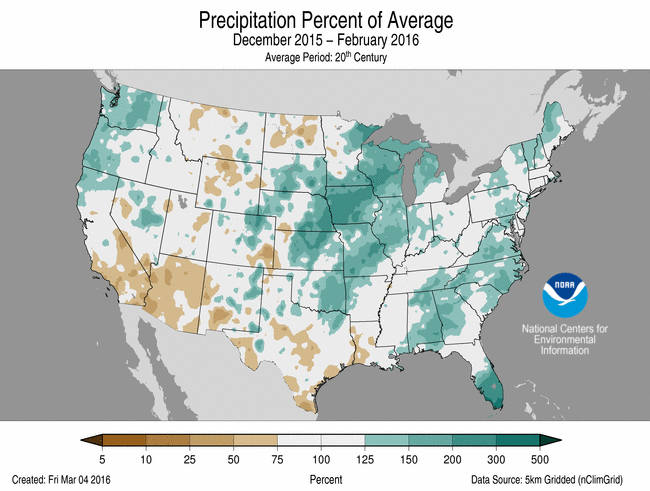
- The winter precipitation total for the contiguous U.S. was 8.05 inches, 1.26 inches above the 20th century average. This was the 12th wettest December-February on record for the Lower 48 and the wettest since 1997/1998.
- Above-average winter precipitation was observed across parts of the Northwest, Central Plains, and Midwest, and along the East Coast. Twelve states had winter precipitation totals that were much above average. Iowa was record wet with 6.20 inches of precipitation, 3.07 inches above average, surpassing the previous record of 5.79 inches in 1914/1915. Most of Iowa's winter precipitation fell during December, with January being drier than average and February near average.
- Hawaii had a dry winter with nearly all locations across the islands observing below average precipitation. Honolulu received 0.70 inch of rain from December to February, only 9 percent of normal and a new record low for the season, at 0.20 inch below the previous record in 1976/1977.
- According to an analysis of NOAA data by the Rutgers Global Snow Lab, the December-February contiguous U.S. snow cover extent was 1.30 million square miles, 52,000 square miles above the 1981-2010 average and the 17th largest in the 49-year period of record.
Extremes
- The U.S. Climate Extremes Index (USCEI) for winter was 20 percent above average and the 27th highest value on record. On the national scale, extremes in one-day precipitation totals and the spatial extent of wetness were much above average. The USCEI is an index that tracks extremes (falling in the upper or lower 10 percent of the record) in temperature, precipitation, land-falling tropical cyclones, and drought across the contiguous U.S.
- On a regional scale, the Northeast had its fifth highest winter CEI due to extremes in warm maximum and minimum temperatures and one-day precipitation totals. The Upper Midwest had its eighth highest winter CEI due to extremes in warm minimum temperatures, one-day precipitation totals, days with precipitation, and the spatial extent of wetness.
- Climate Highlights — February
 February Average Temperature Departures |
 February Percent of Average Precipitation |
Temperature
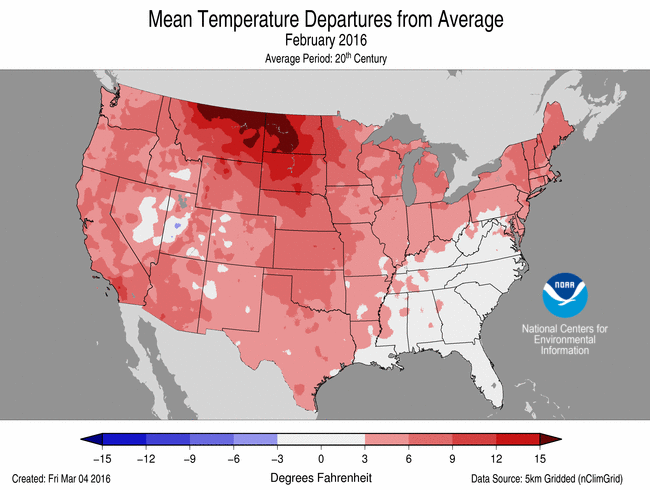
- The February temperature for the contiguous U.S. was 39.5°F, 5.7°F above the 20th century average, ranking as the seventh warmest on record and warmest since 2000.
- The contiguous U.S. average maximum (daytime) temperature during February was 50.8°F, 6.0°F above the 20th century average, the sixth warmest on record. The average minimum temperature was 28.2°F, 5.4°F above average, tying 1999 as the sixth warmest on record.
- Above-average February temperatures were widespread across Alaska and the western half of the contiguous U.S. as well as parts of the Midwest and Northeast, where 21 states were much warmer than average. Alaska had its warmest February on record with a statewide temperature of 17.2°F, 12.4°F above average. Near-average February temperatures were observed across the Southeast.
- During February there were 6,805 record warm daily high (3,882) and low (2,923) temperature records, which is about six times the 1,109 record cold daily high (777) and low (332) temperature records
- Based on NOAA's Residential Energy Demand Temperature Index (REDTI), the contiguous U.S. temperature-related energy demand during February was 75 percent below average and the ninth lowest value on record.
Precipitation
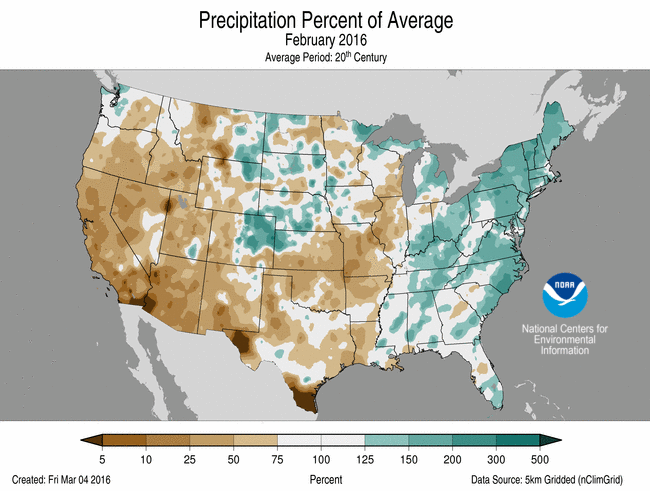
- The February precipitation total was 1.93 inches, 0.20 inch below average, which is near the median value for the 122-year period of record.
- Below-average February precipitation was observed across the western half of the Lower 48, including the drought-stricken areas of California. Above-average February precipitation was observed across the East. Four states in the Northeast had a February precipitation total that was much above average.
- According to the March 1 U.S. Drought Monitor report, 14.3 percent of the contiguous U.S. was in drought, down about 1.2 percent compared to the beginning of February. Drought conditions improved across parts of the Northwest and Northeast, with drought worsening in parts of the Southern Plains and Southwest. Over 95 percent of California continued to experiencedrought conditions, with 38 percent of the state remaining in the worst category of drought.
- Outside of the contiguous U.S., the dry winter in Hawaii caused drought conditions to expand to over half of the state. Several months of drought across the U.S.-affiliated Pacific Islands led to a state of emergency in the Marshall Islands and the Federated States of Micronesia. Drought conditions improved across eastern Puerto Rico.
- According to an analysis of NOAA data by the Rutgers Global Snow Lab, the February contiguous U.S. snow cover extent was 1.05 million square miles, 147,500 square miles below the 1981-2010 average, and the 13th smallest in the 50-year period of record. Above-average snow cover was observed across parts of the Midwest and Pacific Northwest. Below-average snow cover was observed in parts of the Northern Rockies and Plains and Northeast.
- Climate Highlights — 6-month (September 2015-February 2016)
 Sep-Feb Average Temperature Departures |
 Sep-Feb Percent of Average Precipitation |
Temperature
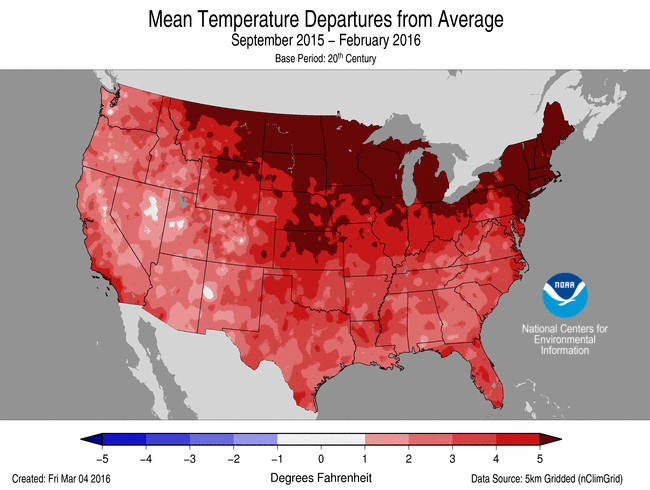
- The September-February average temperature for the contiguous U.S. was 46.8°F, 3.9°F above the 20th century average. This was the warmest such six-month period on record and consisted of the warmest autumn and warmest winter on record for the Lower 48. This bested the previous record of 46.3°F in 1998/1999. The maximum (daytime) temperature was the third highest on record while the minimum temperature was record warm.
Precipitation
- The September-February precipitation total for the contiguous U.S. was 16.42 inches, 2.74 inches above the 20th century average. This was the third wettest such six-month period on record. Only the September-February periods in 1996/1997 and 1973/1974 were wetter.
Extremes
- The USCEI for the six-month period was 35 percent above average and the 18th highest value on record. On the national scale, extremes in warm maximum and minimum temperatures and one-day precipitation totals were much above average.
- On a regional scale, the Northeast, Ohio Valley, and Upper Midwest had six-month CEI values that ranked among the five highest on record. Extremes in warm maximum and minimum temperatures, the spatial extent of wetness, days with precipitation and one-day precipitation totals drove the elevated regional CEI values.
- Climate Highlights — 12-month (March 2015-February 2016)
Temperature
- The March-February average temperature for the contiguous U.S. was 54.9°F, 2.9°F above the 20th century average. This was the warmest such 12-month period on record and consisted of the 11th warmest spring, 12th warmest summer, warmest autumn, and warmest winter on record for the Lower 48. This bested the previous record of 54.7°F in 2012/2013. The maximum (daytime) temperature was the third highest on record while the minimum temperature was record warm.
Precipitation
- The March-February precipitation total for the contiguous U.S. was 35.01 inches, 5.05 inches above the 20th century average. This was the second wettest such 12-month period on record. Only the March-February period in 1973/1974 was wetter.
Extremes
- The USCEI for the 12-month period was 75 percent above average and the fifth highest value on record. On the national scale, extremes in warm maximum and minimum temperatures, days with precipitation, and one-day precipitation totals were much above average.
- On a regional scale, the Northeast and Upper Midwest had 12-month CEI values that ranked among the five highest on record due to extremes in warm maximum and minimum temperatures and days with precipitation. The South region's CEI was also among the five highest for the 12-month period due to extremes in warm minimum temperatures, the spatial extent of wetness, one-day precipitation totals, and days with precipitation. Extremes in warm maximum and minimum temperatures and the spatial extent of drought resulted in the Northwest having its second highest 12-month CEI value.
**A comparison of the national temperature departure from average as calculated by NCDC's operational dataset (nClimDiv), the U.S. Historical Climatology Network (USHCN), and the U.S. Climate Reference Network (USCRN) is available on our National Temperature Index page.**
Regional Highlights:
These regional summaries were provided by the six Regional Climate Centers and reflect conditions in their respective regions. These six regions differ spatially from the nine climatic regions of the National Climatic Data Center.
- Northeast Region: (Information provided by the Northeast Regional Climate Center)
- February was another mild month for the Northeast. The region's average temperature of 28.9 degrees F (-1.7 degrees C) was 2.7 degrees F (1.5 degrees C) above normal, making it the 15th warmest February since 1895. All twelve states were warmer than normal, with eight of them ranking the month among their top 20 warmest: New Hampshire, 6th warmest; Maine and Vermont, 7th warmest; Massachusetts, 12th warmest; Connecticut and New York, 13th warmest; and New Jersey and Rhode Island, 14th warmest. State departures ranged from 0.6 degrees F (0.3 degrees C) above normal in West Virginia to 4.5 degrees F (2.5 degrees C) above normal in Vermont. Led by a record warm December, the winter season was the second warmest on record for the Northeast. The record warmest winter was 2002 at 31.9 degrees F (-0.1 degrees C). This winter, the average temperature was 31.4 degrees F (-0.3 degrees C), which was 5.5 degrees F (3.1 degrees C) above normal. The six New England states each had a record warm winter. New Jersey and New York both had their 2nd warmest winter, followed by Delaware with its 3rd warmest and Pennsylvania with its 5th warmest. Maryland had its 6th warmest winter, while West Virginia had its 10th warmest. State departures ranged from 3.2 degrees F (1.8 degrees C) above normal in West Virginia to 6.8 degrees F (3.8 degrees C) above normal in New Hampshire. Eight of the region's 35 major airport climate sites also had a record warm winter.
- February brought above-normal precipitation to the Northeast. The region picked up 4.25 inches (107.95 mm) of precipitation, 157 percent of normal, which made it the 9th wettest February since recordkeeping began. All twelve states were wetter than normal, with eight states ranking the month among their top 20 wettest: Vermont, 4th wettest; New York, 7th wettest; New Hampshire, 8th wettest; Maine, 9th wettest; Pennsylvania, 13th wettest; Massachusetts, 16th wettest; Connecticut, 18th wettest; and Rhode Island, 19th wettest. State departures ranged from 120 percent of normal in West Virginia to 184 percent of normal in Vermont. Winter also ended on the wet side of normal. The region received 11.13 inches (282.70 mm) of precipitation, 121 percent of normal. All states saw above-normal precipitation, with departures ranging from 103 percent of normal in Connecticut to 134 percent of normal in Maine. Vermont had its 11th wettest winter, followed by Maine with its 15th wettest and New Hampshire with its 19th wettest. Binghamton, NY and Albany, NY both had their least snowy winter on record.
- At the start of February, 25 percent of the Northeast was abnormally dry, with another 3 percent of the region experiencing moderate drought conditions. Above-normal precipitation during the month eased dryness. According to the U.S. Drought Monitor from February 25, 14 percent of the region was abnormally dry, with 2 percent of the region experiencing moderate drought conditions.
- On February 8, a storm dropped up to 11 inches (28 cm) of snow on coastal areas from New York to Maine. Wind gusts to 65 mph (29 m/s) caused blizzard conditions in parts of Massachusetts. Coastal flooding and beach erosion also occurred. Arctic air moved into the Northeast for a few days mid-month. Binghamton, NY; Islip, NY; and Bridgeport, CT each had their all-time coldest February temperature on record. From February 15 to 16, a storm brought up to 22 inches (56 cm) of snow, up to 3 inches (76 mm) of rain, and up-to 0.5 inches (1.3 cm) of ice to the region. Rochester, NY had its fifth largest one-day snowfall on record with 18.3 inches on the 16th. Wind gusts of up to 77 mph (34 m/s) caused roof and siding damage, downed trees, and knocked out power. The mixed precipitation contributed to numerous accidents, while rain and snowmelt flooded roads. Hundreds of flights across the region had hours-long delays or were cancelled. A powerful storm produced two rare February tornadoes in Pennsylvania on the 24th. An EF-2 tornado, with winds up to 125 mph (56 m/s), damaged around 50 structures and caused an estimated $8 million in damage in Lancaster County. An EF-1 tornado, with winds to 100 mph (45 m/s), caused damage in Bradford County. Across the region, strong thunderstorm winds of up to 83 mph (37 m/s) downed trees and wires, damaged buildings, and left thousands of customers without power. Nickel-sized hail was also reported. Up to 4 inches (102 mm) of rain, and snowmelt and ice jams in some areas, led to numerous flooded roads, multiple evacuations and water rescues, and water in buildings. In addition, the storm dropped up to 8 inches (20 cm) of snow and up to 3/4 inch (1.9 cm) of ice on parts of the region.
- For more information, please go to the Northeast Regional Climate Center Home Page.
- Midwest Region: (Information provided by the Midwest Regional Climate Center)
- February temperatures were generally above normal in the Midwest. Though there were a couple cold spells in the first half of the month, most days were warm especially in the second half of the month. Monthly temperatures ranged from near normal in eastern Kentucky and northeast Minnesota to as much as 5 degrees F (3 C) above normal along the western edge of the region. Michigan ranked among the warmest 10 percent (1895-2016 period) while seven more states ranked among the warmest 25 percent of years with only Kentucky falling outside the top 25 percent. Winter (December to February) temperatures were well above normal across the region. Averaged across the region, winter temperatures ranked as the 5th warmest on record (1895 to 2016). Statewide winter temperatures ranked from 3rd to 7th in all nine states.
- February precipitation was mixed across the region. Dry conditions, with less than half of the normal precipitation for the month, extended through much of Missouri, eastern Iowa, central and northern Illinois, and southern Wisconsin. Areas with above normal precipitation, over 150 percent of normal included northwest Iowa, along the shores of the Great Lakes, and the eastern Ohio River valley and eastern Kentucky. Winter precipitation was above normal. The region as a whole ranked as the 6th wettest February on record (1895 to 2016) with Iowa setting a new record wettest for the same period. Illinois (11th), Michigan (tied for 9th), Missouri (8th), and Wisconsin (2nd) ranked among the wettest 10 percent in their respective histories. Snowfall for the month was above normal from western Iowa to Upper Michigan, from St. Louis, Missouri to Lower Michigan, and from central Kentucky to southern Ohio. Snowfall was below normal in the other areas of the region. Snowfall for the year (July 1 to February 29) was below normal in most Midwest location except for northern and western Iowa and much of Kentucky. Northern Michigan was well below normal for the year. Southwest Missouri received less than 25 percent of normal during this period.
- The Midwest remained drought free for nine straight weeks. As of the March 1 Drought Monitor,. less than 1 percent of the Midwest was classified as abnormally dry. Dryness in Missouri led to grassland fires in February. However, heavy rains in late December provided sufficient moisture to keep drought at bay throughout the winter.
- Even with warmer than normal temperatures for the month, several storms moved across the region bringing blizzard conditions in some cases. February snow storms included: Iowa to Upper Michigan on the 1st through on the 1st to 3rd. Blizzard condition hit northwest Iowa and southern Minnesota on the 7th and 8th despite very little new snow but strong winds whipped up snow on the ground from the previous storm. On the 24th and 25th blizzard conditions are reported in parts of Illinois and Indian while Michigan had the heaviest snow from the event. And lastly, a storm on the 29th dropped snow along the Iowa-Minnesota border and eastward to southern Michigan.
- Two widespread wind events affected the Midwest in the latter half of February. On the 19th, Wind gusts of over 50 miles per hour (82 km per hour) were common across the area and led to the evacuation of some tall office buildings in Chicago. Another wind event on the 29th caused damage in multiple Midwest states.
- For further details on the weather and climate events in the Midwest, see the weekly and monthly reports at the Midwest Climate Watch page.
- Southeast Region: (Information provided by the Southeast Regional Climate Center)
- Temperatures ranged from slightly below average to slightly above average across the Southeast region, with very few extremes observed during February. Mean temperatures were 1 to 3 degrees F (0.6 to 1.7 degrees C) below average across much of Florida as well as portions of southern Georgia, coastal South Carolina, western North Carolina, and western Virginia. In contrast, mean temperatures were 1 to 3 degrees F above average across much of Alabama and portions of northwestern Georgia. There were no long-term (i.e. period of record exceeding 50 years) stations across the mainland portion of the region with monthly mean temperatures that were ranked within the top 5 coldest or warmest values. Temperatures were well above average in Puerto Rico and the U.S. Virgin Islands, as Juncos, PR (1931-2016) observed its second warmest February mean temperature on record. Across the Southeast, the warmest weather of the month occurred on the 2nd and 3rd, as a warm front surged northward ahead of an approaching mid-latitude cyclone. During this two-day period, daily maximum temperatures exceeded 70 degrees F (21.1 degrees C) and daily minimum temperatures remained above 50 degrees F (10 degrees C) across a broad portion of the region. In contrast, the coldest weather of the month occurred on the 10th, 11th, and 14th, as continental Arctic air masses were advected over the region from the northwest. Daily minimum temperatures on the 10th and 11th fell below 30 degrees F (-1.1 degrees C) across much of the region north of central Florida, while numerous locations in Virginia and western North Carolina recorded minimum temperatures below 10 degrees F (-12.2 degrees C) on the 14th.
- Precipitation ranged from slightly below normal to significantly above normal across the Southeast region during February, with a few extremes recorded. The driest locations were found across localized areas of coastal Alabama, central Georgia, and central Florida, where monthly precipitation totals were about 50 percent of normal. In contrast, the wettest locations were found across much of Virginia, coastal North and South Carolina, and more localized portions of southeastern Georgia, Alabama, and southern Florida. Monthly precipitation totals were between 150 and 300 percent of normal in these areas. Wilmington, NC (1871-2016) and Cape Hatteras, NC (1893-2016) observed their third wettest February on record with 7.62 (194 mm) and 8.24 inches (209 mm) of precipitation, respectively. In addition, Wilmington observed its third wettest February day on record with 3.21 inches (81.5 mm) of precipitation on the 4th. On the same day, Hawkinsville, GA (1893-2016), a town located about 40 miles south of Macon, observed its wettest February day on record with 3.90 inches (99.1 mm) of precipitation. Precipitation was generally above normal across Puerto Rico and the U.S. Virgin Islands during the month, especially in the northwestern portion of Puerto Rico. Measurable snowfall was recorded in every state with the exception of Florida, and Beech Mountain, NC observed the greatest monthly snowfall total across the region at 39.5 inches (1,003 mm).
- There were 441 severe weather reports across the Southeast during February, which is nearly four times greater than the median monthly frequency of 116 reports during 2000-2014. Nearly all of the reports within the region were recorded on 6 days during the month, and the greatest number of reports (295; 67% of total) were associated with a severe weather outbreak on the 23rd and 24th. At least 15 severe weather reports were recorded in every state across the region during the month, with the greatest number (130; 29% of total) occurring in North Carolina. Several damaging thunderstorm wind gusts were observed across the region, particularly in North Carolina. On the 24th, thunderstorm wind gusts estimated at 75 mph caused a mobile home near Maxton, NC to roll over several times, resulting in injuries to two residents. On the same day, large hail with a 2.5-inch (tennis ball-sized) to 3-inch (tea cup-sized) diameter was observed in Granville and Vance Counties in North Carolina, and 3-inch hail was also reported in Mecklenburg County, VA. A total of 53 tornadoes (17 EF-0s, 29 EF-1s, 3 EF-2s, 4 EF-3s) were confirmed during the month, which is the greatest February tornado count for the region since modern records (based on the Storm Prediction Center tornado database) began in 1950. At least two tornadoes were observed in every state across the region, with the greatest number (20; 38% of total) occurring in Alabama. On the 15th, an EF-3 tornado touched down in the western tip of the Florida Panhandle and tracked 16.5 miles northeastward into southern Alabama. Numerous homes in the town of Century, FL were damaged or destroyed, and three injuries were reported. Thirty-three of the 53 tornadoes observed during the month occurred within a two-day severe weather outbreak on the 23rd and 24th. On the 23rd, an EF-3 tornado touched down in Pensacola, FL, resulting in 3 reported injuries. Numerous homes and apartment buildings were significantly damaged or destroyed, and a warehouse at the local General Electric plant was demolished. The next day, another EF-3 tornado, with a maximum path width of 500 yards, tracked 30 miles across four counties in east-central Virginia and injured at least 25 people. A total of 4 fatalities and at least 49 injuries were caused by tornadoes during February. Numerous reports of high non-convective winds were also recorded during the month. On the 24th, non-convective wind gusts exceeding 50 mph knocked down a tree at North Harlem Elementary School near Augusta, GA, resulting in injuries to four children.
- Drought conditions (D1 and greater) were not observed across the Southeast region (excluding Puerto Rico) during February. Extreme (D3) drought conditions were eliminated across southeastern Puerto Rico, and the extent of moderate-to-severe (D1 through D2) drought conditions across eastern and southern portions of Puerto Rico decreased 18 percent by the end of the month. Slightly below-average temperatures during February improved the quality of the strawberry crop in Florida, but the cool temperatures and excessive rainfall also reduced cabbage yields across parts of the state. A continued lack of sufficient chilling hours in portions of central and southern Alabama could result in an overextended period of blooming in peach orchards, which would require a longer and more costly harvest for farmers. Above-normal rainfall during the month may delay the planting of corn and peanut crops across portions of southern Georgia due to excessively wet, disease-prone field conditions.
- For more information, please go to the Southeast Regional Climate Center Home Page.
- High Plains Region: (Information provided by the High Plains Regional Climate Center )
- February was a very warm month across much of the High Plains. Except for western Colorado, most of the region experienced temperatures that were 3.0-12.0 degrees F (1.7-6.7 degrees C) above normal. North Dakota endured the greatest departures. Bismarck, for example, was an astounding 14.4 degrees F (8.0 degrees C) above normal for the month. The warm temperatures caused winter wheat to prematurely break dormancy in some locations, which leaves the crop susceptible to spring freezes. The presence of El Niño and a positive Arctic Oscillation are likely partly to blame for the warmth, especially in the northern Plains. Additionally, the lack of snow cover across much of the region allowed temperatures to soar higher. Overall, it can be said that most of the High Plains experienced a mild winter.
- February was also quite windy across the region. Warm, dry, and windy conditions later in the month combined to elevate fire danger in many locations. With the passage of a strong storm system, it was not uncommon to experience wind gusts of 60 mph (97 km/hr) or higher. The most impressive wind gust occurred at Monarch Pass, Colorado. On the evening of the 18th, the Monarch Pass AWOS weather station, which is located at 12,031 feet above sea level, reported a wind gust of 148 mph (238 km/hr)! The Colorado State Climatologist stated that the wind gust at Monarch Pass surpassed the unofficial state record for highest recorded wind gust, which was previously 147 mph (237 km/hr) and occurred in Boulder on January 25, 1971. Now that's windy!
- Precipitation was variable across the region in February. Snowpack continued to suffer in northern Wyoming, which has been warm and dry since the fall. However, the wet pattern continued across northern Kansas and eastern Nebraska, which was aided by a major winter storm that arrived just in time for Groundhog Day. Lincoln, Nebraska and Clay Center, Kansas had their wettest winters on record, while Omaha, Nebraska experienced its 2nd wettest. While it was a snowy winter in eastern Wyoming, only 0.5 inches (1 cm) of snow was recorded the entire season in Wichita, Kansas.
- Above normal temperatures were prominent across most of the region in February, as there were many places that experienced a top 10 warmest February and/or highest February temperature on record. The Dakotas continued to be particularly warm, with temperatures generally ranging from 6.0-9.0 degrees F (3.3-5.0 degrees C) above normal and even over 10.0 degrees (5.6 degrees C) above normal in a few locations. Two warm spells that occurred on the 18th and the 27th caused several highest February temperature records to be broken regionwide. One location that was particularly warm was Bismarck, North Dakota. Bismarck had its 2nd warmest February and 6th warmest winter on record (period of record 1875-2016). It reached 73 degrees F (22.8 degrees C) on the 27th, which was the highest February temperature ever recorded and the earliest day that Bismarck has ever reached 70 degrees F (21.1 degrees C) (previous earliest day was March 1, 1992). It was so warm in Kansas on the 18th that Goodland had its 2nd earliest 80 degrees F (26.7 degrees C) day, which was only one day later than the record of February 17, 1970 (period of record 1895-2016).
- With the exception of western Colorado, the High Plains Region experienced a warmer than normal winter. North Dakota endured the greatest temperature departures for the season. The following locations had a top 5 warmest winter in 2015-16: Minot, ND (warmest); Wichita, KS (2nd warmest); Williston, ND (4th warmest); Aberdeen, SD (5th warmest); Sheridan, WY (5th warmest); and Topeka, KS (5th warmest). A strong El Niño, a positive Arctic Oscillation, and low Plains snowpack are factors that likely contributed to the winter warmth.
- February brought a mixture of above and below normal precipitation to the High Plains. Precipitation records for the month were not nearly as plentiful as temperature records, but there were certainly some noteworthy precipitation events. Perhaps the most notable event was a winter storm that had the greatest impact on northeastern Colorado, northwestern Kansas, and central Nebraska on February 1 and 2. High winds accompanied the storm, creating blizzard conditions, snow drifts, power outages, and the closure of Interstate 80 across much of Nebraska. In Grand Island, Nebraska, 17.0 inches (43 cm) of snow fell on the 2nd, which was the highest 1-day total snowfall ever recorded in the month of February and the 2nd highest 1-day total snowfall ever recorded in any month (period of record 1895-2016). The storm total snowfall amounted to 18.3 inches (46 cm) and, according to the National Weather Service in Hastings, Nebraska, it was the 2nd largest snow event on record - second only to the March 19-21, 2006 storm in which 21.6 inches (55 cm) of snow fell. In the Dakotas, a blizzard struck on the 7th that did not bring impressive snow totals, but rather very high winds. Two locations in South Dakota - Wasta and Scenic - reported a peak wind gust of 78 mph (126 km/hr)! The National Weather Service office in Rapid City received reports of wind damage to trees, road signs, and RVs/campers around the area.
- Winter 2015-16 was very wet in several locations across the region, particularly in eastern Nebraska and northern Kansas. Lincoln, Nebraska and Clay Center, Kansas had their wettest winters on record. Lincoln recorded 6.01 inches (153 mm) of liquid equivalent precipitation, shattering its previous record of 5.22 inches (133 mm) during the winter of 1914-15 (period of record 1886-2016). Clay Center came in at 6.99 inches (178 mm) for the winter, beating its previous record of 6.87 inches (174 mm) in 1947-48 (period of record 1902-2016). Other notable locations with a top 10 wettest winter on record include Omaha, NE (2nd wettest); Norfolk, NE (4th wettest); Casper, WY (7th wettest); Grand Island, NE (8th wettest); and Colorado Springs, CO (10th wettest). As for snow, the winter was especially snowy in eastern Wyoming. Cheyenne and Casper both had their 6th snowiest winters on record (Cheyenne period of record 1883-2016, Casper period of record 1939-2016). On the contrary, Wichita, Kansas had its 3rd least snowiest winter on record (period of record 1889-2016) despite winter precipitation being 92 percent of normal, as much of Wichita's winter precipitation came as rain instead of snow.
- Colorado snowpack continued to fare well in February, although warmer temperatures brought the snow water equivalent down closer to 100 percent of median statewide by the end of the month. SNOTEL sites in northern Colorado were still reporting below 100 percent of median, and a few sites in the western and southern parts of the state that had been above 100 percent of median were reporting below 100 percent of median on February 29th. In Wyoming, warm and dry conditions caused the snowpack to decline across much of the state throughout the month, and snowpack conditions were still the worst in the Bighorn Mountains in northern Wyoming. This region has been in drought since December and conditions intensified during February.
- Degradations in drought conditions were more pronounced than improvements in the High Plains Region in February. By the end of the month, nearly 13 percent of Wyoming was in drought. Severe drought (D2) was introduced to an area in the Bighorn Mountains in northern Wyoming, and moderate drought (D1) developed in the Wind River Range in west-central Wyoming. Snowpack was still below normal in these areas, and the region also experienced a continuation of above normal temperatures that have been present since the fall.
- Dryness continued in North Dakota in February as well. Abnormally dry (D0) conditions expanded into northern and central North Dakota. Nearly 60 percent of the state was experiencing D0 or D1 conditions by the end of the month. The expansion of dryness was due to a lack of snow cover and above normal temperatures experienced in the region over the past couple of months. The area in D1 in southern North Dakota remained unchanged.
- According to the 2015 Nebraska Statewide Groundwater-Level Monitoring Report, groundwater levels in Nebraska are finally beginning to recover from the intense drought that struck the central Plains in 2012-13. Above normal precipitation and more efficient water use practices were credited for the recovery. However, the state has not yet recovered enough to reach 2012 groundwater levels, which illustrates the long-term hydrologic impacts of a severe drought.
- For more information, please go to the High Plains Regional Climate Center Home Page.
- Southern Region: (Information provided by the Southern Regional Climate Center)
- February average temperatures in the Southern Region were consistently above normal for all six states. Temperature anomalies were highest in northern Texas and throughout much of Oklahoma, with most stations in that area averaging between 4 to 8 degrees F (2.22-4.44 degrees C) above normal. Elsewhere in the region, most stations averaged between 2 to 4 degrees F (1.11-2.22 degrees C) above expected values, except for in Tennessee, where temperatures generally averaged between 0 to 2 degrees F (0.00-1.11 degrees C) above the long term mean. The statewide monthly average temperatures were as follows: Arkansas reporting 46.90 degrees F (8.28 degrees C), Louisiana reporting 55.00 degrees F (12.78 degrees C), Mississippi reporting 50.80 (10.44 degrees C), Oklahoma reporting 47.30 degrees F (8.50 degrees C), Tennessee reporting 42.40 degrees F (5.78 degrees C), and Texas reporting 54.30 degrees F (12.39 degrees C). All state rankings fell on the warmer side of normal. Oklahoma experienced their eighth warmest February on Record, while Texas recorded their eleventh warmest. Arkansas experienced their twenty-fourth warmest February on record. For Louisiana, it was the thirty-second warmest February on record, and the thirty-third warmest February for Mississippi. Lastly, it was the fortieth warmest February for the state of Tennessee. All state rankings are based on the period spanning 1895-2016.
- Precipitation totals across the Southern Region varied spatially in the month of February, with Mississippi and Tennessee experiencing a wetter than normal month. The remaining four states to the west experienced a drier than normal month. The driest portions of the region included much of Oklahoma and western Texas, the extreme south of Texas, and northwestern Arkansas. Stations in these areas typically averaged less than half the normal precipitation, with many stations recording less than twenty-five percent of normal. Eastern Tennessee represents the wettest portion of the region, with stations averaging over one and a half times the normal precipitation. The state-wide precipitation totals for the month are as follows: Arkansas reporting 2.49 inches (63.25 mm), Louisiana reporting 3.27 inches (83.06 mm), Mississippi reporting 5.38 inches (136.65 mm), Oklahoma reporting 0.88 inches (22.35 mm), Tennessee reporting 5.70 inches (144.78 mm), and Texas reporting 1.05 inches (26.67 mm). The state precipitation rankings for the month are as follows: Arkansas (thirty-first driest), Louisiana (thirty-sixth driest), Mississippi (forty-ninth wettest), Oklahoma (thirtieth driest), Tennessee (twenty-sixth wettest), and Texas (thirty-sixth driest). All state rankings are based on the period spanning 1895-2016.
- February was a drier than normal month for Texas, Oklahoma, Arkansas and Louisiana. Though this is the second consecutive dry month, the Southern Region remains drought-free. Some small pockets of abnormally dry (D0) have been identified and will be closely monitored by the National Drought Mitigation's Drought Monitor Team.
- On February 2, 2016, several tornadoes were reported in east central Mississippi. These were the result of thunderstorm activity from a cold front that passed through the region. Damage was reported in the following counties: Newton, Lauderdale, Kemper, and in Crockett County, Tennessee, where one injury was reported.
- On February 15, 2016, several tornadoes were reported in an area spanning south western Louisiana to central Mississippi. Two people were reported injured in Walthall County, Mississippi. Though some structural damage was reported in the area of the storms, most damage was limited to trees and power lines.
- A cold front produced several severe thunderstorms on February 23, 2016. These storms wreaked havoc in southern Louisiana and central Mississippi. Two fatalities were reported in St. James Parish, Louisiana from an EF-3 rated twister. Gold's Gym in Prairieville, Louisiana suffered major damage while the gym was in use, and fortunately no one was seriously injured. Another fatality was reported in Lamar County, Mississippi. Significant damage was reported in several counties throughout the area of these storms.
- In Texas, the warmer weather did have positive impacts on Texas state parks. Most state parks saw an increase in attendance during the winter, with some parks having increases upwards of twenty-five percent. Residents of San Marcos are relieved to hear federal funding will be heading their way after the floods of 2015. $25 million dollars will most likely be put towards flood control projects and home buyouts, with another allotment for public infrastructure in Van Zandt County. El Niño conditions are currently present in the tropical Pacific, though rain and temperatures have not necessarily been in line with typical El Niño events. According to the State Climatologist, average rainfall accumulations could still be above normal for the winter. There is still a chance to see El Niño conditions with it holding its own in the Pacific Ocean, but forecasters are now determining if a role reversal into a La Niña will occur. La Niña is associated with warmer, drier weather during the winter months. Red flag warnings and burn bans were a common occurrence in the Texas Panhandle and across the northern half of the state, with a 1,700 acre (6.88 sq km) fire breaking out near Amarillo. Dry conditions also impacted agriculture during the month. Cotton acreage is expected to increase compared to 2015 numbers, and farmers in the Panhandle are hoping continued warm conditions will help prevent stripe rust outbreaks. However, short bursts of very wet and very dry conditions have harmed East Texas farmers, with some estimates expecting revenues to drop from $115 million to $75 million. Vegetable farmers are crossing their fingers dry conditions persist through the end of the growing season. (Information provided by the Texas Office of State Climatology).
- For more information, please go to the Southern Regional Climate Center Home Page.
- Western Region: (Information provided by the Western Region Climate Center)
- In contrast with January's procession of storms, high pressure was present over the West much of this month. Persistent ridges yielded above normal temperatures and below normal precipitation for much of the region. In contrast with the anticipated strong El Niño wintertime precipitation pattern (dry in northwest, wet in southwest), southern California and Arizona were much drier than normal while western Washington, northern Idaho, and eastern Montana observed above normal precipitation this month.
- February temperatures were quite warm in many areas of the West, especially in Montana and Wyoming where average daily temperatures exceeded 20 F (11 C) above normal on several days. Miles City, Montana saw its warmest February at 37.5 F (3 C), 13.1 F (7.3 C) above normal, where records began in 1937. Temperatures in Worland, Wyoming averaged 33.4 F (0.8 C), 9.2 F (5.1 C) above normal, the 4th warmest February since records began in 1960. To the southwest, Los Angeles, California, averaged 64.9 F (18.3 C), 6 F (3.3 C) above normal and 2nd warmest in a 140-year record. Nearby Camarillo reported its warmest February since records began in 1952 at 62.5 F (16.9 C), 8.8 F (4.8 C) above normal, and also observed its highest February temperature on record at 91 F (32.8 C) on the 9th and 15th. San Diego noted its warmest February on record at 63.9 F (17.7 C), 6 F (3.3 C) above normal, where records began in 1939. In Phoenix, Arizona, temperatures averaged to 65.7 F (18.7 C), the second warmest February on record. Phoenix also observed its earliest day reaching 90 F (32.2 C) on February 17; the previous record was February 24 in 1904 and 1986. Portions of the eastern Great Basin and southern Utah experienced cooler than normal temperatures, likely due to strong inversion conditions that developed under the high-pressure ridge. Temperatures in Deseret, central Utah, averaged to 27.7 F (-2.4 C), 5.2 F (2.9 C) below normal.
- Precipitation throughout California was below normal this month, raising concerns for water resources and drought amelioration. Shasta Dam, on California's largest reservoir, observed 2.99 in (76 mm), 26% of normal and its 15th driest February since records began in 1943. Southern California was very dry, where San Diego received a scant 0.05 in (1 mm), 2% of normal and the 3rd driest February since records began in 1933. Elsewhere in the Southwest, Phoenix observed no precipitation this month, as in six other years in its 84-year record. Normal precipitation there is 0.92 in (23 mm). Below normal precipitation was also observed in parts of the Intermountain West. Pocatello, Idaho, reported 0.2 in (5 mm), 21% of normal and the 4th driest since records began in 1939. Dry and warm conditions depleted snowpack in much of the West. Sierra Nevada snowpack fell from 116% to 83% of average during the month. A majority of basins in the Intermountain West reported near-normal snowpack, though percentages also fell there during the month. Basins in northern Wyoming continue to report below normal snowpack as in January. Expansion of drought conditions this month was limited to only small areas of Arizona, New Mexico, and Wyoming.
- By contrast, western Washington, eastern Montana, and Colorado's Front Range observed slightly to well above normal precipitation. Seattle recorded 5.97 in (152 mm) rainfall, 170% of normal and 10th wettest February since records began in 1945. Near normal Cascades snowpack in concert with a wet January helped to ease drought conditions in far northern California and southern Oregon. Parts of Colorado east of the Rockies were also moist; Colorado Springs had its 4th wettest February in a 69-year record at 1.0 in (25 mm), 294% of normal. Boulder observed 21.8 in (55 cm), the 12th snowiest since 1893. In southeastern Montana, Moorhead recorded 1.02 in (26 mm) precipitation, 408% of normal, the 3rd wettest February since records began in 1958.
- Alaska was significantly warm for a second consecutive month. Barrow and Anchorage both observed their 4th warmest February on record at -4.1 F (-20 C) and 29.9 F (-1.2 C), respectively. The December-February period has been the warmest on record at Barrow and 2nd warmest at Anchorage. Dry conditions prevailed across Interior and Western Alaska, though some areas in the south were above normal. Kodiak's 12.88 in (327 mm), was 210% of normal and 2nd wettest February since records began in 1931. In Hawaii, dry conditions persisted this month, typical of an El Niño winter. Honolulu observed 0.40 in (10 mm) of rainfall, 20% of normal and the 6th driest in a 77-year record. The last 3 months have been the driest December-February period on record for Honolulu.
- February 15-19: Warm weather triggers snowmelt, flooding in central Washington and eastern Nevada: Minor to moderate flooding occurred along the Yakima River and its tributaries in response to snow melt driven by warm conditions. In eastern Nevada, well-traveled rural roads in Elko County saw minor to moderate flooding due to snow melt. Flooding is not uncommon in these areas, but is typically a springtime phenomena.
- February (throughout month): Brush fires in Hawaii: A brush fire started on the 15th on the south slopes of Haleakala, Maui, and burned roughly 5,500 acres (2225 hectares), with flare-ups still occurring near the end of the month. On Big Island, brush fires consuming more than 300 acres (121 hectares) occurred in South Kohala on February 11.
- February 18: Avalanches in Lake Tahoe area: Following 2+ feet (61+ cm) of new snowfall dangerous avalanche conditions were present in the Sierra Nevada in the vicinity of Lake Tahoe. Two vehicles were partially buried on Alpine Meadows Road and several ski resorts were closed or delayed in opening due to avalanche hazards.
- For more information, please go to the Western Regional Climate Center Home Page.
 NOAA's National Centers for Environmental Information
