Did You Know?
Regional Climate Centers
The regional sections of the U.S. State of the Climate report are written by NOAA's Regional Climate Centers (RCCs). These monthly updates provide the report with detail and relevance that would not be possible without the RCCs regional expertise and perspective. RCCs partner with NCEI, the National Weather Service, the American Association of State Climatologists, and NOAA Research Institutes to collectively deliver and improve climate services at the national, regional, and state level.

How RCCs support NOAA's climate services:
-
Regional expertise for many climate monitoring and assessment activities
- United States Drought Monitor (USDM)
- National Integrated Drought Information System (NIDIS)
- United States Forest Service (USFS) National Fire Assessments
-
Staying abreast of climate science
- National Academy of Science Panels
- American Meteorological Society Committees
- World Meteorological Organization (WMO) Workgroups
- Understanding regional implications of a changing climate
- Assessing and understanding climate extremes
-
Understanding and better managing climate data and observing systems
- National Data Stewardship Team
- Climate Reference Network (CRN) site surveys
- Datzilla
- WxCoder3
- Applied Climate Information System (ACIS)
- Working with partners, large and small, to improve climate services
National Overview:
- Temperature Highlights - May
- During May cooler-than-normal temperatures in the western U.S. were counterbalanced by warmer-than-normal temperatures in the east, creating a
 national temperature near the long-term average.
  Regionally, a persistent pattern with a high-pressure ridge (associated with warmer conditions) in the east and a western trough (cooler conditions) was especially evident. The
  Northeast and
  Southeast Climate regions each had their tenth warmest May on record, while the
  Northwest and
  West had their fifth and tenth coolest May, respectively.
 - On the
 state-to-state level,
  Idaho had its second coolest May on record, while it was
  Montana's fourth coolest,
  Wyoming's and
  Oregon's seventh coolest,
  Utah's eighth,
  California's ninth, and
  Nevada's tenth coolest such period.
  Rhode Island observed its second warmest May on record and
  Florida tied for its second warmest. Other states much warmer than normal during May included:
  Louisiana (4th warmest),
  Massachusetts (5th warmest),
  Connecticut (6th warmest),
  New Hampshire (7th warmest),
  Mississippi and
  New York (each 8th warmest), and
  New Jersey (9th warmest).
- The
 spring season (March-May) brought record warmth to the
  Northeast. Eight
  northeastern states experienced their warmest such period on record:
  Connecticut,
  Rhode Island,
  Maine,
  Massachusetts,
  New Hampshire,
  New Jersey,
  New York, and
  Vermont.
  Michigan also had its warmest spring period of the 116-year record. It was one of the ten warmest spring seasons for ten other states.
 - The
 profound warmth in the
  Northeast has dominated throughout 2010 to date.
  Maine,
  New Hampshire and
  Vermont each had their warmest January-May on record.
  Massachusetts and
  Rhode Island had their second warmest such period. Other significantly warm states for 2010 so far were
  New York (3rd warmest),
  Connecticut and
  Michigan (each 4th warmest),
  Wisconsin (5th warmest), and
  New Jersey (8th warmest). January-May 2010 has been among the ten coolest starts so far for
  Florida,
  Alabama and
  Georgia.
 - Precipitation Highlights - May
- May precipitation was variable across the contiguous U.S. with the national value averaging slightly
 above normal. The state of
  Washington had its third wettest May on record and extreme precipitation events in
  Tennessee and
  Kentucky contributed to their sixth and seventh wettest such period, respectively. It was the tenth wettest May in
  North Dakota.
  Springtime precipitation was especially lacking in
  Louisiana which experienced its fifth driest March-May period on record. On the flip side,
  Rhode Island had its second wettest spring and
  Massachusetts its tenth wettest.
- While parts of
 Arizona had record dryness during the month of May, the persistent wetness earlier in 2010 has contributed to an above normal
  year-to-date period. The same holds true for many surrounding states, like
  California,
  New Mexico and
  Texas.
 - Dryness in
 Michigan and
  Louisiana has persisted throughout 2010, resulting in the fifth driest January-May period on record for both states. The year-to-date period was also the sixth driest for
  Wisconsin. Conversely, very high precipitation during February and March contributed to
  Rhode Island's fifth wettest year-to-date period.
  Massachusetts also averaged much above normal precipitation, with its tenth wettest such period.
 - Other Items of Note
- A storm system that stagnated over the Lower Mississippi Valley on May 1st–2nd killed 29 people and flooded thousands of homes and businesses. The storms spawned dozens of tornadoes and brought record amounts of rain to numerous locations in Mississippi, Tennessee, and Arkansas. Preliminary reports indicated that more than 200 daily, monthly, and all-time precipitation records were broken across the three states. More details can be found within NCDC's Global Hazards page.
- For the second consecutive month, the Rutgers Snow Lab reported that the snowcover footprint over North America was the smallest on record for the month. A record-small snow footprint was also observed over Eurasia and the Northern Hemisphere as a whole.
- NCDC's Climate Extremes Index (CEI) for spring (March-May) was about 5 percent higher than average. The CEI measures the prevalence of several types of climate extremes (like record or near-record warmth, dry spells, or rainy periods). Factors contributing to spring's elevated values: widespread (2-3 times larger than average) coverage of anomalously warm daily max and min temperatures, and above-average extent of extreme one-day precipitation events.
- According to NOAA's Storm Prediction Center, tornadic activity in May was near normal with 290 preliminary tornado reports.
- Drought coverage decreased slightly during the month. The U.S. Drought Monitor reported that 8.6 percent of the United States was affected by drought on June 1st. Slight improvements were seen in the Tennessee and Ohio River valleys, while conditions deteriorated in Louisiana and Western Great Lakes.
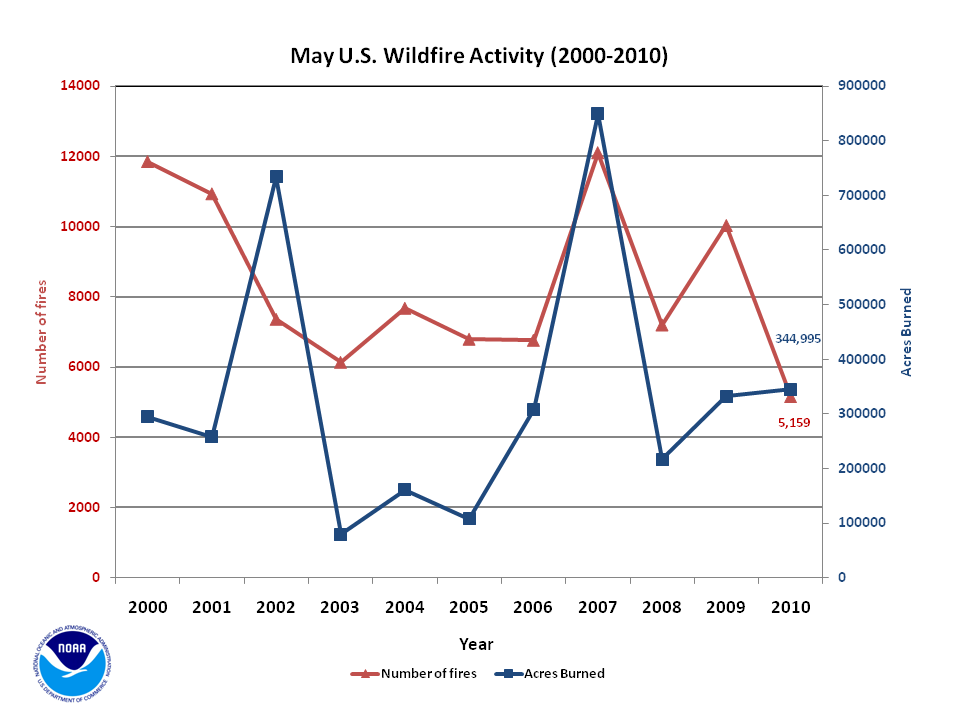
- The cool conditions across the western U.S. contributed to the low numbers of new wildfires during May. Only 5,159 new wildfires were reported during the month — the lowest May number in eleven years.
- Based on NOAA's Residential Energy Demand Temperature Index (REDTI), the contiguous U.S. temperature-related energy demand was 0.3 percent above average for May. The unusual warm spring in the highly populated Northeast resulted in the seventh lowest spring REDTI value in 116 years, 11.2 percent below average.
 national temperature
 Regionally
 Northeast
 Southeast
 Northwest
 West
West state-to-state level
 Idaho
Idaho Montana's
 Wyoming's
 Oregon's
 Utah's
 California's
 Nevada's
 Rhode Island
 Florida
 Louisiana
 Massachusetts
 Connecticut
 New Hampshire
 Mississippi
 New York
 New Jersey
 spring season
 Northeast
 northeastern states
 Connecticut
 Rhode Island
 Maine
Maine Massachusetts
 New Hampshire
 New Jersey
 New York
 Vermont
 Michigan
 profound warmth
 Northeast
 Maine
Maine New Hampshire
 Vermont
 Massachusetts
 Rhode Island
 New York
 Connecticut
 Michigan
 Wisconsin
 New Jersey
 Florida
 Alabama
 Georgia
 above normal
 Washington
 Tennessee
 Kentucky
 North Dakota
 Springtime precipitation
 Louisiana
 Rhode Island
 Massachusetts
 Arizona
 year-to-date period
 California
 New Mexico
 Texas
Texas Michigan
 Louisiana
 Wisconsin
 Rhode Island's
 Massachusetts
Beginning with January 2010 processing, the Alaska temperature and precipitation report is comprised of several datasets at NCDC, integrating GHCN and COOP datasets. Prior to 2010, the Alaskan temperature timeseries was processed with just GHCN data.
-
 Alaska
had its 11th warmest May since records began in 1918, with a
temperature 2.2°F (1.2°C) above the 1971–2000
average.
Alaska
had its 11th warmest May since records began in 1918, with a
temperature 2.2°F (1.2°C) above the 1971–2000
average.
-
 Alaska
had its 32nd warmest spring (March–May) on record, with a
temperature 0.7°F (0.4°C) above the 1971–2000
average.
Alaska
had its 32nd warmest spring (March–May) on record, with a
temperature 0.7°F (0.4°C) above the 1971–2000
average.
-
 Alaska
had its 26th warmest year–to–date on record, with a
temperature 1.4°F (0.8°C) above the 1971–2000
average.
Alaska
had its 26th warmest year–to–date on record, with a
temperature 1.4°F (0.8°C) above the 1971–2000
average.
-
 Alaska
had its 7th driest May since records began in 1918, with
an anomaly that was 35 percent below the 1971–2000
average.
Alaska
had its 7th driest May since records began in 1918, with
an anomaly that was 35 percent below the 1971–2000
average.
-
 Alaska
had its 43rd driest March–May on record, with
an anomaly that was 22 percent below the 1971–2000
average.
Alaska
had its 43rd driest March–May on record, with
an anomaly that was 22 percent below the 1971–2000
average.
-
 Alaska
had its 18th driest year–to–date on record, with
an anomaly that was 15 percent below the 1971–2000
average.
Alaska
had its 18th driest year–to–date on record, with
an anomaly that was 15 percent below the 1971–2000
average.
For additional details about recent temperatures and precipitation across the U.S., see the Regional Highlights section below. For information on local temperature and precipitation records during the month, please visit NCDC's Records page. For details and graphics on weather events across the U.S. and the globe please visit NCDC's Global Hazards page.
Regional Highlights:
These regional summaries were provided by the six Regional Climate Centers and reflect conditions in their respective regions. These six regions differ spatially from the nine climatic regions of the National Climatic Data Center.
- Northeast Region: (Information provided by the Northeast Regional Climate Center)
- Temperatures in the Northeast averaged above normal for the fifth consecutive month in May. It was also the third month in a row with above normal temperature averages in each of the twelve states in the region. Overall, the average for May was 59.6 degrees F (15.3 degrees C). This was 3.2 degrees F (1.8 degrees C) warmer than normal and 3.1 degrees F (1.7 degrees C) warmer than the same month in 2009. It was the 11th warmest May in 116 years. Departures among the states ranged from 2.5 degrees F (1.4 degrees C) above normal in Vermont to 4.0 degrees F (2.2 degrees C) warmer than normal in Rhode Island where it was the 2nd warmest May since 1895. Five other states placed in the top ten warmest on record this month: Massachusetts, 5th; Connecticut, 6th; New Hampshire, 7th; New York, 8th; and New Jersey, 9th. Many new temperature records were set as the mercury soared into the 90's (degrees F, 30's degrees C) during the first and last weeks of the month and fell below freezing between the 10th and the 13th. Hartford, CT was notable for the two new records set at that location. On the 11th, the low of 29 degrees F (-1.7 degrees C) broke the previous record of 32 degrees F (0 degrees C) set in 1966 and 2 weeks later, the 1965 record of 94 degrees F (34.4 degrees C) fell when the high reached 99 degrees F (37.2 degrees C) on the 26th.
- After three consecutive months of above normal temperatures, it was a sure thing that the average for Spring 2010 (March-May) would be warmer than normal. The regional average was 50.1 degrees F (10.1 degrees C), which was 4.6 degrees F (2.6 degrees C) above normal, and it was the 2nd warmest spring since 1895. It was the warmest spring in 8 states: Connecticut, Maine, Massachusetts, New Hampshire, New Jersey, New York, Rhode Island, and Vermont. Delaware and Pennsylvania saw their 2nd warmest spring since recordkeeping began 116 years ago; Maryland, its 5th warmest; and West Virginia had its 9th warmest spring. Nineteen of the 35 first order stations in the region had their warmest spring since 1895 and all were within the top 12 warmest on record.
- May was a dry month in the Northeast. The average precipitation for the region was 3.08 inches (78.2 mm), or 77 percent of normal. Only West Virginia posted a total that was above normal, 118 percent. The driest states were Delaware, with 42 percent of the normal May amount and Maine, with a precipitation total that was 50 percent of normal.
- The 3-month average for Spring 2010 was 9.90 inches (251.5 mm), which was 89 percent of normal. Of the seven states with below normal averages, New York was the driest, with 76 percent of the normal spring total. It was the19th driest spring since 1895 in the Empire State. Among the major cities in the state, it was the 10th driest spring in Syracuse since 1902 and the 14th driest in Albany since 1874. Vermont's precipitation total was exactly normal and the remaining states, Massachusetts, New Hampshire, New Jersey, and Rhode Island had 3-month totals that were above normal. Rhode Island was the wettest of the group with 160 percent of normal precipitation. The Ocean State's 3-month total of 20.32 inches (516.1 mm), mainly due to the record-breaking rainfall (15.44 inches, 392.2 mm) in March, made this the 2nd wettest spring since 1895. A spring total of 21.04 inches (534.4 mm), gave Providence its 2nd wettest spring since 1905 and, with a three-month total of 19.55 inches (496.6 mm), Boston, MA had its 5th wettest spring since 1872.
- Below normal precipitation in April and May left a large portion of the Northeast with abnormally dry conditions, according to the June 1, 2010 US Drought Monitor. Southern Maine, northern Massachusetts and New York, western Pennsylvania and all of New Hampshire and Vermont were the areas affected. A small area east of Lake Ontario was experiencing moderate drought conditions. In spite of the dryness, most state reports to the National Agricultural Statistics Service (http://www.nass.usda.gov/Publications/State_Crop_Progress_and_Condition/index.asp) told of above normal crop progress, good working conditions and a concern for potential fruit crop damage due to the early warmth and subsequent frost/freeze that occurred in May.
- At the end of May, much of Maine was under a red flag warning for forest and brush fires. At the same time, smoke from fires in Quebec resulted in air quality alerts and reduced visibility from eastern New York to southeastern New England.
- For more information, please go to the Northeast Regional Climate Center Home Page.
- Midwest Region: (Information provided by the Midwest Regional Climate Center)
- Much cooler than normal weather held over most of the corn and soybean belt the first two weeks of May. Average daily temperatures the first half of the month were from 2 degrees F to 3 degrees F (1.1 degrees C to 1.7 degrees C) above normal along and south of the Ohio River. However, temperatures northwest of the Ohio River were from near normal from southwestern Missouri through central Illinois and Indiana, falling off to 6 degrees F to 8 degrees F (3.3 degrees C to 4.4 degrees ) below normal in western Iowa and Minnesota. The second half of the month saw little change in the Ohio Valley, but temperatures in the remainder of the region were near to much above normal, as much as 10 degrees F (5.6 degrees C) above normal in the eastern Michigan Upper Peninsula. When all was said and done at the end of the month, temperatures ended up near normal along and west of the Mississippi River, and 2 degrees F to 4 degrees F (1.1 degrees C to 2.2 degrees C) above normal east and north. During the last week of the month 29 locations in the Midwest recorded their highest daily maximum temperatures for the month, including 97 degrees F (36.1 degrees C) at Cambridge, OH on May 29. The spring season (March, April, May) in the Midwest ranked in the top five warmest for six of the nine Midwestern states, and it was the warmest on record for Michigan. Spring average temperatures ranged from 1 degrees F (0.6 degrees C) above normal in much of Missouri to 5 degrees F to 6 degrees F (2.8 degrees C to 3.3 degrees C) above normal from northern Minnesota southeastward to northern Lower Michigan.
- Most of the region received normal to well above normal precipitation in May with the exception of a band from western Iowa northeastward across the Upper Peninsula of Michigan. Precipitation in this band was generally only 50 to 75 percent of normal. The area of Extreme Drought depicted on the U.S. Drought Monitor in northeastern Wisconsin and the Michigan U. P. expanded by the end of the month. In contrast, precipitation over northwestern Minnesota and much of Kentucky was twice normal. Thunderstorms that caused widespread flooding in Tennessee on May 1 extended into Kentucky dropping five to ten inches (254 mm) of rain in two days. The record-breaking rainfall was quickly followed by historic flooding along many rivers in Kentucky that in some cases took weeks to fall below flood stage. The two-day storm shattered one- and two-day rainfall records in many places and monthly totals approached all-time records for May. Bowling Green was hardest hit with 10.14 inches (258 mm) received at the Warren County Kentucky Mesonet station. Nearly five inches (127 mm) of rain fell each day in Bowling Green which ranks as the 6th (4.92 inches, 125 mm) and 8th (4.75 inches, 121 mm) highest daily rainfall totals since 1900. This storm was notable in that while most of the previous one- and two-day record rain events in the region were produced by systems that were tropical in origin, the May 1-2 storm was extratropical in nature. At least five people were killed across central Kentucky and damage estimates surpassed $30 million. Spring precipitation was normal to above normal from Missouri into the southeastern half of Iowa, northwestern Illinois, and across northern Indiana and southern Lower Michigan. Precipitation was 150 to 200 percent of normal across northwestern Minnesota. In contrast, precipitation was less than 50 percent of normal across the Upper Peninsula of Michigan.
- Snow fell in the upper Midwest the first week of May, with as much as five to seven inches (12.7 to 17.8 cm) in the Michigan U. P. The snow and cold weather in the upper Midwest caused serious damage to the ginseng crop in northern Wisconsin, with estimates that 80 to 90 percent of the 1,400 acres of crop was destroyed or damaged.
- For details on the weather and climate events of the Midwest, see the weekly summaries in the MRCC Midwest Climate Watch page.
- Southeast Region: (Information provided by the Southeast Regional Climate Center)
- For the second consecutive month, mean temperatures were above normal across the Southeast as maritime tropical air masses dominated the weather pattern. Departures from normal were generally 3 to 4 degrees F, with some locations as much as 5 degrees F above normal. For the fourth consecutive month, mean monthly temperatures were above normal across Puerto Rico. It was the warmest May in a 63-year record at Miami International Airport. Other parts of south Florida experienced near-record warmth; it was the second warmest May on record at Naples, FL and third warmest May at both Fort Lauderdale, FL and West Palm Beach, FL. Much of this warmth was tied to unusually warm overnight temperatures. Remarkably, there were 798 record daily high minimum temperatures tied or broken during the month. Roxboro, NC registered a minimum temperature of 75 degrees F (24 degrees C) on the 3rd of the month, which set the record for the warmest minimum temperature for any day in May. On the 31st of the month, Key West Intl Airport, FL registered a minimum temperature of 82 degrees F (28 degrees C), which tied the warmest minimum temperature for any day in May. Very few unseasonably cool days were experienced across the region; only 68 and 16 record low maximum and record low minimum temperatures were recorded for the month, respectively. A number of locations across the region experienced their warmest meteorological spring (March-May) on record. These included Washington-Dulles Airport in Virginia, Savannah Intl Airport in Georgia, Richmond Intl Airport in Virginia, and Juncos, PR.
- Precipitation was highly variable across the Southeast in May. Though the monthly average for the region as a whole was close to normal, there were many locations that were exceptionally wet (more than 300 percent of normal) and others that were exceptionally dry (less than 10 percent of normal). The precipitation pattern across the region was driven primarily by scattered showers and thunderstorms, some of which produced prodigious rainfall totals. On the 17th of the month, an isolated storm dropped over 2 inches (50.8 mm) of rainfall in one hour in downtown Columbia, SC, resulting in major flooding and damage to vehicles and buildings. In most areas, precipitation totals were 100-150 percent of normal across central North Carolina, central Alabama, and northern Florida. Within these regions there were localized areas where precipitation was as much as 250 percent of normal. The wettest locations were found in central and southern Georgia, where precipitation for the month was between 250 to more than 300 percent of normal. San Juan, PR experienced the 4th wettest May on record; this is now the wettest start to a calendar year ever at that location. In contrast, monthly precipitation was between 25 and 75 percent of normal across much of Virginia, western North Carolina, and along the Atlantic coast from southeast Virginia to northeast Florida. The driest locations (less than 10 percent of normal) were found along the south Florida coast and in the Pamlico Sound region of eastern North Carolina. New Bern, NC and Melbourne, FL experienced their 3rd driest May in records extending to 1948 and 1937, respectively.
- There were 333 reports of severe weather across the Southeast in May. Interestingly, there was only one tornado report in the region. This is quite a change from 2008 and 2009, when the Southeast experienced 69 and 59 tornadoes in the month of May, respectively. The one tornado in May 2010, an EF-1, occurred in Fairfield County, SC as part of a severe weather outbreak on the 2nd and 3rd of the month that included golf ball-sized hail and high winds across South Carolina, Georgia, and Alabama. The approach of a cold front on the 6th of the month triggered large hail in northwestern South Carolina and high winds in central North Carolina. On the 12th of the month, a line of strong storms moving east out of the Ohio River Valley produced numerous high wind reports across central Virginia. Another storm system and frontal passage brought damaging wind and hail to Virginia and the Carolinas between the 14th and 17th of the month.
- The beneficial rainfall during the month helped to eliminate the areas of abnormal dryness (D0) in northern and southern Alabama and in central North Carolina. Much of central South Carolina and eastern North Carolina, however, remained abnormally dry. This created concern among farmers in these regions, who are reaching critical planting periods for crops such as corn and soybean. In contrast, many farmers in Georgia reported a bumper peach crop in May due to the late spring warmth and above normal rainfall.
- For more information, please go to the Southeast Regional Climate Center Home Page.
- High Plains Region: (Information provided by the High Plains Regional Climate Center)
- May 2010 was cooler than normal across the Region. For most of the month, average temperatures were below normal, but the end of the month was characterized by above normal temperatures. Despite the warm temperatures, temperature departures were below normal overall. The largest temperature departures occurred in eastern North Dakota and Wyoming where temperature departures were 4-8 degrees F (2.2-4.4 degrees C) below normal. Many locations in Wyoming ranked in the top 10 coolest Mays on record. Worland, Wyoming was this month's record breaking location with an average temperature of 50.0 degrees F (10.0 degrees C) which was 7.7 degrees F (4.3 degrees C) below normal. This beat out the old record of 52.4 degrees F (11.3 degrees C) recorded in May 1983 (period of record 1960-2010).
- Precipitation was variable over the Region this month. A large swath of below normal precipitation stretched from the four corners region northeast through portions of Nebraska, Kansas, and South Dakota. Western Wyoming, where drought conditions are ongoing also received below normal precipitation. Areas receiving at least 150 percent of normal include much of North Dakota, western and central South Dakota, central Wyoming, and pockets of Kansas. The precipitation in south central Kansas and western North Dakota helped eliminate the abnormally dry conditions which had developed last month. May 2010 was filled with a wide range of weather. Heavy snows across Nebraska, Colorado, and Wyoming led to record breaking seasonal snowfall totals in some locations. Meanwhile, 676 preliminary storm reports in the High Plains Region were received by the Storm Prediction Center. Of these reports 102 were tornado reports, 349 were hail reports, and 225 were wind reports. One strong storm occurred May 11-12 and brought snow to Wyoming, Colorado, and Nebraska. In central Wyoming, unofficial reports indicate that up to 40 inches (101.60 cm) of snow fell on the east slopes of the Wind River and southern Absaroka mountains. The late season snowstorm also bumped Scottsbluff, Nebraska up to the snowiest season on record and Cheyenne, Wyoming up to the second snowiest season on record. Scottsbluff, Nebraska received 82.2 inches (208.79 cm) of snow which beat out the old record of 78.5 inches (199.39 cm) recorded during the 1979-1980 snow season (period of record 1893-2010). Cheyenne, Wyoming received 103.4 inches (262.64 cm) of snow this season which came in second to the record 121.5 inches (308.61 cm) of snow received in the 1979-1980 snow season (period of record 1883-2010). Another strong storm occurred May 24th and brought severe weather to the Dakotas, Nebraska, and Kansas. Multiple tornadoes were reported and one EF-2 tornado destroyed an elementary school in northwest South Dakota. In addition, 4.25 inch hail was reported in the panhandle of Nebraska, high winds caused damage in Alliance, Nebraska, and flooding was reported along the White River in Nebraska.
- For more information, please go to the High Plains Regional Climate Center Home Page.
- Southern Region: (Information provided by the Southern Regional Climate Center)
- With the exception of western Texas, western Oklahoma and central Oklahoma, most stations in the Southern Region reported above normal mean monthly average May temperatures. In western Texas, temperatures averaged only 0 to 2 degrees F (0 to 1.1 degrees C) below the monthly normal. Similar anomalies were also observed in western and central Oklahoma. Elsewhere, most stations in the region reported average temperatures that ranged between 2 to 4 degrees F (1.1 to 2.2 degrees C) above the monthly normal. The highest anomalies were observed in northeastern Texas and northwestern Louisiana, where values averaged between 4 to 6 degrees F (2.2 to 3.3 degrees C) above expected values. The warmth in the eastern and central portions of the region was consistent throughout the month. For example. Louisiana reported a state average temperature of 77.10 degrees F (25.1 degrees C), which is the fourth warmest May on record (1895-2010). In Mississippi, an average state temperature of 74.30 degrees F (23.5 degrees C) was reported, which is the eighth warmest May on record (185-2010). Tennessee and Arkansas reported their nineteenth and twentieth warmest May on record (1895-2010), respectively. The state average temperature for Tennessee was 69.10 degrees F (20.6 degrees C), and the state average temperature for Arkansas was 71.20 degrees F (21.8 degrees C).
- The month of May was quite dry throughout most of Louisiana, south western Oklahoma and eastern Texas, where most stations reported less than half the expected monthly precipitation. Slightly drier conditions were observed in the western panhandle of Texas, with most stations reporting less than 25 percent of normal precipitation. In total, the state of Texas averaged 2.25 inches (57.15 mm) of precipitation for the month, which is their twenty-third driest May on record (1895-2010). In contrast, conditions were very wet in western and middle Tennessee and in north central Arkansas. In the case of the latter, most stations reported between 150-200 percent of normal precipitation. Tennessee reported a state average precipitation value of 8.13 inches (206.5 mm), which makes it the sixth wettest May on record (1895-2010). The Middle Tennessee climate division reported a divisional monthly average of 10.47 inches (265.9 mm), which is the second wettest May on record (1895-2010). Similarly, the Western Tennessee climate division experienced its third wettest May on record (1895-2010), averaging 9.56 inches (242.8 mm) of rainfall. A bulk of this rainfall was delivered in just the first few days of the month. A strong storm passed through from May 1 to May 2, dumping over 10 inches (254.0 mm) at many stations, and producing three day storm totals that exceeded 16 inches. For instance, the Fairview Bowie Nature Center COOP station reported a storm total of 16.85 inches (428.0 mm). At the Centerville 4 NE station, 15.51 inches (394.0 mm) were reported. The station Jackson 4 SE reported a storm total of 14.53 inches (369.1 mm), 11.94 inches (303.3 mm) of which fell in just one day. The value of 11.94 inches (303.3 mm) appears to be the second greatest one day total for all stations in the state.
- Drought conditions in the Southern Region have changed dramatically over the past month. Last month, only 1.3 percent of the region was in moderate drought and no areas were experiencing severe drought. Drought conditions have worsened due to abnormally dry conditions in the areas of north and central Louisiana and eastern Texas. As of June 1, 2010, 12 percent of the region is now experiencing moderate drought or worse. Currently, drought in the Southern Region is confined to eastern Texas, Louisiana, and south western Mississippi. In Texas, moderate drought is confined to the eastern part of the state. In Louisiana, a bulk of the northern parishes are now in a state of severe drought. The severe drought covers 27.5 percent of the state.
- Over the period spanning May 1 to May 2, western and central Tennessee experienced one of the most significant rainfall events in the state's history. Heavy rainfalls appear to be the result of a stalled frontal boundary. Many stations reported record rainfall events, not only for the storm total, but also for one day totals. Fairview Bowie Nature Center, for example, received 11 inches (279.4) on the second of May, and reported a storm total of 16.85 inches (428.0). Nashville received 7.25 inches (184 mm) on May 2, and a storm total of 13.57 inches (345 mm). Many other stations (many of which are from the Community Collaborative Rain, Hail and Snow Network, or CoCoRaHS) also reported heavy rainfall in excess of 10 inches (see Figure 4). The heavy rainfall led to record crests on several rivers, including: The: Cumberland River ,The Red River, The Harpeth River, The Duck River, and The Buffalo River. Heavy rainfalls resulted in what is being reported as the 1000 year flood. Flooding was widespread and a total of twenty-one deaths were reported in Tennessee alone. Heavy rainfall values also affected northern Mississippi, where six people were reported to be killed. The City of Nashville was significantly damaged by the flooding. The Associated Press reported that the Nashville Mayor has estimated damages to the city to be approximately 1.5 billion dollars. Flooding damaged the Grand Ole Opry House, the Convention Center, the Schermerhorn Symphony Center, The Bridgestone Arena, and LP Field, to name but a few locations. The Tennessean Online reported that at the Symphony Center, damage an organ was estimated at approximately 2.5 million dollars. At the Gaylord Hotel, 10 feet of flooding was reported and common areas of the hotel were reported to be destroyed. The Nashville Business Journal reported that as of May 7, 30 counties had declared as major disaster areas. More declarations are expected.
- On May 1, dozens of tornadoes ripped through western Tennessee, northern Mississippi and north eastern Arkansas. In Tippah County, Mississippi, it was reported that roofs were peeled off homes. Roof damage was also reported in Obion County, Tennessee. In Lafayette County, Mississippi, two tornado deaths were reported. In Hardeman County, Tennessee, one person was killed from a tornado. Several homes in the county were reported to be damaged and there were also reports of a possible train derailment. In Hickman County, Tennessee, thousands of hardwood trees were snapped and one tornado-related injury was reported.
- For more information, please go to the Southern Regional Climate Center Home Page.
- Western Region: (Information provided by the Western Regional Climate Center)
- Winter seemed reluctant to relinquish its grip throughout the West in May with numerous cold fronts ushering in cool and blustery weather for the month.
- Temperatures were below normal for the western U.S. except for a small portion of New Mexico. Some locations reported average monthly temperatures 8-10 degrees F (4-6 degrees C) below normal for May. In Lander, WY, it was the coolest May since 1950 and the coolest in Ely, NV, since 1953.
- Despite the many cold frontal passages, and often unstable atmosphere, precipitation was mostly below normal except for pockets of the Pacific Northwest, California and eastern Montana. It was the second wettest May in Yakima, WA, and the wettest since 1948.
- Thanks to cool, cloudy weather and occasional snowfall throughout April and May in the Sierra Nevada of California the percent of normal snow water equivalent increased from 90 percent on April 1 to 120 percent on May 1 to roughly 150 percent on June 1. Snow melt was delayed throughout the rest of the West as well with percent of snow water equivalents increasing from 50 percent on May 1st to over 100 percent in the Pacific Northwest and northern Rockies by the end of the month. The increase in percentage was less through addition than through minimal snow loss divided by decreasing long-term daily climatologies
- May 3: Strong frontal winds in Pacific Northwest: A powerful front kicked up strong winds throughout the Pacific Northwest causing widespread local damage to trees and power lines. Numerous accidents were reported with blowing dust, reducing visibility to less than 100 feet (30 m) in some locations. Blowing dust caused a couple of accidents on Interstate 84 in the Hermiston, OR, area.
- May 18: Tornado in Laramie County, WY: An EF-2 tornado hit Burns, WY, (30 miles (50 km) east of Cheyenne) on the evening of the 18th. One house lost its roof and several outbuildings were destroyed. This same storm produced golf ball sized hail that accumulated to a depth of up to 3 ft (1 m) in some locations and severe flash flooding.
- May 19: Severe weather in Pacific Northwest: Another strong front produced an EF0 tornado near Moses Lake, WA, damaging a barn and grain silo. This same storm blew down six large pine trees near Hayden Lake, ID, causing significant damage to a home and injuring one person. Three other homes in the area were also hit by falling trees. In Moscow, ID, thunderstorm winds ripped the roof off the La Quinta Inn injuring one person. A funnel cloud was spotted just prior to the event.
- May 24: Damaging winds in Colorado: Three semi-trucks and an RV were blown over in a 10-mile (16 km) stretch of Interstate 70 near Limon from strong frontal winds in the early afternoon of the 24th. Winds were reported as gusting up to 70 mph (31 m/s) Numerous flights were cancelled and delayed at Denver International Airport as winds gusted to 61 mph (27 m/s). In Colorado Springs at least eight soldiers were injured during a Fort Carson training session when the winds blew a tent off the ground.
See NCDC's Monthly Records web-page for weather and climate records for the month of May. For additional national, regional, and statewide data and graphics from 1895-present, for any period, please visit the Climate at a Glance page.
PLEASE NOTE: All of the temperature and precipitation ranks and values are based on preliminary data. The ranks will change when the final data are processed, but will not be replaced on these pages. Graphics based on final data are provided on the Climate Monitoring Products page and the Climate at a Glance page as they become available.