This report was updated on May 1, 2007 to reflect revised statistics for the 2006 annual average temperature for the contiguous U.S. based on updates of preliminary data available in January 2007 as well as changes resulting from the switch from Version 1 to Version 2 of the U.S. Historical Climatology Network (USHCN) data set.
 National Temperature
The 2006 average annual temperature for the contiguous U.S. was the 2nd warmest on record and within 0.1°F of the record set in 1998. Using final quality controlled data from the recently released USHCN Version 2 data set (see details below), the 2006 annual average temperature was 54.9°F, 2.1°F (1.2°C) above the 20th Century mean and 0.08°F (0.04°C) cooler than 1998.
In a mid-January 2007 climate report and NOAA press release, NCDC indicated the 2006 annual average temperature for the contiguous United States was the warmest on record based on USHCN Version 1 preliminary data and that USHCN Version 2 was expected to show 2006 to be the 2nd warmest year on record once operational testing was completed. Now that the USHCN Version 2 data set has replaced Version 1 as NCDC's official data set for calculations of U.S. national averages, this report has been revised to reflect a ranking of 2nd warmest for 2006.
The USHCN Version 2 data set, now operational at NCDC, exploits recent scientific advances that better address uncertainties in the instrumental record. Because different algorithms were used in making adjustments to the station data which comprise both data sets, there are small differences in annual average temperatures between the Version1 and Version 2 data sets. These small differences in average temperatures result in minor differences in annual rankings for some years. The USHCN version 2 (V2) data set, shows 2006 and 1998 to be the two warmest years on record for the contiguous U.S.
All months, seasons, and years from 1895 to present are available on the U.S. Climate At A Glance website.
Reflecting the long-term warming trend in the Earth's climate, U.S. and global annual temperatures are now approximately 1.0°F warmer than at the start of the 20th century, and the rate of warming has accelerated over the past 30 years, increasing globally since the mid-1970's at a rate approximately three times faster than the entury-scale trend. For additional information on global emperature trends, please see the 2006 annual temperature trends discussion.

The last eight 5-year periods (2002-2006, 2001-2005, 2000-2004, 1999-2003, 1998-2002, 1997-2001, 1996-2000, 1995-1999), were the warmest 5-year periods (i.e. pentads) in the last 112 years of national records, illustrating the anomalous warmth of the last decade. The 9th warmest pentad was in the 1930s (1930-34), when the western U.S. was suffering from an extended drought coupled with anomalous warmth. The three warmest years on record are 1998, 2006 and 1934. In 1998, the record warmth was concentrated in the Northeast as compared with the Northwest during 1934. In 2006, much above average temperatures were present across most of the U.S. The West Coast and parts of the Ohio Valley and Southeast were above average. No state was near or below average for 2006.
Seasonal Analysis:
The temperature for the 2005-2006 winter season (Dec-Feb) was the 11th warmest such period on record (1896-2006), with much warmer than average temperatures in parts of the central and northern Plains, Great Lakes, parts of the Northeast and across California. This was due in part to a record warm January for the U.S. Thirteen states in the central and northern Plains and Great Lakes ranked record warmest during this period.
Spring (March-May) temperatures were 8th warmest for the nation with much above average to record warmest temperatures across the central third of the nation. Both Texas and Oklahoma were record warmest during this period, which exacerbated existing drought conditions in this region.

Warm temperatures persisted into the Summer (June-August) months, as the nation ranked 2nd warmest in the last 112 years. Much above average temperatures were spread across the West, northern Plains and parts of the Mid-Atlantic states. The West region had its warmest summer on record. Many locations from the West Coast to the Central Plains broke records for the most days above 90°F and 100°F during a heat wave the last half of July. All-time record high temperatures were also set, breaking records which had stood since the 1930's Dust Bowl era in some places.
The year was the record warmest year-to-date period through September. During September and October, temperatures were unseasonably cold across a large portion of the country. November temperatures rebounded and were 18th warmest on record. The resulting 2006 fall season (September-November) ranked 39th warmest on record, or just above the 20th century mean. Even with the November warmth, below average temperatures remained across much of the central Plains, Ohio Valley and the Southeast.
For the year, four states (New Jersey, Oklahoma, Texas, and Vermont.) were 2nd warmest on record. All 48 of the contiguous states were either warmer or much warmer than average. No state ranked near to or below average during 2006.

Annual temperatures for 2006 averaged across the state of Alaska ranked 33rd warmest since 1918: the coolest annual period since 1999. The previous six years had annual anomalies averaging from just under 1.8°F (1°C) to nearly 3.6°F (2°C) above the mean, which is unprecedented in the historical record. Winter temperatures in 2006 were above average for the 7th consecutive year. Both spring and summer were slightly cooler than average and fall was slightly warmer. Wildfires across Alaska were not as active as in recent years. For additional information on the U.S. wildfire season, please see the Wildfire Season Summary.

The adjacent figure shows the percentage of the contiguous U.S. that was very warm and the percentage that was very cold during each of the past 48 months. During 2006, only one month (April was 2nd warmest across the U.S. during 2006 with over 60% of the U.S. very warm. Very warm and very cold conditions are defined as the warmest and coldest ten percent of recorded temperatures, respectively.

Data collected by NOAA's TIROS-N polar-orbiting satellites and adjusted for time-dependent biases by NASA and the Global Hydrology and Climate Center at the University of Alabama in Huntsville, indicate that temperatures in the lower half of the atmosphere (lowest 8 km of the atmosphere) over the U.S. were warmer than the 20-year(1979-1998) average for the 9th consecutive year. 2006 ranks as the 3rd warmest year since this satellite record began in 1979.
National Precipitation
Precipitation in the United States during 2006 was variable throughout much of the country with periods of excessive rainfall, especially across the Northwest, Great Lakes, and the Northeast, and persistent and developing drought in other areas. Winter storms in the Northwest contributed to the seasonal ranking of 10th wettest for the region. Precipitation across the Southwest region ranked 2nd driest during this same period. In spring, national precipitation was below average. Regionally, the Southeast ranked 3rd driest and the West ranked 6th wettest. The Northeast region had a record wettest summer exceeding the previous record by more than 1 inch (25.4 mm), while the U.S. as a whole was near average. Precipitation across the U.S. during the fall ranked 15th wettest. Regionally, the Northwest and Northeast ranked 11th and 4th wettest such periods, respectively.
For the contiguous U.S. as a whole, five of the first seven months of the year were drier than average. Combined with unusually warm temperatures, this exacerbated drought across much of the country. By late July, half of the contiguous U.S. was in moderate to exceptional drought, as reported by the U.S. Drought Monitor. Nationally, annual precipitation was near the long-term mean, ranking 55th driest year on record.

Below average precipitation occurred across portions of the Southwest, South and central Plains during the winter. Both Arizona and New Mexico had their driest such period on record. In contrast, a stormy period persisted in the Pacific Northwest, ranking Washington, Oregon and Idaho among their top ten wettest such periods on record. A dry winter exacerbated the drought conditions across the South and Southwest.
The Southeast and Mid-Atlantic states were exceptionally dry during the spring, whereas California ranked 6th wettest. In May, river flooding across New England caused the evacuation of thousands of people from their homes. Massachusetts precipitation was record wettest for the month of May. Dry conditions across central Florida exacerbated wildfires, which forced a temporary closure of Interstate Highway 95 around Daytona Beach.
Summer precipitation across much of the Northeast and Mid-Atlantic states was much above average, with New York and Rhode Island record wettest. Rainfall during an event in June exceeded 10 inches (254 mm) in some areas with numerous daily and monthly rainfall records set. Flooding was widespread across the greater Washington D.C. area northward through parts of Pennsylvania and New York. Precipitation deficits across the Gulf Coast and Florida were evident during the summer due in part to a lack of tropical activity in this region.
Precipitation received during the fall was above average across the nation. Precipitation surpluses across the Northeast were evident for the second consecutive season. New Jersey, Maryland and Virginia each had its record wettest fall. Illustrating the persistent and ongoing precipitation across the region, accumulations from May to October in Vermont exceeded the previous 6-month record by nearly 5 inches (126 mm). Heavy rainfall, in excess of 20 inches, across Washington and Oregon resulted in flooding, evacuations and at least 3 fatalities during the first half of November. Heavy snowfall during this period prompted the closure of two mountain passes until spring due to the threat of avalanches: the earliest such closure for one of the passes in 12 years. Seattle, WA had its wettest month on record with 15.63 inches (397 mm) of rainfall: the wettest month in 115 years of record-keeping. Extreme drought continued to affect parts of Texas, Oklahoma, the northern Plains and northern Minnesota by the end of November, however drought across the Southeast and parts of the West alleviated as the year progressed.
Annual precipitation ranked Florida 3rd driest, Georgia 6th driest and New Hampshire and Indiana 2nd and 3rd wettest, respectively. The Northeast region had another wet year ranking 6th wettest in 2006. In fact, the top two wettest annual periods in New Hampshire occurred during the past two years, making this two year period the wettest such period on record for the state.

The adjacent figure shows the percent of the contiguous U.S. that was very wet and the percent that was very dry during each of the past 48 months. During 2006, more than a tenth of the country was very dry during March, May, June, July, August and November. More than 20% of the country was very dry during December was also very wet across more than 15% of the country. Over 10% of the U.S. was very wet during March, April, July and August. Very wet and very dry conditions are defined as the wettest and driest ten percent of recorded precipitation values, respectively.
Severe Storms
Preliminary estimates indicate there were 23 very strong to violent tornadoes (wind speeds in excess of 158 mph, category F3-F5 on the Fujita Scale) during the 2006 official tornado season (March-August). This is below the 1971-2000 mean of 37. A slight negative trend in very strong to violent tornadoes has been observed since 1950. There was one F4 tornado and twenty-two F3 tornadoes during the main tornado season. No tornadoes were of F5 intensity.
Spring in the southern Plains and Tennessee and Ohio Valleys was punctuated by several severe weather outbreaks producing approximately 500 tornadoes and leading to nearly 50 deaths during March and April 2006. In mid-March, over 100 tornadoes were reported across 5 states from Oklahoma to Illinois. A major outbreak of severe weather in early April was responsible for at least 86 tornadoes spawned across Iowa, Illinois, Missouri, Arkansas, Kentucky, Indiana and Tennessee. Northwestern Tennessee was the hardest-hit by these storms with 19 confirmed deaths. Later that same week, another severe weather outbreak in the Nashville, TN region produced nearly 100 tornadoes. An additional 9 people were killed by this series of storms. Nearly 50 people in all were killed across the central U.S. in the March and April storms, many of them in Tennessee from the 2 most severe outbreaks (April 2nd and 7th). Most people were killed from falling debris associated with damage to houses and buildings from straight line winds and tornadoes.

Gallatin, TN Tornado Damage
There were additional severe storm events in 2006. Severe weather affected parts of the southern Plains and Midwest in mid-March with over 100 tornadoes reported across 5 states from Oklahoma to Illinois. At least 10 fatalities were associated with these storms. Two episodes of severe thunderstorms caused massive power outages in the greater St. Louis, MO area. The severe weather caused the largest power outage in the city's history. Exacerbating the power disruptions was a heat wave which affected much of the region.
Atlantic Hurricanes
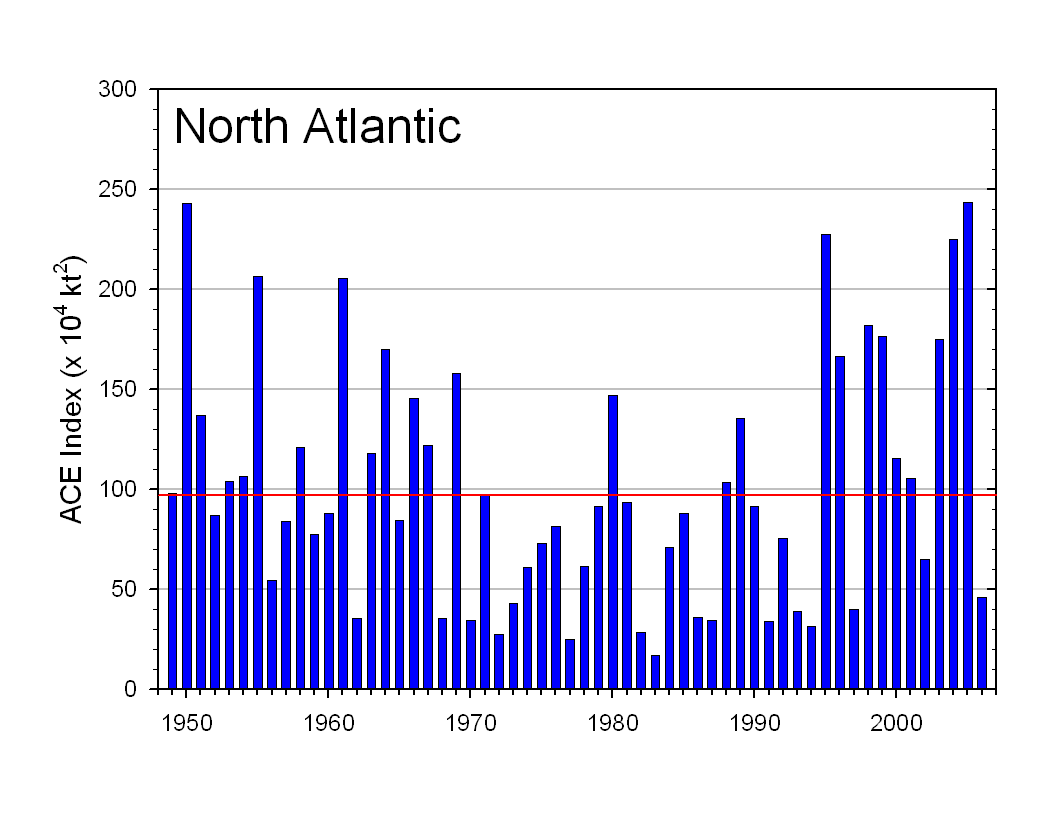
The 2006 Atlantic basin hurricane season was near the 1950-2000 average with 9 named storms, of which 5 were hurricanes, including 2 major hurricanes. The ACE index of hurricane activity indicates a below-average season, with a preliminary value of approximately 46 x104 knots2. An average season is anywhere from 66 x 104 knots2 to 103 x 104 knots2 When compared to other seasons during the current active phase of the Atlantic Multidecadal Oscillation, which began in 1995, only 1997 had fewer named storms than the nine that formed during the official 2006 season. The relatively inactive season in 2006 was attributed in large part to the rapid onset of El Niño in the equatorial pacific, which acted to suppress conditions conducive to hurricane formation in the Atlantic.
While the 2006 season did not officially begin until June 1st, Tropical Storm Zeta, which formed on December 30th, 2005 persisted until January 5th of this year, making it the first storm of 2006 in the Atlantic basin. However, the first storm of the official 2006 season was Tropical Storm Alberto, which developed off the coast of Cuba in mid-June. Hurricane Gordon became the first major hurricane of the Atlantic season on September 13th, but did not make landfall. Isaac was the last named storm during the 2006 season. Prior to its dissipation in early October, Isaac brushed the Bermuda coast as a category 1 storm.

Only 2 storms made landfall with the mainland U.S. during 2006, Tropical Storm Alberto in Florida and Hurricane Ernesto as a tropical storm in Florida and North Carolina. More details about these and all the 2006 Atlantic tropical systems can be found on NCDC's hurricane page.
Snow Season

Data courtesy of Rutgers University
Global Snow Lab
The 2005/2006 snow season was generally above average across the parts of the Northwest including the Sierra and Cascade Mountains and below average across the Southwest. Snow cover was below average for the North American continent as a whole over the winter and spring, consistent with a trend towards reduced spring snow cover for North America as shown in the adjacent image.

Notable snow storms in 2006 include a blizzard in February that affected areas of the Mid-Atlantic and the Northeast from February 11-12, 2006. This storm produced 26.9 inches (68.3 cm) of snow in New York City's Central Park. This amount broke the all-time storm total record of 26.4 inches (67.1 cm) set during the December 26-27, 1947 storm. The Northeast Snowfall Impact Scale (NESIS) classified this as a Category 3 (Major) storm and ranked it as the 20th most intense on record for the Northeast. In Hartford, CT, a snowfall total of 21.9 inches (55.6 cm) broke the old storm total record of 21 inches (53.3 cm) set in 1983. Many locations in the region reported between 10-20 inches (25-51 cm) during this event. In December, two major winter snow storms impacted Colorado and parts of the High Plains. Denver, Colorado had its 3rd snowiest December on record and endured a major blizzard which brought the city to a standstill during the holiday travel season. More details of these and other snow and ice events are available in the annual summary of significant events.

By the end of Spring, snowpack in the West was above average across much of Oregon and parts of California, Washington, Nevada, Idaho and Utah. Many of the western states rely on melting winter snow to replenish reservoirs. In fact, precipitation received throughout the winter and spring helped to alleviate drought conditions in the West. An active Pacific storm track during the winter and spring brought a steady supply of rainfall and snow to the West, Northwest and Intermountain West. Excessive flooding occurred along the north California coastline and in the Sierra-Nevada Mountains in early April. Snowfall across Arizona and New Mexico was exceptionally low throughout the season with most regions reporting less than 40% of normal snowpack at the end of spring. The 2006-2007 snow season has begun with above average snowfall across parts of the West. Parts of the central Rockies and along the Cascades in Washington and Oregon have snow water equivalent percentages in excess of 160 percent of normal. Snowfall accumulations of up to two feet (60 cm) fell across the Cascades in late-November. Snowfall in excess of three feet (90 cm) fell across portions of the Colorado front-range and western High Plains during the two major snowstorms near the end of December.
NOAA's National Climatic Data Center is the world's largest active archive of weather data. The preliminary temperature and precipitation rankings are available from the center by calling: 828-271-4800. NOAA works closely with the academic and science communities onclimate-related research projects to increase the understanding of El Niño and improve forecasting techniques. NOAA's Climate Prediction Center monitors, analyzes and predicts climate events ranging from weeks to seasons for the nation. NOAA also operates the network of data buoys and satellites that provide vital information about the ocean waters, and initiates research projects to improve future climate forecasts.