Introduction
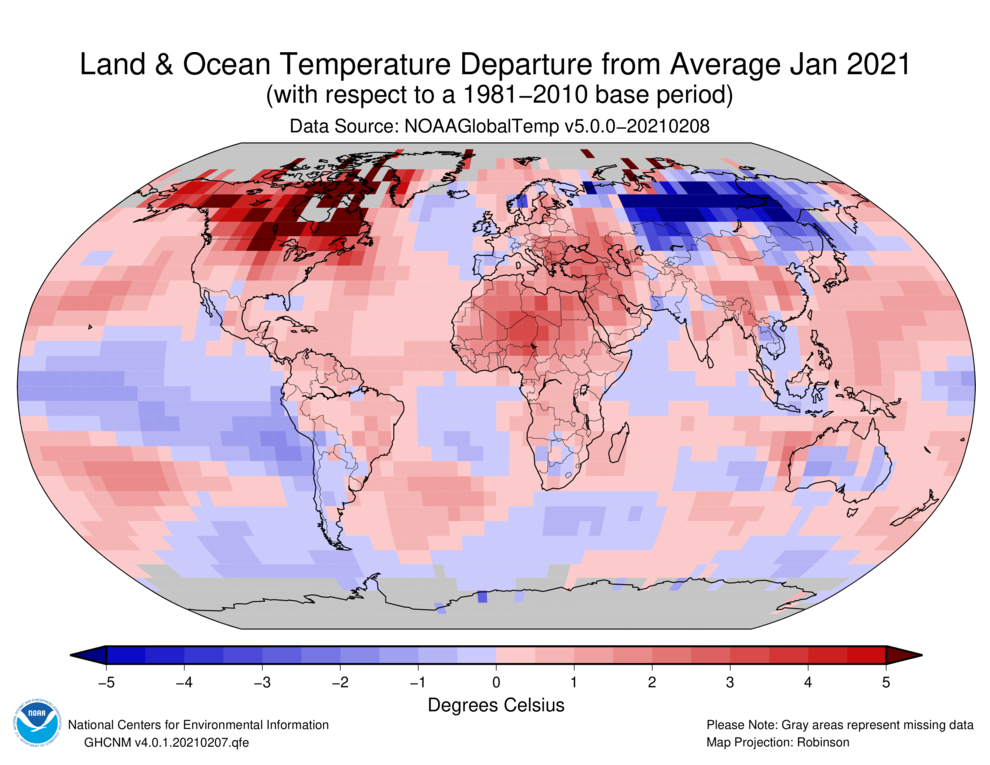
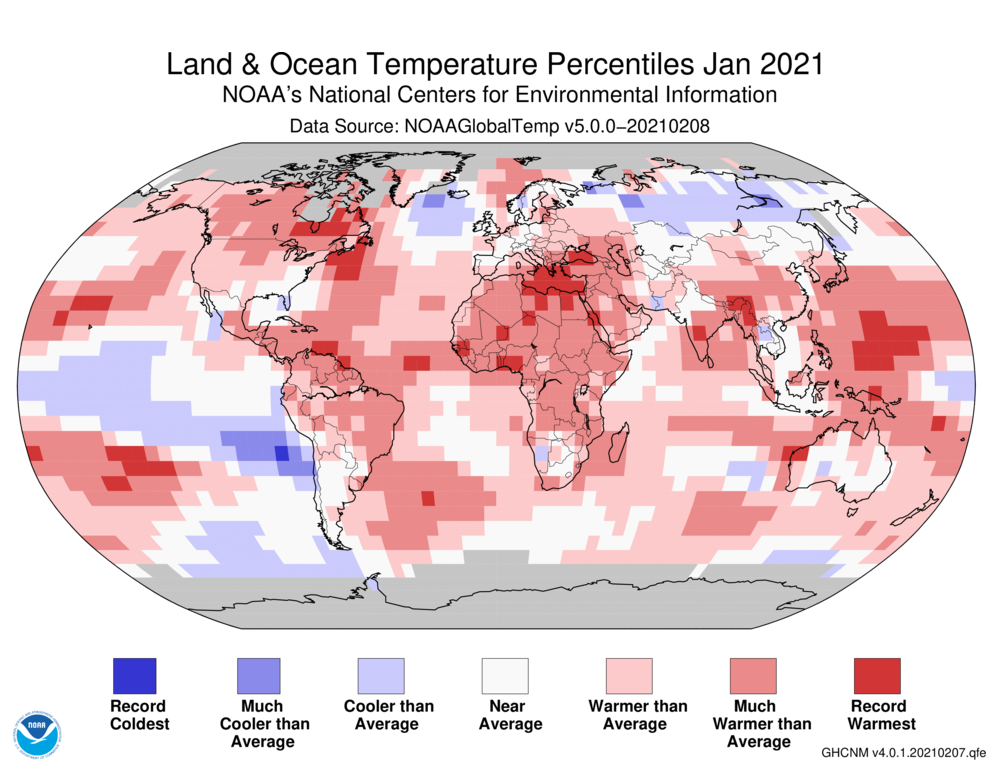
Temperature anomalies and percentiles are shown on the gridded maps below. The anomaly map on the left is a product of a merged land surface temperature (Global Historical Climatology Network, GHCN) and sea surface temperature (ERSST version 5) anomaly analysis. Temperature anomalies for land and ocean are analyzed separately and then merged to form the global analysis. For more information, please visit NCEI's Global Surface Temperature Anomalies page. The percentile map on the right provides additional information by placing the temperature anomaly observed for a specific place and time period into historical perspective, showing how the most current month, season or year compares with the past.
Temperature
In the atmosphere, 500-millibar height pressure anomalies correlate well with temperatures at the Earth's surface. The average position of the upper-level ridges of high pressure and troughs of low pressure—depicted by positive and negative 500-millibar height anomalies on the January 2021 map—is generally reflected by areas of positive and negative temperature anomalies at the surface, respectively.
Monthly Temperature: January 2021
During the month, a sudden stratospheric warming (SSW) event occurred in late December through early January. During that time, the stratospheric polar vortex warmed dramatically and its jet stream weakened. As is typical for SSW events, it was followed by a strongly negative Arctic Oscillation (AO) and North Atlantic Oscillation (NAO) for most of January. These patterns are usually associated with colder temperatures for the eastern U.S. and for Europe. The cold anomalies were observed in Europe with a deep and persistent trough. However, the ridge from Greenland extended southwestward and brought above normal temperatures to the Northern U.S. The ridge was part of a wavetrain from the Pacific with positive Pacific-North America (PNA) /Eastern Pacific Oscillation (EPO) patterns during the first two to three weeks of January. That wavetrain featured an enhanced ridge over the subtropical Pacific and a trough in the Gulf of Alaska. Just as the ridge was unusual for the negative AO/NAO, the positive PNA wavetrain is also unusual for the ongoing La Niña event. SSW events are also associated with more intense winter storms. For additional information on the polar vortex, please see NOAA's article: The science behind the polar vortex.
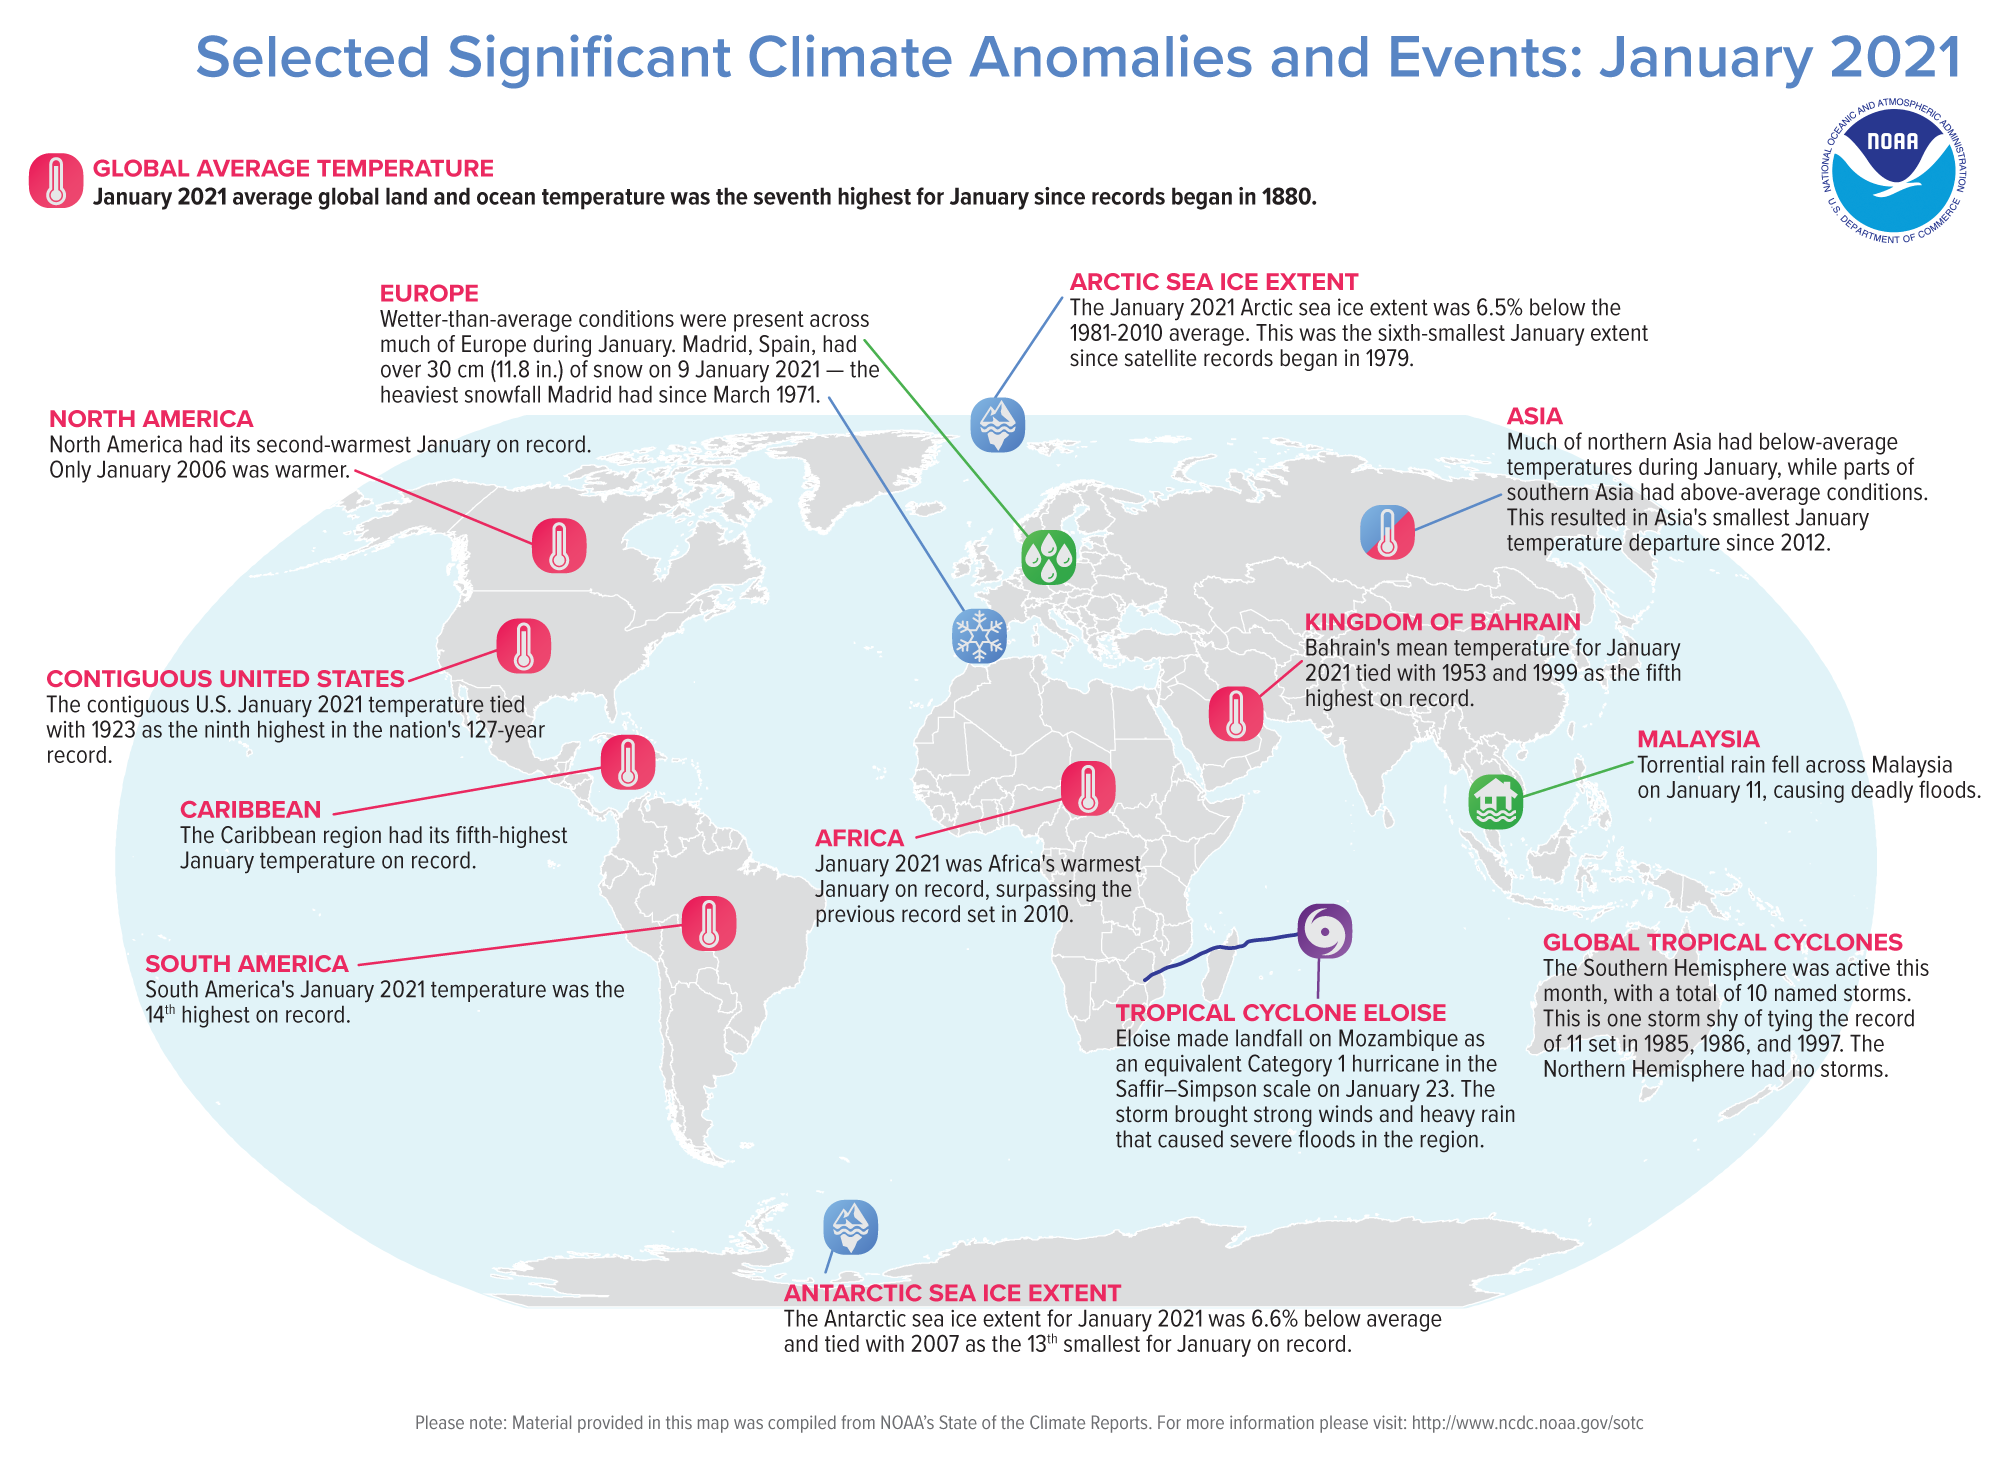
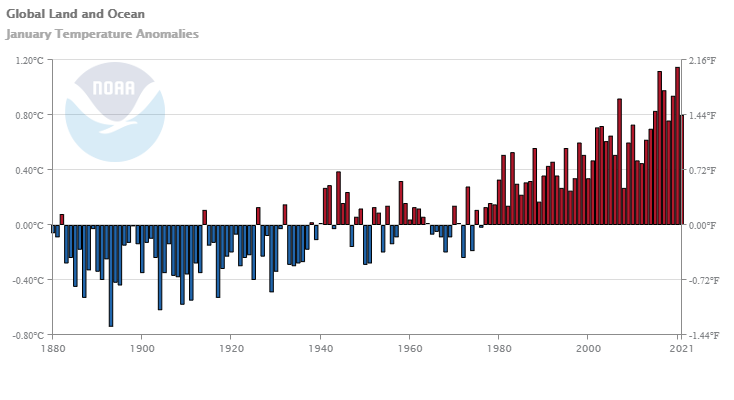
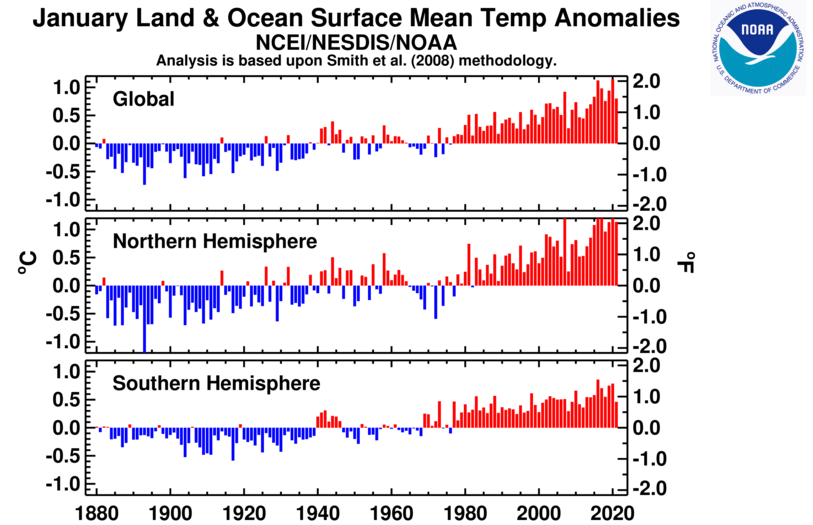
The January 2021 global land and ocean surface temperature was 0.80°C (1.44°F) above the 20th century average and ranked as the seventh warmest January in the 142-year global records. January 2021 also marked the 45th consecutive January and the 433rd consecutive month with temperatures, at least nominally, above the 20th-century average.
The year began with a La Niña episode in the tropical Pacific Ocean that started in August 2020. The El Niño-Southern Oscillation (ENSO) can affect global temperatures. La Niña tends to cool global temperatures slightly, while El Niño tends to boost global temperatures. With a slightly cool start to the year, there is only a 2.9% chance of 2021 ending as the warmest year on record. However, there is an over 99% chance of the year ranking among the 10 warmest years on record.
During January 2021, northern North America, northern Africa, southeastern Europe, and parts of the Middle East had the most notable temperature departures that were at least 2.5°C (4.5°F) above average. Parts of the North and South Pacific and the northwestern Atlantic Ocean (off the U.S. Northeast coast) also had notable warm temperature departures at 2.0°C (3.6°F) above average or higher. Record warm January temperatures were present across parts of the Pacific and Atlantic oceans, as well as, parts of eastern Canada, northern Africa, the Mediterranean Sea, and southern Asia. As a whole, about 5.93% of the world's surface had a record-warm January temperature–the third highest January percentage since records began in 1951. Only Januarys of 2016 (15.73%) and 2020 (7.05%) had a higher percentage of record warm January temperatures. Meanwhile, much of northern Asia was at least 2.0°C (3.6°F) colder than average, in stark contrast to most of 2020, when the region was well above average. Additionally, cooler-than-average conditions were present across the central and eastern tropical Pacific Ocean, consistent with La Niña conditions, as well as southeastern Pacific Ocean and the northern Atlantic Ocean (off the coast of Greenland). A small area in the southeastern Pacific Ocean had a record cold January temperature, which represents only 0.25% of the globe. January 2021 marked the first time since October 2019 (0.37%) where a record cold temperature occurred.
The global land-only surface temperature was the eighth highest on record at +1.40°C (+2.52°F). The global ocean-only temperature departure of 0.58°C (1.04°F) was the smallest for January since 2014; however, this was also the eighth highest in the 142-year global record.
According to NCEI's regional analysis, North America, as a whole, had its second warmest January on record, with a temperature departure from average of +3.96°C (+7.13°F). This was only 0.10°C (0.18°F) shy of tying the record warm January set in 2006. According to Environment and Climate Change Canada, the January temperatures across Ontario ranged between 2.0°–9.0°C (3.6°–16.2°F) above average and several locations had a January temperature that ranked among the highest on record. For the contiguous U.S., January 2021 tied with 1923 as the ninth warmest on record.
Africa had its highest January temperature departure at +1.67°C (+3.01°F), exceeding the previous record set in 2010 by 0.05°C (0.09°F). Meanwhile, after experiencing its warmest year on record, Asia had a slightly cool start to 2021, with a temperature departure of 0.45°C (0.81°F) above average. This value was the smallest January temperature departure since 2012.
Select national information is highlighted below. Please note that different countries report anomalies with respect to different base periods. The information provided here is based directly upon these data:
- Cooler-than-average conditions engulfed much of Spain during January 2021, resulting in a national temperature that was 0.6°C (1.08°F) cooler than average—this was the coldest January since 2009 for Spain and the 16th coldest since national records began in 1961.
- The United Kingdom had its coldest January since 2010 with a temperature departure of 1.5°C (2.7°F) below average. Regionally, England and Scotland and Northern Ireland also had their coldest January since 2010. According to the UK Met Office, the first two weeks of January brought wintry conditions to the region, which caused some travel disruption.
- Sweden had its coldest January since 2016.
- The Kingdom of Bahrain had a national mean January temperature that was 1.5°C (2.7°F) above average and tied with 1953 and 1999 as the fifth highest since national records began in 1902.
| January | Anomaly | Rank (out of 142 years) | Records | ||||
|---|---|---|---|---|---|---|---|
| °C | °F | Year(s) | °C | °F | |||
| Global | |||||||
| Land | +1.40 ± 0.23 | +2.52 ± 0.41 | Warmest | 8th | 2020 | +2.10 | +3.78 |
| Coolest | 135th | 1893 | -2.00 | -3.60 | |||
| Ocean | +0.58 ± 0.15 | +1.04 ± 0.27 | Warmest | 8th | 2016 | +0.92 | +1.66 |
| Coolest | 135th | 1917 | -0.53 | -0.95 | |||
| Land and Ocean | +0.80 ± 0.18 | +1.44 ± 0.32 | Warmest | 7th | 2020 | +1.15 | +2.07 |
| Coolest | 136th | 1893 | -0.74 | -1.33 | |||
| Northern Hemisphere | |||||||
| Land | +1.69 ± 0.29 | +3.04 ± 0.52 | Warmest | 8th | 2007 | +2.44 | +4.39 |
| Coolest | 135th | 1893 | -2.55 | -4.59 | |||
| Ocean | +0.79 ± 0.14 | +1.42 ± 0.25 | Warmest | 4th | 2016 | +1.10 | +1.98 |
| Coolest | 139th | 1904 | -0.53 | -0.95 | |||
| Land and Ocean | +1.13 ± 0.20 | +2.03 ± 0.36 | Warmest | 5th | 2020 | +1.50 | +2.70 |
| Coolest | 138th | 1893 | -1.34 | -2.41 | |||
| Ties: 2019 | |||||||
| Southern Hemisphere | |||||||
| Land | +0.68 ± 0.11 | +1.22 ± 0.20 | Warmest | 19th | 2019 | +1.44 | +2.59 |
| Coolest | 124th | 1918 | -0.90 | -1.62 | |||
| Ocean | +0.42 ± 0.16 | +0.76 ± 0.29 | Warmest | 22nd | 2016 | +0.79 | +1.42 |
| Coolest | 121st | 1917 | -0.58 | -1.04 | |||
| Ties: 2001 | |||||||
| Land and Ocean | +0.46 ± 0.15 | +0.83 ± 0.27 | Warmest | 21st | 2016 | +0.86 | +1.55 |
| Coolest | 122nd | 1917 | -0.58 | -1.04 | |||
| Ties: 2009 | |||||||
| Arctic | |||||||
| Land and Ocean | +1.54 ± 0.95 | +2.77 ± 1.71 | Warmest | 25th | 1981 | +4.33 | +7.79 |
| Coolest | 118th | 1900 | -3.07 | -5.53 | |||

The most current data can be accessed via the Global Surface Temperature Anomalies page.
Precipitation
January Precipitation
The maps shown below represent precipitation percent of normal (left, using a base period of 1961–1990) and precipitation percentiles (right, using the period of record) based on the GHCN dataset of land surface stations.
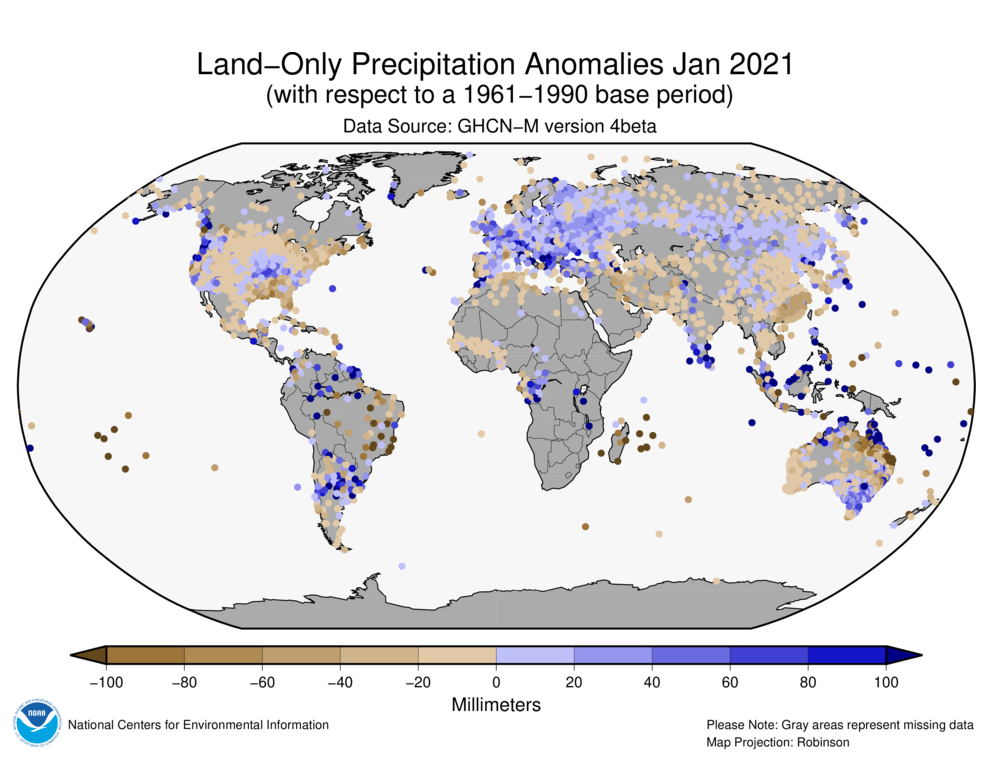
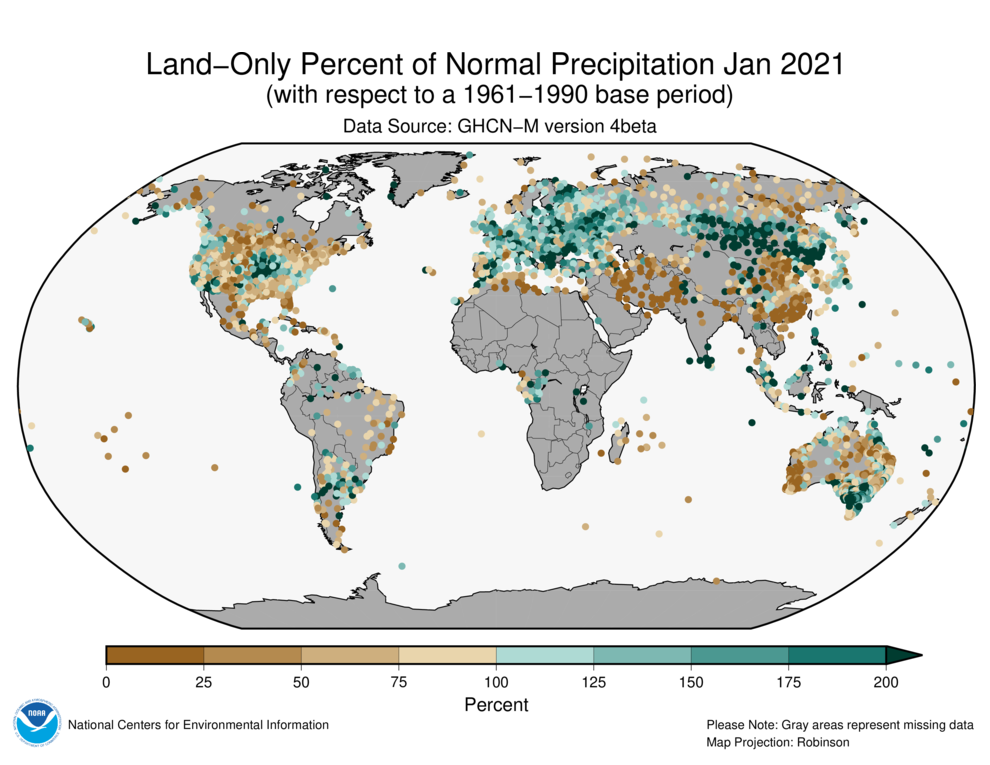
As is typical, precipitation anomalies during January 2021 varied significantly around the world. January precipitation was generally drier than normal across parts of the northern contiguous U.S., as well as across the Rocky Mountains and the southeastern U.S, Mexico, eastern Brazil, northern Russia, southern parts of Asia, and western and northeastern Australia. Wetter-than-normal conditions were notable across the central contiguous U.S., northern South America, northern Argentina, much of Europe, southwestern Russia, and southeastern Australia.
Select national information is highlighted below. (Please note that different countries report anomalies with respect to different base periods. The information provided here is based directly upon these data):
- Tropical cyclone Eloise made landfall in Mozambique near Beira as an equivalent Category 1 hurricane in the Saffir-Simpson scale on January 23. The storm affected the region with high winds and heavy rain that triggered severe floods in the region. According to Mozambique's National Institute of Meteorology, Beira received 250 mm of rain in 24 hours, which is close to the region's monthly average precipitation total for the month of January. Over 175,000 people were affected by Eloise and more than 8,000 homes were damaged or destroyed, according to UN's Reliefweb. Before making landfall in Mozambique, Eloise also affected Madagascar as a tropical storm with strong winds and copious rain.
- Much of Europe had above-average precipitation during January 2021, with some locations receiving twice their monthly normal. Madrid, Spain had over 50 cm (11.8 inches) of snow on 9 January 2021. This was the heaviest snowfall Madrid had since March 1971. Several locations across Sweden had their wettest January on record.
- Torrential rain fell across Malaysia on January 11, causing deadly floods. According to UN's Reliefweb, six people died and over 50,000 people were affected.
Global Precipitation Climatology Project (GPCP)
The following analysis is based upon the Global Precipitation Climatology Project (GPCP) Interim Climate Data Record. It is provided courtesy of the GPCP Principal Investigator team at the University of Maryland.


Deep into the Northern Hemisphere winter the climatological precipitation features have moved furthest south for the year as can be seen in Fig. 1 (top panel) over Africa and South America and off South Asia and into the Indian ocean, Maritime Continent and northern Australia. The ITCZ is also at its most southern position across the Pacific and Atlantic Oceans. The mid-latitude storm tracks and their accompanying precipitation maxima are furthest south.
The anomaly pattern (Fig. 1, bottom panel) shows strong, dramatic features of excesses and deficits of precipitation across the tropics, over both land and ocean. For this January the tropical ocean-atmosphere system is still in a La Niña phase of ENSO, with negative SST anomalies over the central Pacific along the Equator, although the La Niña SST index has weakened slightly from December. La Niña explains many, but not all, of the precipitation anomaly features in the tropics, as can be seen in Fig. 2, showing a La Niña composite for Januarys (top panel) over the full period of GPCP (1979–2020) and a repeat of the January 2021 anomalies from Fig. 1. Between the two panels in Fig. 2 there is a positive correlation in the location of features of the same sign, with greater intensity for the January 2021 features as compared to the composite. In the central Pacific the negative feature for this January is very similar in shape to the composite. The same is true in general for the positive rainfall anomaly over the Maritime Continent, which is related to heavy rain events and floods during the month over Indonesia and Malaysia.
The Indian Ocean features, at least in the eastern half, also show the marks of the La Niña, including connections to floods in Sri Lanka and southern tip of India. Further west this January's positive anomaly over southern Africa matches the composite and includes the effect of Tropical Cyclone Eloise hitting and flooding Mozambique along the east coast and also heavy rain and floods to the west in Namibia. Further north in eastern Africa the two patterns do not match well.
In South America the effect of La Niña is fairly obvious with the composite and single month patterns of generally the same sign over the northern two-thirds of the continent. Over North America the composite shows La Niña usually producing negative anomalies across Mexico and the southern U.S.; however, the field for this January is mixed, with positive and negative features. While the Rocky Mountains were covered with less snow than normal as might be expected with La Niña, the west coast had heavy rain and snow in Washington state and late month mudslides in California. These events are connected to the positive precipitation anomaly in that area.
Elsewhere in northern middle latitudes other factors besides La Niña dominate, including intense storm track related partially to the breakdown of the stratospheric polar vortex during the month. Extending westward from the U.S. and Canadian west coast a narrow positive anomaly feature indicates a more intense than normal storm track in terms of precipitation. This feature is obvious in this month's anomaly map extending back across the Pacific at ~ 40°N, across northern Japan, and all the way across Asia and Europe and out into the Atlantic. This feature was associated with events such as an intense snowstorm in Spain, floods in Greece, Serbia, Bulgaria and Albania, heavy snows in northern Japan, intense cyclonic systems in the North Pacific and the atmospheric river events along the U.S. west coast.
Therefore, while the La Niña effects dominated much of the precipitation pattern in the tropics, at middle and high latitudes the La Niña composite was overrun by storm track and cyclone dynamics to produce a much different anomaly pattern in this latitude zone.
References
- Adler, R., G. Gu, M. Sapiano, J. Wang, G. Huffman 2017. Global Precipitation: Means, Variations and Trends During the Satellite Era (1979-2014). Surveys in Geophysics 38: 679-699, doi:10.1007/s10712-017-9416-4
- Adler, R., M. Sapiano, G. Huffman, J. Wang, G. Gu, D. Bolvin, L. Chiu, U. Schneider, A. Becker, E. Nelkin, P. Xie, R. Ferraro, D. Shin, 2018. The Global Precipitation Climatology Project (GPCP) Monthly Analysis (New Version 2.3) and a Review of 2017 Global Precipitation. Atmosphere. 9(4), 138; doi:10.3390/atmos9040138
- Gu, G., and R. Adler, 2022. Observed Variability and Trends in Global Precipitation During 1979-2020. Climate Dynamics, doi:10.1007/s00382-022-06567-9
- Huang, B., Peter W. Thorne, et. al, 2017: Extended Reconstructed Sea Surface Temperature version 5 (ERSSTv5), Upgrades, validations, and intercomparisons. J. Climate, doi: 10.1175/JCLI-D-16-0836.1
- Huang, B., V.F. Banzon, E. Freeman, J. Lawrimore, W. Liu, T.C. Peterson, T.M. Smith, P.W. Thorne, S.D. Woodruff, and H-M. Zhang, 2016: Extended Reconstructed Sea Surface Temperature Version 4 (ERSST.v4). Part I: Upgrades and Intercomparisons. J. Climate, 28, 911-930, doi:10.1175/JCLI-D-14-00006.1.
- Menne, M. J., C. N. Williams, B.E. Gleason, J. J Rennie, and J. H. Lawrimore, 2018: The Global Historical Climatology Network Monthly Temperature Dataset, Version 4. J. Climate, in press. https://doi.org/10.1175/JCLI-D-18-0094.1.
- Peterson, T.C. and R.S. Vose, 1997: An Overview of the Global Historical Climatology Network Database. Bull. Amer. Meteorol. Soc., 78, 2837-2849.
- Vose, R., B. Huang, X. Yin, D. Arndt, D. R. Easterling, J. H. Lawrimore, M. J. Menne, A. Sanchez-Lugo, and H. M. Zhang, 2021. Implementing Full Spatial Coverage in NOAA's Global Temperature Analysis. Geophysical Research Letters 48(10), e2020GL090873; doi:10.1029/2020gl090873.