Introduction
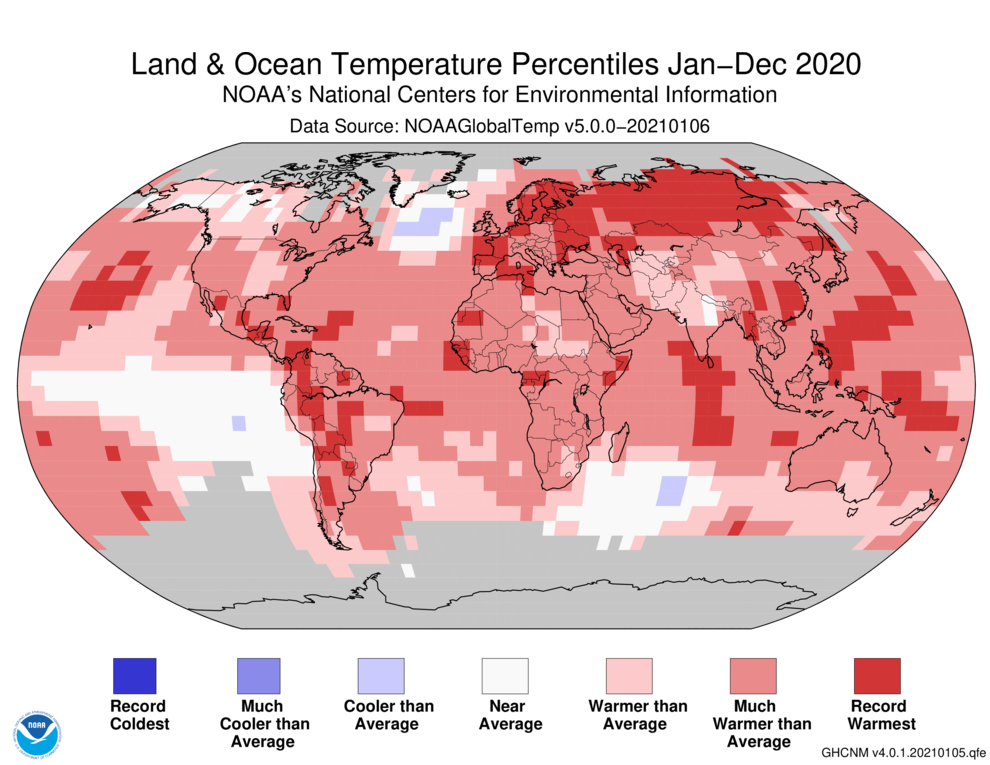
Temperature anomalies and percentiles are shown on the gridded maps below. The anomaly map on the left is a product of a merged land surface temperature (Global Historical Climatology Network, GHCN) and sea surface temperature (ERSST version 5) anomaly analysis. Temperature anomalies for land and ocean are analyzed separately and then merged to form the global analysis. For more information, please visit NCEI's Global Surface Temperature Anomalies page. The percentile map on the right provides additional information by placing the temperature anomaly observed for a specific place and time period into historical perspective, showing how the most current month, season or year compares with the past.
Temperature
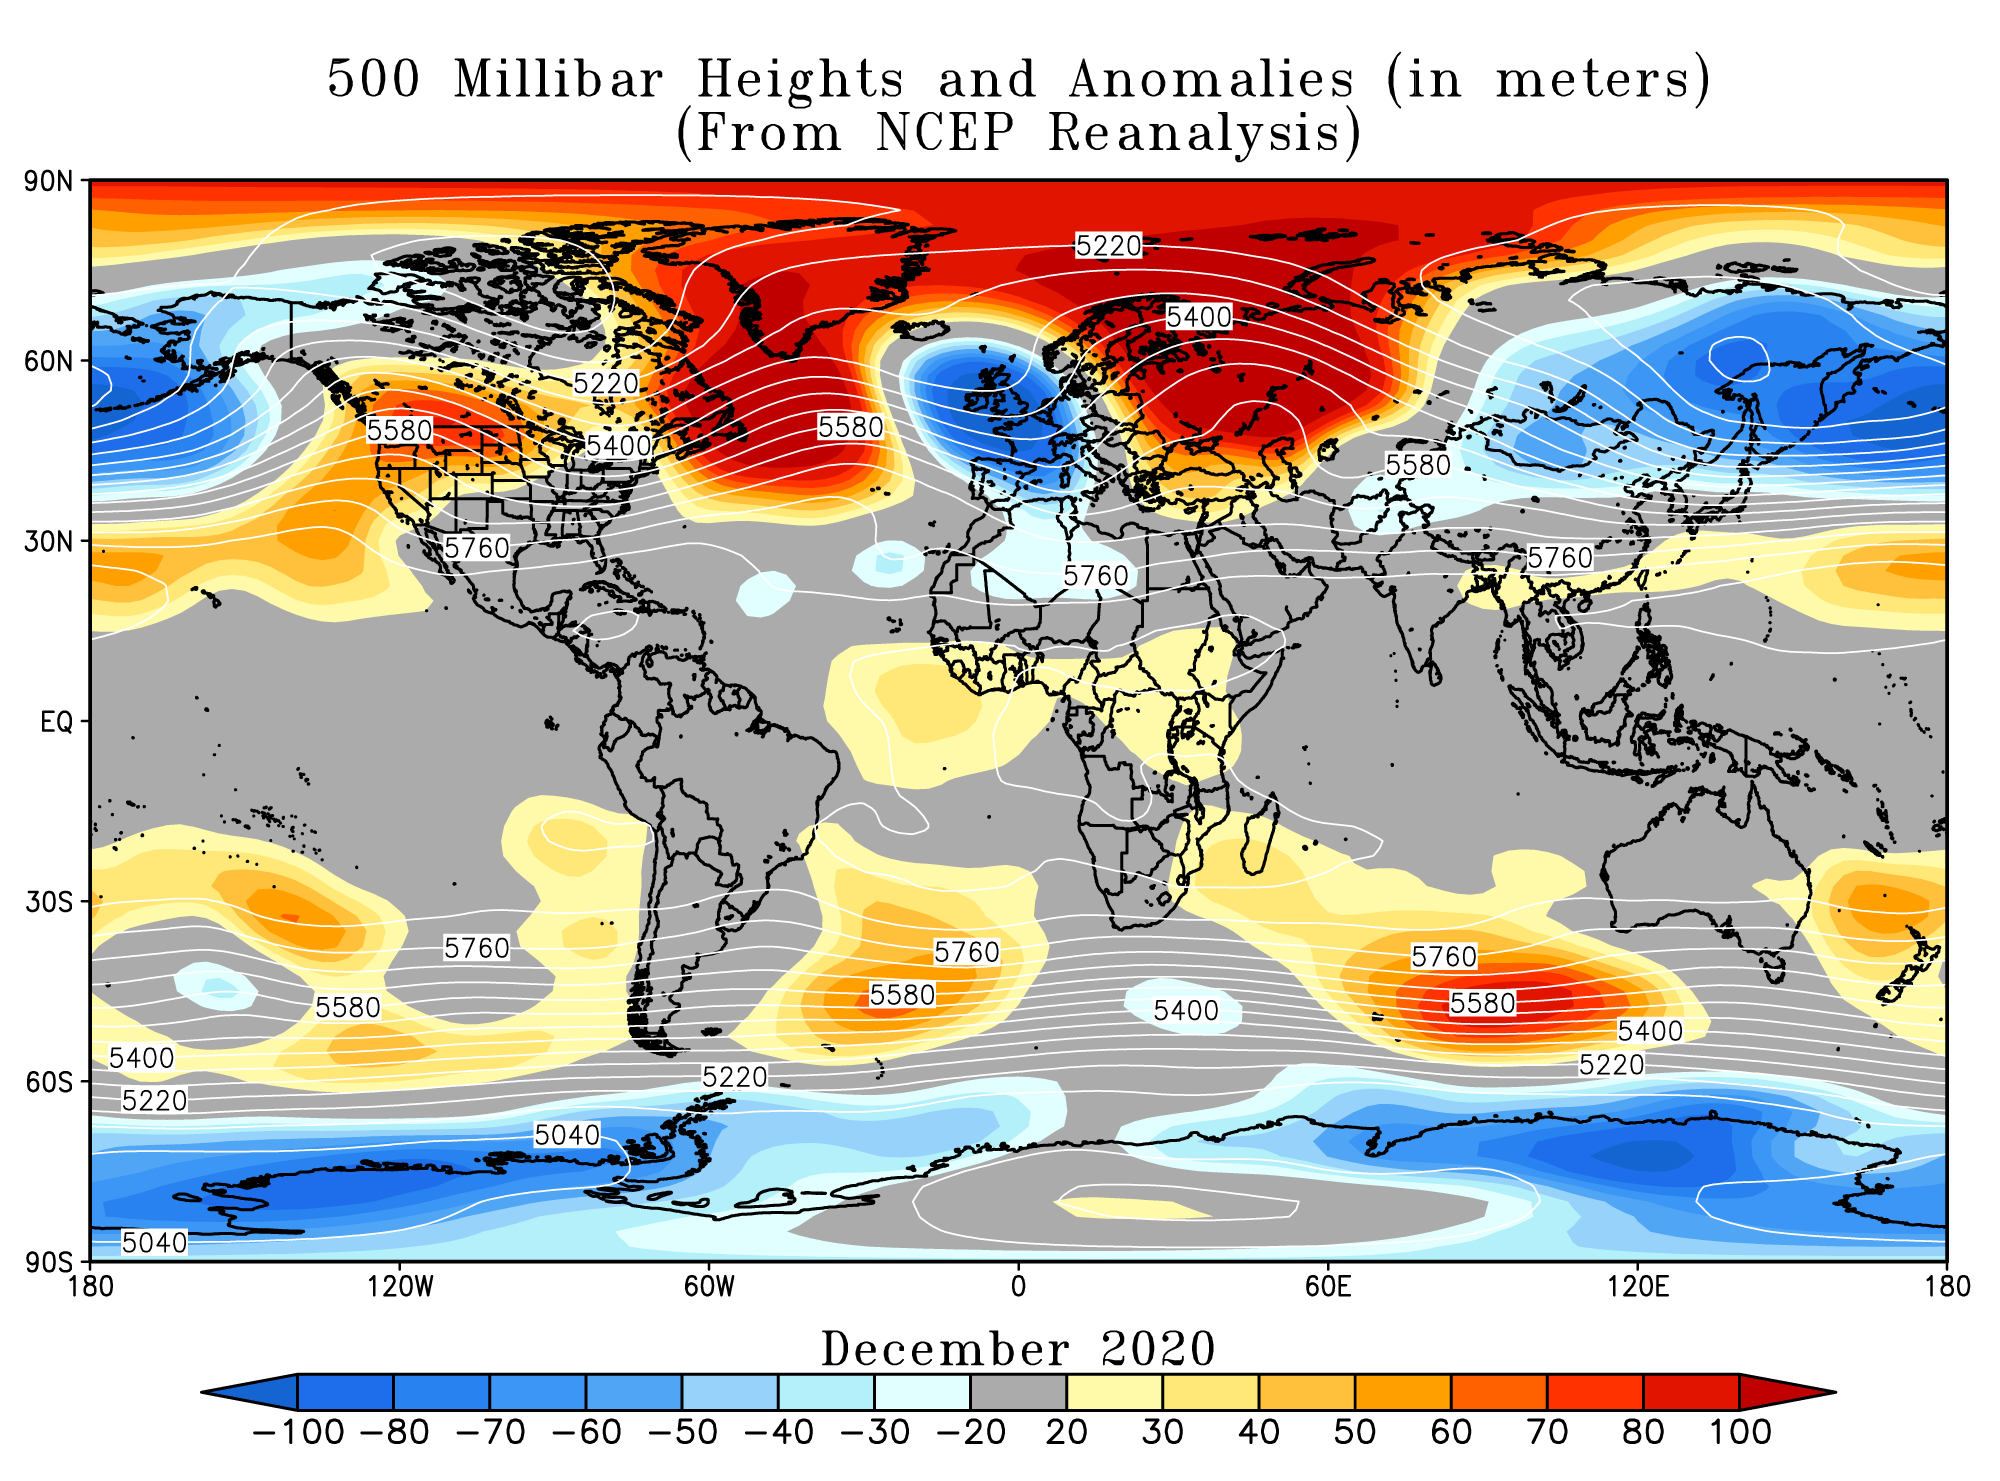
In the atmosphere, 500-millibar height pressure anomalies correlate well with temperatures at the Earth's surface. The average position of the upper-level ridges of high pressure and troughs of low pressure—depicted by positive and negative 500-millibar height anomalies on the December 2020 map—is generally reflected by areas of positive and negative temperature anomalies at the surface, respectively.
Monthly Temperature: December 2020
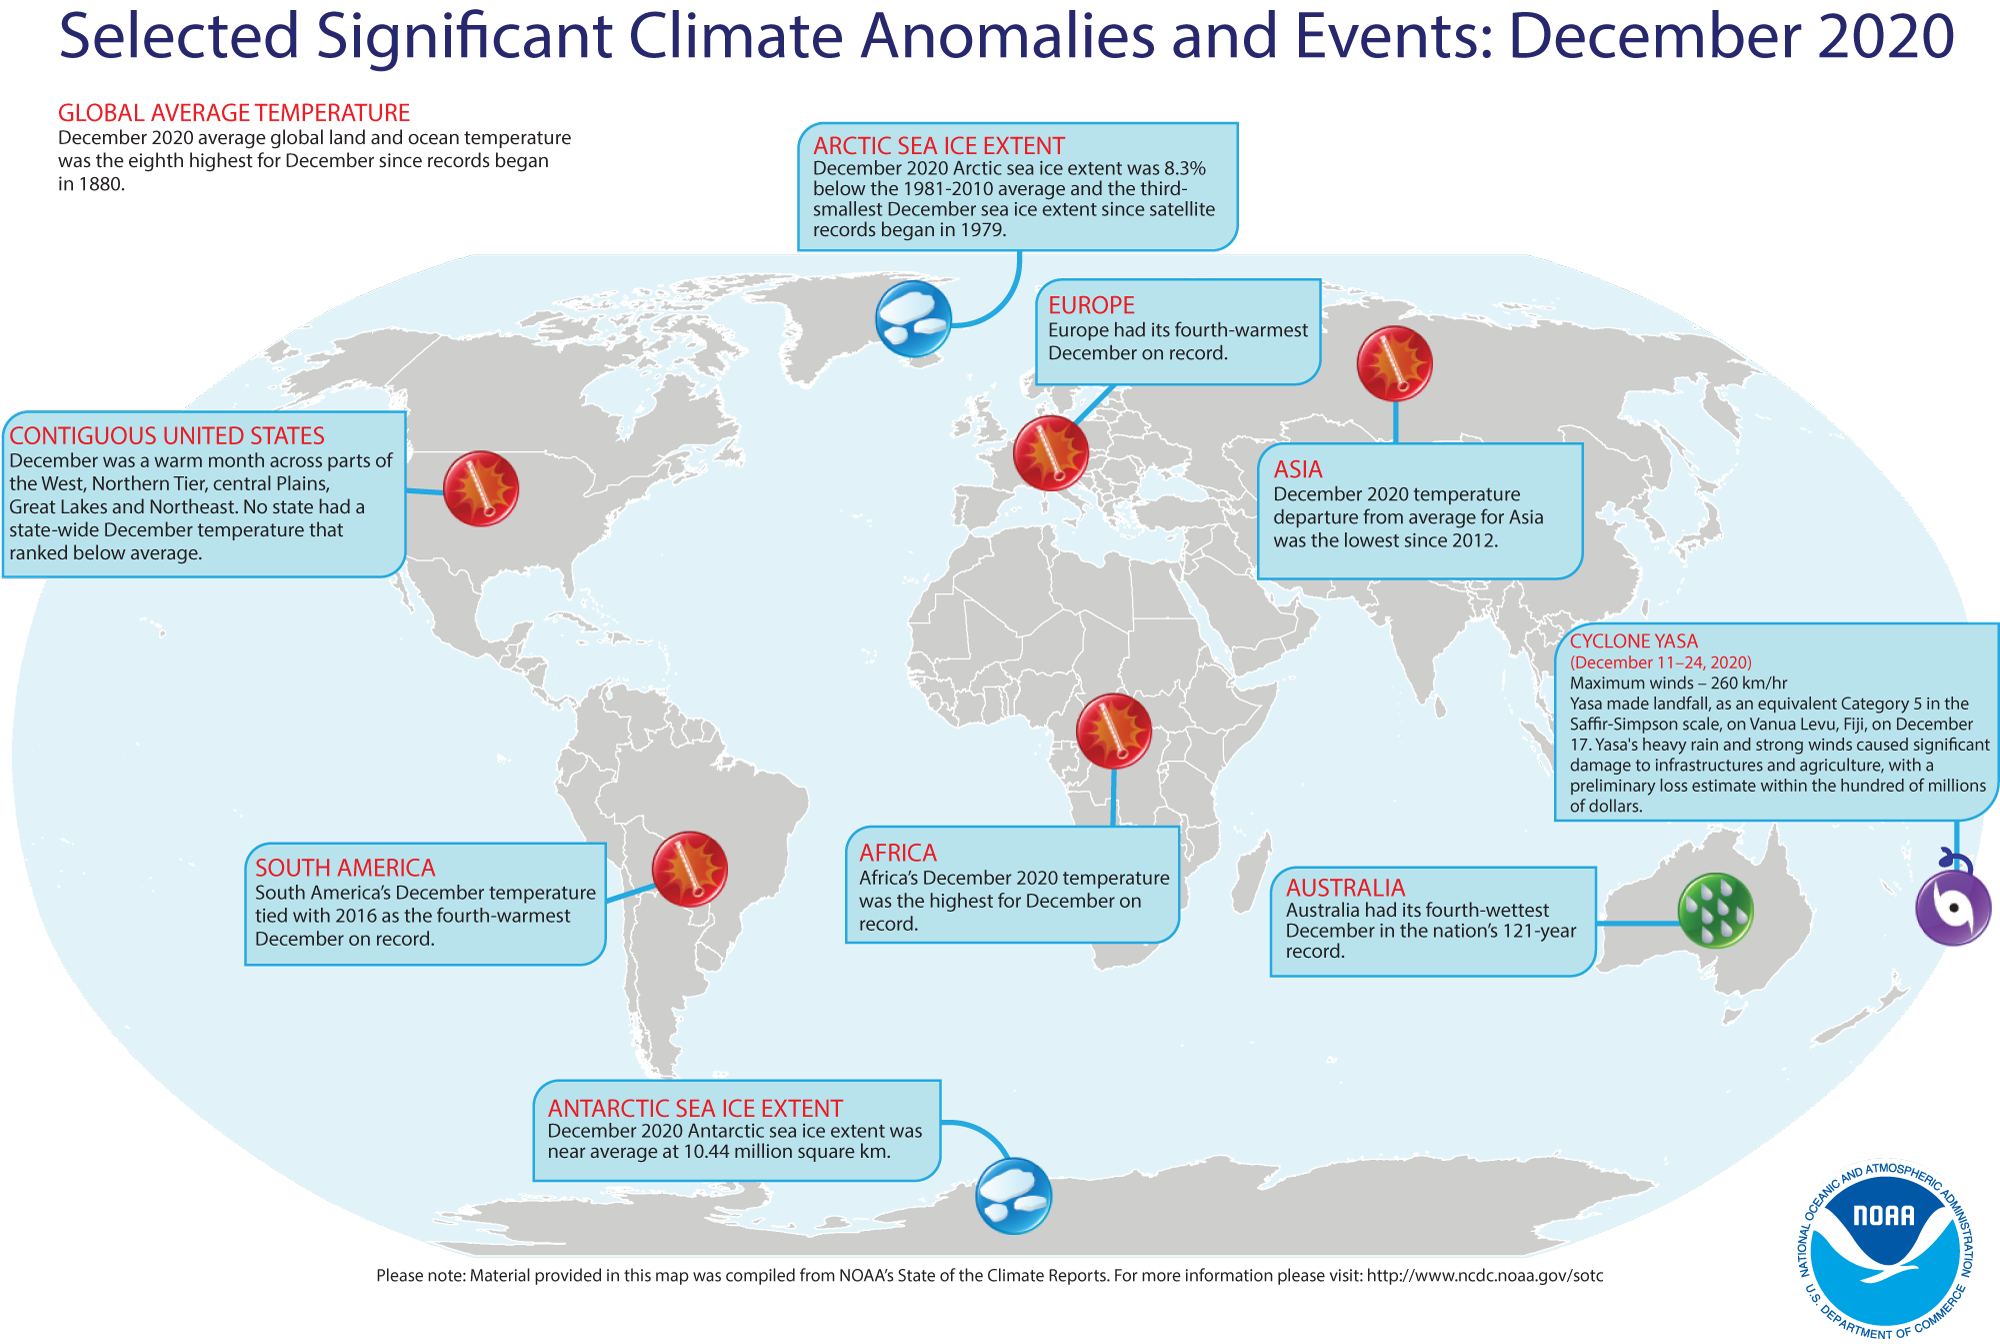
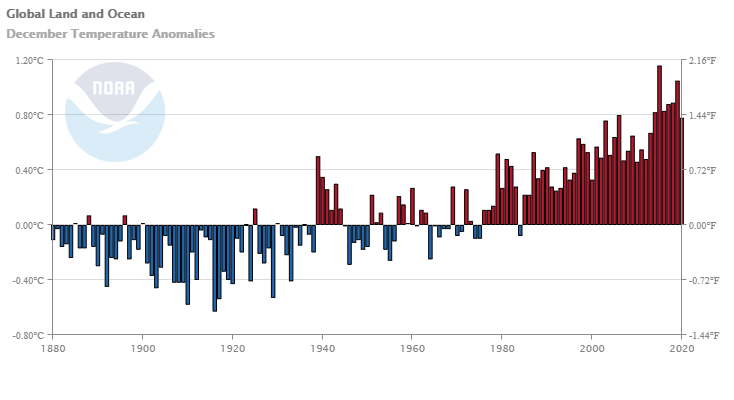
The global land and ocean surface temperature for December 2020 was 0.78°C (1.40°F) above the 20th century average and the eighth highest departure from average for December in the 1880–2020 record. Compared to recent months, this value was the smallest monthly temperature departure during 2020 and the smallest monthly temperature departure since February 2018.
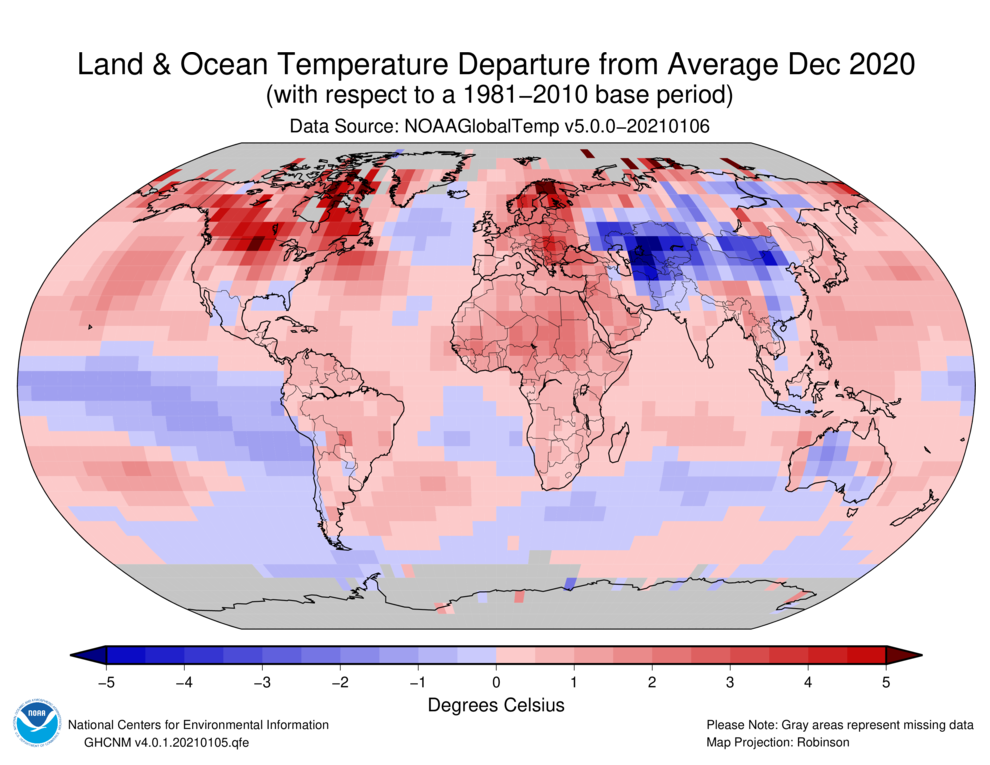
Notable warm temperature anomalies during the month were observed across parts of northern North America, Europe, northern Africa, the North Pacific Ocean, northern Atlantic Ocean, and across the Kara and Laptev seas, where temperatures were at least 2.0°C (3.6°F) above average. Record warm December temperatures were sparse and mainly present across small areas the Pacific and Atlantic oceans and Africa. Overall, only 3.68% of the world's land and ocean surfaces had a record warm December temperature—the smallest monthly percentage of record warm temperatures since February 2019. However, compared to all Decembers, this was the seventh highest December percentage since records began in 1951. Meanwhile, the most notable cooler-than-average conditions were present across parts of southern Asia, where temperatures were at least 2.0°C (3.6°F) below average. Other notable cooler-than-average conditions were present across the tropical Pacific Ocean, where La Niña was present during December 2020. However, no land or ocean areas had record-cold December temperatures.

The global land-only surface temperature for December was also the eighth highest on record, with a temperature departure of +1.27°C (+2.29°F). The global ocean-only surface temperature departure of +0.59°C (+1.06°F) was also the eighth highest in the 141-year record.
According to NCEI's Regional Analysis, North America, South America, Europe, Africa, and the Caribbean and Hawaiian regions had a December temperature departure from average that ranked among the seven highest for December on record. Of note, Africa had its warmest December on record with a temperature departure of +1.65°C (+2.97°F). This value was 0.13°C (0.23°F) higher than the previous record set in 2016. This was also Africa's tenth highest monthly temperature departure for all months on record. Meanwhile, Oceania and Asia had their smallest December temperature departure since 2011 and 2012, respectively.
| December | Anomaly | Rank (out of 141 years) | Records | ||||
|---|---|---|---|---|---|---|---|
| °C | °F | Year(s) | °C | °F | |||
| Global | |||||||
| Land | +1.27 ± 0.11 | +2.29 ± 0.20 | Warmest | 8th | 2015 | +1.98 | +3.56 |
| Coolest | 134th | 1929 | -1.29 | -2.32 | |||
| Ocean | +0.59 ± 0.15 | +1.06 ± 0.27 | Warmest | 8th | 2015 | +0.84 | +1.51 |
| Coolest | 134th | 1910 | -0.49 | -0.88 | |||
| Land and Ocean | +0.78 ± 0.14 | +1.40 ± 0.25 | Warmest | 8th | 2015 | +1.16 | +2.09 |
| Coolest | 134th | 1916 | -0.63 | -1.13 | |||
| Northern Hemisphere | |||||||
| Land | +1.45 ± 0.12 | +2.61 ± 0.22 | Warmest | 9th | 2015 | +2.20 | +3.96 |
| Coolest | 133rd | 1929 | -1.61 | -2.90 | |||
| Ocean | +0.88 ± 0.15 | +1.58 ± 0.27 | Warmest | 4th | 2015 | +1.00 | +1.80 |
| Coolest | 138th | 1904 | -0.53 | -0.95 | |||
| Land and Ocean | +1.10 ± 0.13 | +1.98 ± 0.23 | Warmest | 4th | 2015 | +1.46 | +2.63 |
| Coolest | 138th | 1916 | -0.78 | -1.40 | |||
| Ties: 2006 | |||||||
| Southern Hemisphere | |||||||
| Land | +0.83 ± 0.11 | +1.49 ± 0.20 | Warmest | 10th | 2019 | +1.51 | +2.72 |
| Coolest | 132nd | 1909 | -0.72 | -1.30 | |||
| Ties: 1994 | |||||||
| Ocean | +0.38 ± 0.16 | +0.68 ± 0.29 | Warmest | 26th | 2015 | +0.73 | +1.31 |
| Coolest | 116th | 1909, 1910 | -0.49 | -0.88 | |||
| Ties: 2000 | |||||||
| Land and Ocean | +0.45 ± 0.15 | +0.81 ± 0.27 | Warmest | 20th | 2015 | +0.84 | +1.51 |
| Coolest | 122nd | 1909 | -0.52 | -0.94 | |||
| Ties: 1982, 1987 | |||||||
| Arctic | |||||||
| Land and Ocean | +2.23 ± 0.15 | +4.01 ± 0.27 | Warmest | 9th | 2017 | +3.32 | +5.98 |
| Coolest | 133rd | 1916 | -2.89 | -5.20 | |||
| Ties: 1960 | |||||||


The most current data can be accessed via the Global Surface Temperature Anomalies page.
Year-to-date Temperature: January–December 202
Please see the NCEI State of the Climate Annual Global Analysis report for additional information.

| January–December | Anomaly | Rank (out of 141 years) | Records | ||||
|---|---|---|---|---|---|---|---|
| °C | °F | Year(s) | °C | °F | |||
| Global | |||||||
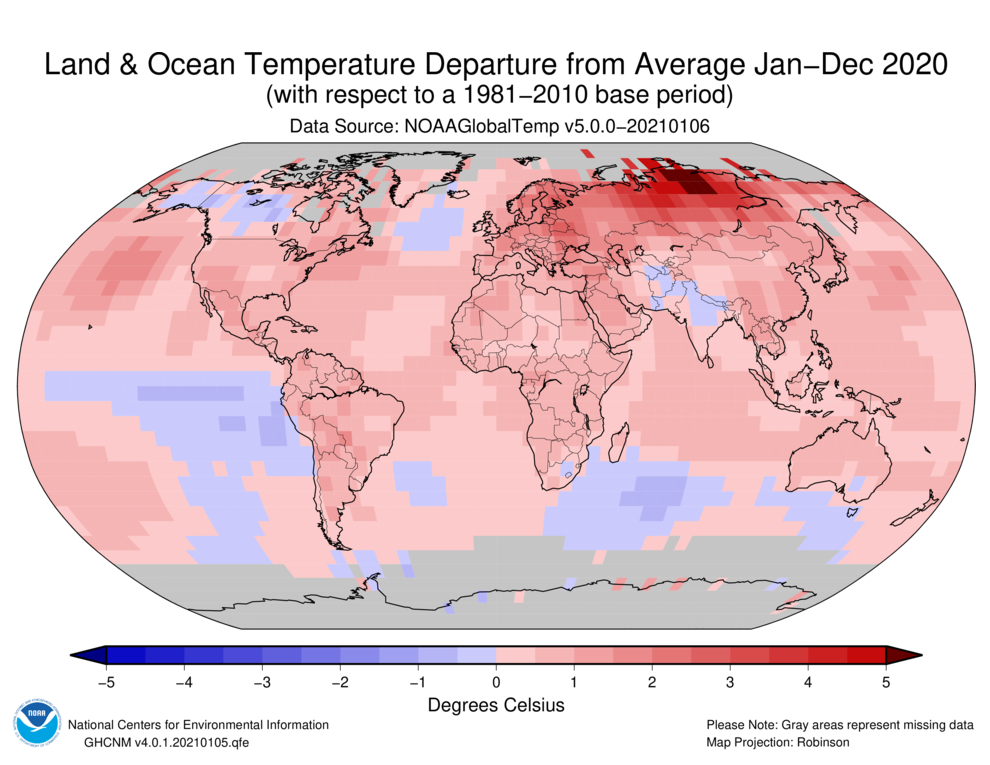
| Land | +1.59 ± 0.14 | +2.86 ± 0.25 | Warmest | 1st | 2020 | +1.59 | +2.86 |
| Coolest | 141st | 1884 | -0.71 | -1.28 | |||
| Ocean | +0.76 ± 0.16 | +1.37 ± 0.29 | Warmest | 3rd | 2016 | +0.79 | +1.42 |
| Coolest | 139th | 1904 | -0.46 | -0.83 | |||
| Land and Ocean | +0.98 ± 0.15 | +1.76 ± 0.27 | Warmest | 2nd | 2016 | +1.00 | +1.80 |
| Coolest | 140th | 1904 | -0.46 | -0.83 | |||
| Northern Hemisphere | |||||||
| Land | +1.74 ± 0.16 | +3.13 ± 0.29 | Warmest | 1st | 2020 | +1.74 | +3.13 |
| Coolest | 141st | 1884 | -0.80 | -1.44 | |||
| Ocean | +0.99 ± 0.16 | +1.78 ± 0.29 | Warmest | 1st | 2020 | +0.99 | +1.78 |
| Coolest | 141st | 1904 | -0.52 | -0.94 | |||
| Land and Ocean | +1.28 ± 0.15 | +2.30 ± 0.27 | Warmest | 1st | 2020 | +1.28 | +2.30 |
| Coolest | 141st | 1893, 1904, 1907 | -0.48 | -0.86 | |||
| Southern Hemisphere | |||||||
| Land | +1.21 ± 0.13 | +2.18 ± 0.23 | Warmest | 2nd | 2019 | +1.33 | +2.39 |
| Coolest | 140th | 1917 | -0.73 | -1.31 | |||
| Ocean | +0.58 ± 0.16 | +1.04 ± 0.29 | Warmest | 5th | 2016 | +0.70 | +1.26 |
| Coolest | 137th | 1909, 1911 | -0.43 | -0.77 | |||
| Ties: 2018 | |||||||
| Land and Ocean | +0.68 ± 0.15 | +1.22 ± 0.27 | Warmest | 5th | 2016 | +0.77 | +1.39 |
| Coolest | 137th | 1911 | -0.44 | -0.79 | |||
| Arctic | |||||||
| Land and Ocean | +2.24 ± 0.17 | +4.03 ± 0.31 | Warmest | 2nd | 2016 | +2.34 | +4.21 |
| Coolest | 140th | 1902 | -1.44 | -2.59 | |||


Precipitation
December Precipitation
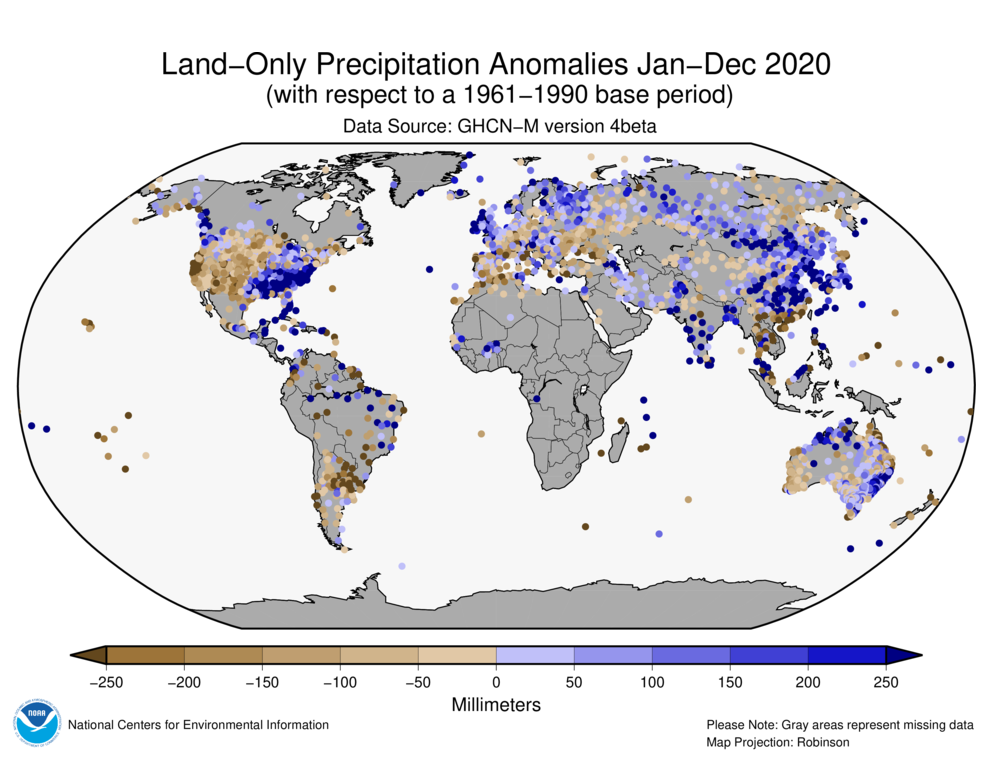

The maps shown above represent precipitation percent of normal (left, using a base period of 1961–1990) and precipitation percentiles (right, using the period of record) based on the GHCN dataset of land surface stations. As is typical, precipitation anomalies during December 2020 varied significantly around the world. December 2020 precipitation was generally drier than normal across parts of the western half of the contiguous U.S., Mexico, Hawaii, western, southern, and eastern parts of Asia, and southwestern Australia. Wetter-than-average conditions were present across parts of the southern contiguous U.S., Europe, western Africa, Mongolia, and across northern and eastern Australia.
Tropical Cyclone Yasa made landfall, as an equivalent Category 5 in the Saffir-Simpson scale, on Vanua Levu, Fiji, on December 17. Yasa's heavy rain and strong winds caused significant damage to infrastructures and agriculture, with a preliminary loss estimate within the hundreds of millions of dollars. According to Reliefweb, Yasa was the strongest storm in the Southwest Pacific basin since Tropical Cyclone Winston in 2016.
On December 27, Tropical Storm Chalane made landfall in Madagascar. According to Reliefweb, Chalane brought heavy rain and strong winds to the region. Preliminary reports stated that there were limited damage.
Australia had its fourth wettest December in the 121-year record at 94% above-average precipitation. Most regions had above-average precipitation during the month, with Western Australia having the highest at 194% above average. This was Western Australia's fourth wettest December on record. Meanwhile, Northern Territory had its fifth wettest on record. Only Victoria had a slightly below-average December precipitation at 24% below average.
Global Precipitation Climatology Project (GPCP)
The following analysis is based upon the Global Precipitation Climatology Project (GPCP) Interim Climate Data Record. It is provided courtesy of the GPCP Principal Investigator team at the University of Maryland.
The Global Precipitation Climatology Project (GPCP) monthly data set is a long-term (1979-present) analysis (Adler et al., 2018) using a combination of satellite and gauge information. An interim GPCP analysis completed within ~10 days of the end of the month allows its use in climate monitoring.

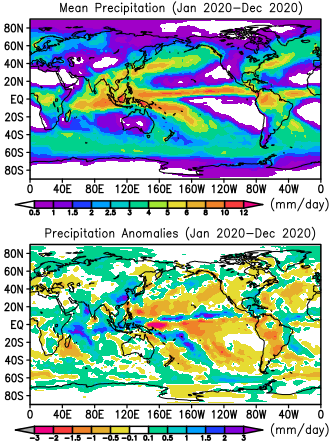
The global mean rainfall map for December 2020 (Fig. 1, top panel) generally reflects the usual patterns of the December solstice, with active storm tracks in the Northern Hemisphere Pacific and Atlantic Oceans into the continents to the east. These precipitation maxima are significantly stronger than the corresponding Southern Hemisphere mid/high latitude maxima. The summer monsoon has almost completely retreated from South Asia and rainfall has shifted into Australia. Rainfall maxima over Africa and South America shift southward with the sun. However, across the tropical Pacific and Atlantic the ITCZ remains just north of the Equator, seasonally shifting less latitude-wise than the land rainfall features.
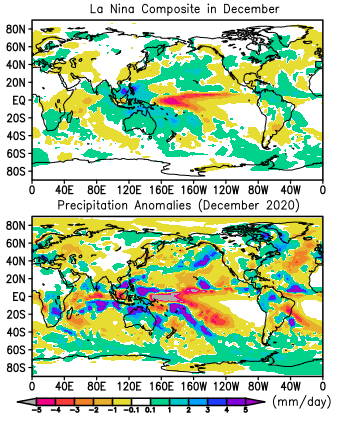
The precipitation anomaly map for this December (Fig. 1, bottom panel) has a mixture of large-scale and small-scale regional features of both signs. Across the tropics wide areas of negative are interspersed with generally smaller areas of positive anomalies. A focus of the tropical anomalies is the very strong negative feature at about 160°E along the Equator, negative tentacles stretching out to the east along the ITCZ and to the southeast. This negative precipitation anomaly feature is related to the ongoing La Niña and its negative SST anomaly in this region. With La Niña one would expect positive anomalies over the Maritime Continent and there are, but the pattern is more diffuse.
In order to examine the effect of La Niña on this month?s precipitation pattern a composite anomaly map was calculated of 14 Decembers (not including Dec. 2020) when the Nino 3.4 SST index was in La Niña territory. That composite for December La Niña conditions (Fig. 2, top panel) is much smoother than the field for December 2020 (repeated here for easy comparison, Fig. 2, bottom panel). However, there are definitely some strong similarities. In the composite the negative feature near 170°E along the Equator and its extensions to the east and southeast certainly parallel the features for this month. To the west in the composite the weaker, generally positive feature is more uniform than the individual month, although in both figures the Borneo area shows a drier than normal area. Australia is dominated by positive anomalies in both panels. Back in the Pacific the December 2020 anomaly shows a negative feature across the sub-tropics, with a distinct break southeast of Hawaii. The composite is similar, but with a broader positive feature surrounding Hawaii. Further east the composite shows negative anomalies across the southern part of the North American continent, while this past month has a mixed pattern, although the southwest U.S. is negative in the composite and for this December. An interesting long, narrow feature of positive anomaly for December 2020 runs from the Philippine Islands northeastward across the Pacific to the coast of Canada. A very similar feature can be seen in the La Niña composite. Other regions of agreement between the composite and particular month include much of south America and southern Africa. This exercise shows the powerful effect of the circulation changes (and resulting precipitation patterns) related to the SST anomalies of the El Niño/Southern Oscillation (ENSO) phenomenon.
A quick look at the entirety of 2020 (Fig. 3) features a strong (positive rainfall anomaly) ITCZ across the Pacific and also the Atlantic and Indian Oceans. To either side of the ITCZ broad areas of negative anomalies prevail and extend into North and South America. The year 2020 began with moderate El Niño conditions for the first three months, then roughly neutral conditions until La Nina evolved and affected the last three months. Because the ENSO effect is muted for the whole year, the anomaly pattern is more affected by inter-decadal variations and changes related to global warming. Further analysis is underway examining 2020 in more detail.
Background discussion of long-term means, variations and trends of global precipitation can be found in Adler et al. (2017).
Ocean Heat Content
Ocean Heat Content (OHC) is essential for understanding and modeling global climate since > 90% of excess heat in the Earth's system is absorbed by the ocean. Further, expansion due to increased ocean heat contributes to sea level rise. Change in OHC is calculated from the difference of observed temperature profiles from the long-term mean.
| Basin | 0-700 meters | Rank (1955-2023) | |||||
|---|---|---|---|---|---|---|
| Entire Basin | Northern Hemisphere | Southern Hemisphere | ||||
| Atlantic | 7.457 | 5th | 3.936 | 7th | 3.521 | 5th |
| Indian | 4.124 | 7th | 0.951 | 1st | 3.173 | 10th |
| Pacific | 6.082 | 5th | 3.116 | 5th | 2.966 | 7th |
| World | 17.663 | 6th | 8.003 | 4th | 9.660 | 7th |
| Source: Basin time series of heat content | ||||||

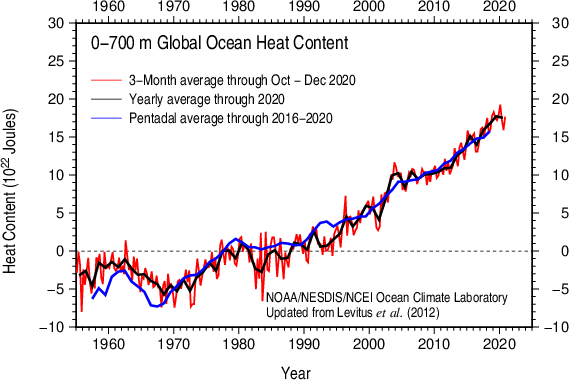
Global OHC for October–December 2020 is statistically the same as the OHC of October–December 2018 and 2019: together, they are the three top October–December OHC's in our records, which extend back to 1955. Despite the significant warming observed in January–March 2020, the annual global OHC for 2020 is relatively unchanged from 2019, previously the highest annual OHC on record: while the 0–700m OHC is slightly lower, the 0–2000m annual global OHC is slightly higher than in 2019. Overall, the latest quarterly OHC reveals widespread warmer than normal conditions relative to the 1955–2006 mean, a situation observed since the end of 2016. However, a drop in the global OHC since January–March 2020 has occurred, which concides with the development in the last nine months of a La Nina event. OHC decreased in April–June and again in July–September, compared to January–March, before increasing in October–December. The cool signal first observed in July–September 2020, < -10x105 J/m3, in the tropical and subtropical Eastern Pacific Ocean and extending westward around the Equator from the South America coast to about 170E has strengthened in October–December 2020. Otherwise, global OHC conditions are similar to those observed during July–September 2020, with warm areas along the Antarctic Circumpolar Current in the Indian sector, in the Southern Hemisphere subtropics, and in the North Atlantic Current increasing incrementally. Much higher, > 30x105 J/m3, than normal OHC conditions continue to exist in the Gulf Stream/North Atlantic Current, the South Atlantic Ocean, and the Tasman Sea. Much warmer than normal conditions, > 30x105 J/m3, exist along the Kuroshio Current/Kuroshio Extension/North Pacific Current, the Scotia Sea, and Northwestern Weddell Sea. Warm conditions, around 10x105 J/m3, still dominate the North Indian Ocean. In contrast, cool conditions, < -10x105 J/m3, appear in the Southwestern Indian Ocean, while much lower, < -30x105 J/m3, than normal conditions persist in the subpolar North Atlantic Ocean south of Greenland and Iceland.
References
- Adler, R., G. Gu, M. Sapiano, J. Wang, G. Huffman 2017. Global Precipitation: Means, Variations and Trends During the Satellite Era (1979-2014). Surveys in Geophysics 38: 679-699, doi:10.1007/s10712-017-9416-4
- Adler, R., M. Sapiano, G. Huffman, J. Wang, G. Gu, D. Bolvin, L. Chiu, U. Schneider, A. Becker, E. Nelkin, P. Xie, R. Ferraro, D. Shin, 2018. The Global Precipitation Climatology Project (GPCP) Monthly Analysis (New Version 2.3) and a Review of 2017 Global Precipitation. Atmosphere. 9(4), 138; doi:10.3390/atmos9040138
- Gu, G., and R. Adler, 2022. Observed Variability and Trends in Global Precipitation During 1979-2020. Climate Dynamics, doi:10.1007/s00382-022-06567-9
- Huang, B., Peter W. Thorne, et. al, 2017: Extended Reconstructed Sea Surface Temperature version 5 (ERSSTv5), Upgrades, validations, and intercomparisons. J. Climate, doi: 10.1175/JCLI-D-16-0836.1
- Huang, B., V.F. Banzon, E. Freeman, J. Lawrimore, W. Liu, T.C. Peterson, T.M. Smith, P.W. Thorne, S.D. Woodruff, and H-M. Zhang, 2016: Extended Reconstructed Sea Surface Temperature Version 4 (ERSST.v4). Part I: Upgrades and Intercomparisons. J. Climate, 28, 911-930, doi:10.1175/JCLI-D-14-00006.1.
- Menne, M. J., C. N. Williams, B.E. Gleason, J. J Rennie, and J. H. Lawrimore, 2018: The Global Historical Climatology Network Monthly Temperature Dataset, Version 4. J. Climate, in press. https://doi.org/10.1175/JCLI-D-18-0094.1.
- Peterson, T.C. and R.S. Vose, 1997: An Overview of the Global Historical Climatology Network Database. Bull. Amer. Meteorol. Soc., 78, 2837-2849.
- Vose, R., B. Huang, X. Yin, D. Arndt, D. R. Easterling, J. H. Lawrimore, M. J. Menne, A. Sanchez-Lugo, and H. M. Zhang, 2021. Implementing Full Spatial Coverage in NOAA's Global Temperature Analysis. Geophysical Research Letters 48(10), e2020GL090873; doi:10.1029/2020gl090873.