
Introduction
Temperature anomalies and percentiles are shown on the gridded maps below. The anomaly map on the left and the percentiles map on the right are a product of a merged land surface temperature (Global Historical Climatology Network, GHCN) and sea surface temperature (ERSST version 5) anomaly analysis. The anomalies maps tell us whether the temperature observed for a specific place and time period was warmer or cooler than a reference value and by how much. While the percentile map provides additional information by placing the temperature anomaly observed into historical perspective, showing how the most current month, season or year compares with the past. Temperature anomalies for land and ocean are analyzed separately and then merged to form the global analysis. For more information, please visit NCEI's Global Surface Temperature Anomalies page.
Temperature
In the atmosphere, 500-millibar height pressure anomalies correlate well with temperatures at the Earth's surface. The average position of the upper-level ridges of high pressure and troughs of low pressure—depicted by positive and negative 500-millibar height anomalies on the June 2020 map—is generally reflected by areas of positive and negative temperature anomalies at the surface, respectively.
Monthly Temperature: June 2020
During June 2020, temperature departures of +1.5°C (+2.7°F) or higher were present across parts of the central contiguous U.S., southern Brazil, northern and eastern Europe, northern Russia, southern China, and the North Pacific Ocean. Record-warm June temperatures were observed across parts of Scandinavia, Africa, Asia, South America, and the Atlantic, Indian, and Pacific oceans. Overall, June 2020 had 6.74% of the world's land and ocean surfaces with a record high June temperature. This was the fifth highest percentage for June record warm temperatures since records began in 1951, behind 2019 (8.55%), 2016 (8.49%), 2010 (7.74%), and 2015 (7.68%).
Cooler-than-average temperatures were present across parts of western and southeastern Russia, India, Greenland, the North Atlantic Ocean, and a small area across the eastern tropical Pacific Ocean. However, no land or ocean areas had a record-cold June temperature.


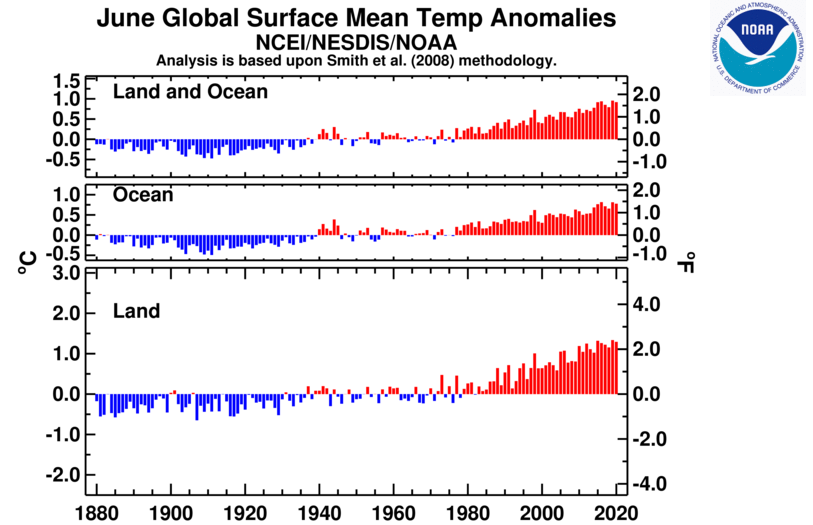
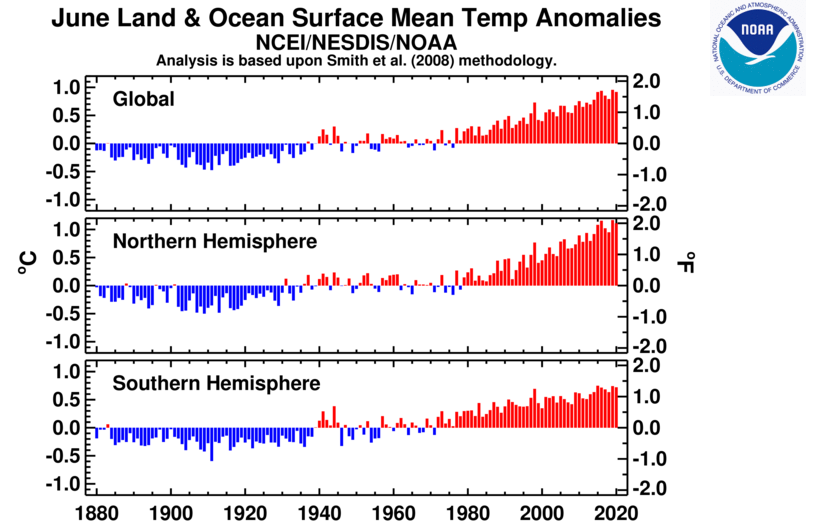
Averaged as a whole, the global land and ocean surface temperature for June 2020 was 0.92°C (1.66°F) above the 20th century average of 15.5°C (59.9°F), tying with 2015 as the third highest June temperature departure from average in the 141-year record. June 2020 marked the 44th consecutive June and the 426th consecutive month with temperatures, at least nominally, above the 20th century average. Nine of the 10 warmest Junes have occurred since 2010; the seven warmest Junes have occurred in the last seven years (2014–2020).

The June 2020 global land-only surface temperature was also the third highest for June at 1.29°C (2.32°F) above average. The global ocean-only surface temperature of 0.77°C (1.39°F) was also the third highest for June in the 141-year record.
Regionally, South America, Europe, and Africa had their third highest June temperature departure since records began in 1910. The Caribbean region's June 2020 temperature departure tied with 2016 as the fourth highest for June on record.
| June | Anomaly | Rank (out of 141 years) | Records | ||||
|---|---|---|---|---|---|---|---|
| °C | °F | Year(s) | °C | °F | |||
| Global | |||||||
| Land | +1.29 ± 0.18 | +2.32 ± 0.32 | Warmest | 3rd | 2019 | +1.34 | +2.41 |
| Coolest | 139th | 1907 | -0.65 | -1.17 | |||
| Ocean | +0.78 ± 0.14 | +1.40 ± 0.25 | Warmest | 3rd | 2016, 2019 | +0.81 | +1.46 |
| Coolest | 139th | 1911 | -0.49 | -0.88 | |||
| Land and Ocean | +0.92 ± 0.15 | +1.66 ± 0.27 | Warmest | 3rd | 2019 | +0.96 | +1.73 |
| Coolest | 139th | 1909, 1911 | -0.47 | -0.85 | |||
| Ties: 2015 | |||||||
| Northern Hemisphere | |||||||
| Land | +1.30 ± 0.19 | +2.34 ± 0.34 | Warmest | 6th | 2012 | +1.52 | +2.74 |
| Coolest | 136th | 1907 | -0.77 | -1.39 | |||
| Ties: 2017, 2018 | |||||||
| Ocean | +0.99 ± 0.14 | +1.78 ± 0.25 | Warmest | 2nd | 2019 | +1.04 | +1.87 |
| Coolest | 140th | 1904, 1913 | -0.52 | -0.94 | |||
| Land and Ocean | +1.11 ± 0.16 | +2.00 ± 0.29 | Warmest | 3rd | 2019 | +1.17 | +2.11 |
| Coolest | 139th | 1909 | -0.50 | -0.90 | |||
| Southern Hemisphere | |||||||
| Land | +1.28 ± 0.12 | +2.30 ± 0.22 | Warmest | 2nd | 2015 | +1.31 | +2.36 |
| Coolest | 140th | 1911 | -1.02 | -1.84 | |||
| Ocean | +0.62 ± 0.15 | +1.12 ± 0.27 | Warmest | 5th | 2016 | +0.71 | +1.28 |
| Coolest | 137th | 1911 | -0.51 | -0.92 | |||
| Ties: 2017 | |||||||
| Land and Ocean | +0.72 ± 0.15 | +1.30 ± 0.27 | Warmest | 3rd | 2015 | +0.75 | +1.35 |
| Coolest | 139th | 1911 | -0.59 | -1.06 | |||
| Ties: 2016 | |||||||
| Arctic | |||||||
| Land and Ocean | +1.72 ± 0.23 | +3.10 ± 0.41 | Warmest | 4th | 2016 | +2.03 | +3.65 |
| Coolest | 138th | 1886 | -1.39 | -2.50 | |||
The most current data can be accessed via the Global Surface Temperature Anomalies page.
Select national information is highlighted below. Please note that different countries report anomalies with respect to different base periods. The information provided here is based directly upon these data:
- According to the Finnish Meteorological Institute, nearly half of Finland's weather stations had their warmest June on record, with some locations reporting temperatures that were 4.0°–5.0°C (7.2°–9.0°F) above average. Several locations also had a total of 21 hot days (maximum temperatures above 25.0°C [77.0°F]), tying with June 1999 with the highest number of hot days on record.
- Norway had its second warmest June since national records began in 1900, with a June temperature departure of +3.2°C (+5.8°F). This was only 0.5°C (0.9°F) shy of tying the record-warm June of 1953.
- A potential new maximum temperature north of the Arctic Circle was set on June 20, when temperatures rose to 38.0°C (100.4°F) in the Russian town of Verkhoyansk. If this value is approved by the World Meteorological Organization (WMO), it would be the highest temperature ever recorded north of the Arctic Circle. The previous record for the town of Verkhoyansk was 37.3°C (99.1°F) set on July 25, 1998.
- The Kingdom of Bahrain had a mean temperature of 34.7°C (94.5°F), which is 2.3°C (4.1°F) above average and tied with 2012 as the sixth highest for June since national records began in 1902. The nation's maximum and minimum temperatures were 2.6°C (4.7°F) and 2.2°C (4.0°F) above average, respectively, and each ranked among the eight highest on record.
- Hong Kong's average minimum temperature for June 2020 was 27.8°C (82.0°F) or 1.6°C (2.9°F) above average. This was the highest June temperature on record for Hong Kong. Meanwhile, the average mean and maximum temperatures were second highest at 29.6°C (85.3°F) and 32.3°C (90.1°F), respectively. According to the Hong Kong Observatory, Hong Kong had a total of 18 hot nights during June 2020, tying with July 1993 as one of the highest record number of hot nights in a month.
- Above-average temperatures were present across much of Australia during June 2020. The national June mean temperature was 1.10°C (1.98°F) above the 1961–1990 average and tied as the seventh highest June temperature in the nation's 111-year record. The nation's above-average mean temperature was mainly driven by the very warm maximum temperatures observed across the nation. As a whole, the nation's maximum temperature was the third highest on record at 1.70°C (3.06°F) above average. Regionally, Western Australia had its third highest mean temperature on record, while the maximum temperature was the highest on record. South Australia and Victoria were the only regions to have near-normal temperatures during June 2020.
- New Zealand's June 2020 temperature departure of +1.4°C (+2.5°F) was the fifth warmest June since national records began in 1909. Several locations had temperatures that were at least 2.0°C (3.6°F) above average.
Year-to-date Temperature: January–June 2020
The first half of the year had warmer-than-average conditions across much of the globe; however, the most notable warm January–June temperature departures were observed across much of central and eastern Europe and northern Asia, where temperatures were 2.0°C (3.6°F) above average or higher. Meanwhile, the most notable cool temperature departures of -1.0°C (-1.8°F) or cooler were present across Alaska, parts of western Canada, and northern India.
Record-warm January–June temperatures were present across parts of Mexico, Central America, the Gulf of Mexico, South America, the Atlantic Ocean, Europe, Asia, and across parts of the Pacific and southern Indian oceans. However, no land or ocean areas had record cold January–June temperatures.
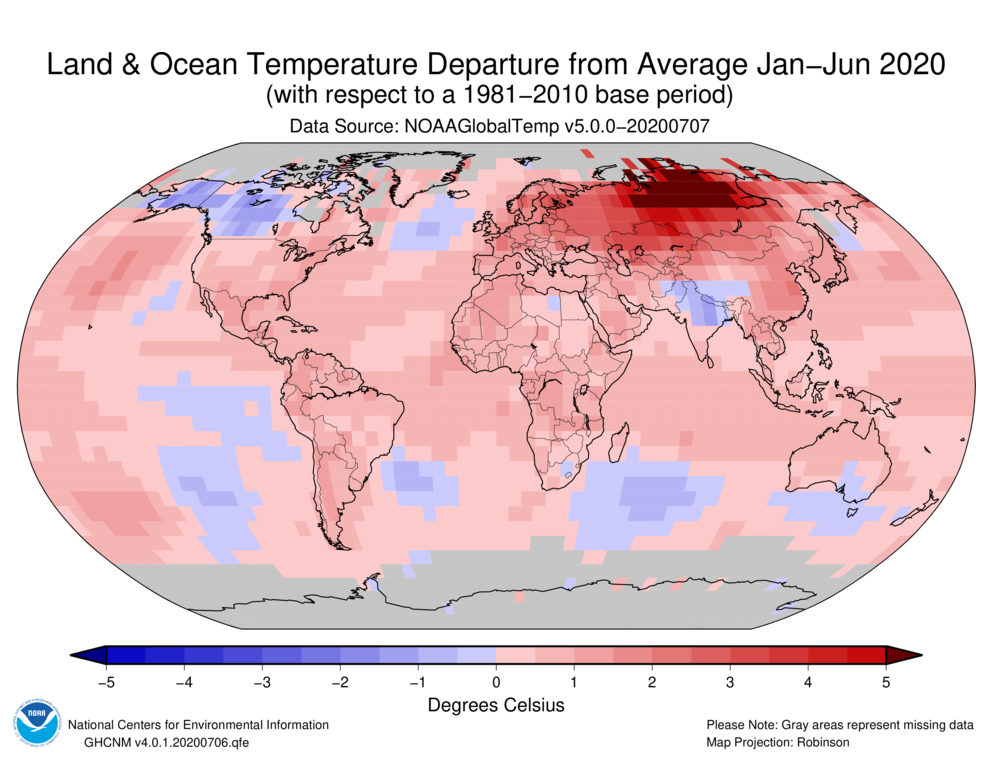

Averaged as a whole, the January–June 2020 global land and ocean surface temperature was 1.07°C (1.93°F) above the 20th century average of 13.5°C (56.3°F). This was only 0.05°C (0.09°F) shy of tying the record warm January–June of 2016. According to a statistical analysis done by NCEI scientists, the year 2020 is very likely to rank among the five warmest years on record.

Regionally, South America, Europe, and Asia had their warmest January–June since regional records began in 1910. South America surpassed the now second warmest January–June of 2019 by 0.06°C (0.11°F). Europe's January–June 2020 temperature was 2.24°C (4.03°F) above average, surpassing the previous record set in 2007 by 0.16°C (0.29°F). The January–June 2020 also marked the second time Europe's January–June temperature departure surpassed 2.0°C (3.6°F). Asia's year-to-date temperature departure was 2.78°C (5.00°F) above average. This value exceeded the previous record set in 2016 by +0.56°C (+1.01°F).
The Caribbean region and Africa had their second- and third-highest January-June temperature departure from average on record, respectively.
| January–June | Anomaly | Rank (out of 141 years) | Records | ||||
|---|---|---|---|---|---|---|---|
| °C | °F | Year(s) | °C | °F | |||
| Global | |||||||
| Land | +1.82 ± 0.16 | +3.28 ± 0.29 | Warmest | 2nd | 2016 | +1.87 | +3.37 |
| Coolest | 140th | 1893 | -0.85 | -1.53 | |||
| Ocean | +0.79 ± 0.17 | +1.42 ± 0.31 | Warmest | 2nd | 2016 | +0.84 | +1.51 |
| Coolest | 140th | 1904, 1911 | -0.50 | -0.90 | |||
| Land and Ocean | +1.07 ± 0.17 | +1.93 ± 0.31 | Warmest | 2nd | 2016 | +1.12 | +2.02 |
| Coolest | 140th | 1911 | -0.54 | -0.97 | |||
| Northern Hemisphere | |||||||
| Land | +2.07 ± 0.18 | +3.73 ± 0.32 | Warmest | 2nd | 2016 | +2.11 | +3.80 |
| Coolest | 140th | 1893 | -0.96 | -1.73 | |||
| Ocean | +0.94 ± 0.16 | +1.69 ± 0.29 | Warmest | 2nd | 2016 | +0.95 | +1.71 |
| Coolest | 140th | 1904 | -0.52 | -0.94 | |||
| Land and Ocean | +1.37 ± 0.17 | +2.47 ± 0.31 | Warmest | 2nd | 2016 | +1.39 | +2.50 |
| Coolest | 140th | 1893 | -0.63 | -1.13 | |||
| Southern Hemisphere | |||||||
| Land | +1.20 ± 0.15 | +2.16 ± 0.27 | Warmest | 3rd | 2019 | +1.35 | +2.43 |
| Coolest | 139th | 1917 | -0.87 | -1.57 | |||
| Ocean | +0.69 ± 0.17 | +1.24 ± 0.31 | Warmest | 2nd | 2016 | +0.77 | +1.39 |
| Coolest | 140th | 1911 | -0.52 | -0.94 | |||
| Ties: 2017 | |||||||
| Land and Ocean | +0.77 ± 0.17 | +1.39 ± 0.31 | Warmest | 3rd | 2016 | +0.85 | +1.53 |
| Coolest | 139th | 1911 | -0.54 | -0.97 | |||
| Arctic | |||||||
| Land and Ocean | +2.41 ± 0.32 | +4.34 ± 0.58 | Warmest | 3rd | 2016 | +2.92 | +5.26 |
| Coolest | 139th | 1902 | -1.59 | -2.86 | |||


France had its warmest January–June since national records began in 1900 with a temperature of 12.5°C (54.5°F), which is 1.8°C (3.2°F) above the 1981–2010 average. This value was only 0.1°C (0.2°F) higher than the now second warmest January–June period set in 2007.
Precipitation
June Precipitation


The maps shown above represent precipitation percent of normal (left, using a base period of 1961–1990) and precipitation percentiles (right, using the period of record) based on the GHCN dataset of land surface stations. As is typical, precipitation anomalies during June 2020 varied significantly around the world. June 2020 precipitation was generally drier than normal across the southwestern and northeastern contiguous U.S., southern Brazil, northern Argentina, western Spain, Norway, western and eastern Russia, northwestern China, and Australia. Wetter-than-average conditions were present across parts of the northern contiguous U.S., southern South America, central Europe, southeastern Russia, Mongolia, the Korean Peninsula, and southern China.
Select national information is highlighted below. (Please note that different countries report anomalies with respect to different base periods. The information provided here is based directly upon these data):
- Portugal had a drier-than-average during June 2020 with only 27% of normal precipitation. According to the Portuguese Institute for Sea and Atmosphere, weak to moderate drought was present across the southern region of Portugal.
- Tropical Storm Cristobal, which was the earliest third tropical storm on record in the Atlantic Basin, made landfall in eastern Mexico on June 3. Cristobal brought torrential rains that prompted floods and landslides across southern Mexico and parts of Guatemala. Over 200 houses were damaged and over 500 people were affected.
- According to Reliefweb, the Abidjan Department of Cote d'Ivoire had heavy rains that triggered flash floods on June 25. Several major road infrastructures were flooded or damaged. The event affected over 8,000 people.
- Drier-than-average conditions engulfed much of Australia during June 2020. The national rainfall for the month was 54% below average and the third driest in the nation's 121-year precipitation record. Regionally, the Northern Territory had the largest rainfall deficit at 98% below average, resulting in its driest June since 2006 and the 10th driest on record. Western Australia also had its 10th driest June on record. Tasmania was the only region with near-normal conditions; however, no region had above-average conditions during June 2020.
Global Precipitation Climatology Project (GPCP)
The following analysis is based upon the Global Precipitation Climatology Project (GPCP) Interim Climate Data Record. It is provided courtesy of the GPCP Principal Investigator team at the University of Maryland.
The Global Precipitation Climatology Project (GPCP) monthly data set is a long-term (1979-present) analysis (Adler et al., 2018) using a combination of satellite and gauge information. An interim GPCP analysis completed within ~10 days of the end of the month allows its use in climate monitoring.

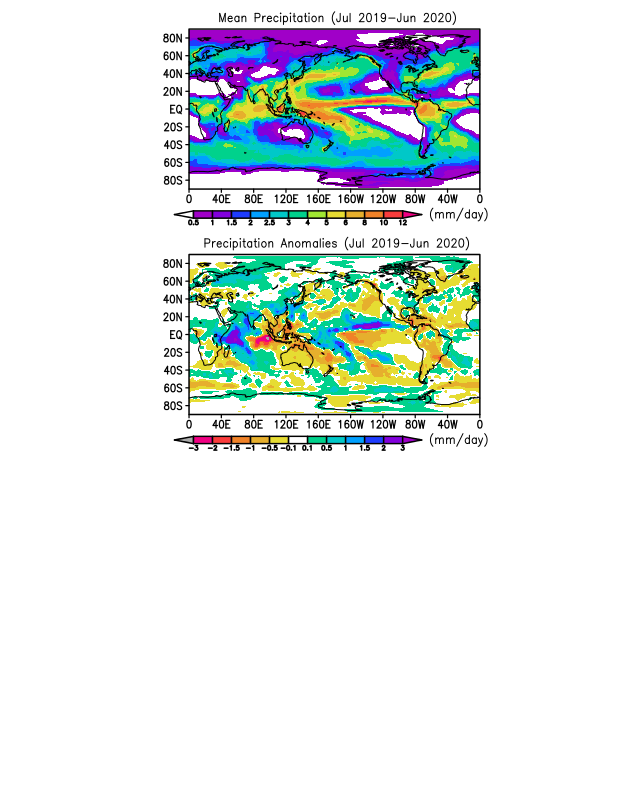
For the Northern Hemisphere solstice month (June) the ITCZ sits north of the Equator across the Pacific and Atlantic Oceans (Fig. 1, top panel). Over South America and Africa, the ITCZ is broader, with specific maxima across the planet's middle. The South Indian Ocean shows unusual maxima south of the Equator, possibly related to a warm SST anomaly there. The only break in the continual east-west ITCZ is at the horn of Africa, typical of this time of year.
The anomaly field (Fig. 1, middle panel) for this early part of Asian summer monsoon has a split, somewhat as in last month with a positive anomaly generally running from the southern Philippines through Borneo and into the South Indian Ocean to the rainfall features already mentioned. A relatively dry zone (negative anomalies) lies across the northern Philippines through Indochina and into the Bay of Bengal. To the north of that band there is a very strong band of rainfall and positive anomalies from the Arabian Sea, across India and Bangladesh, across southern and middle China and over to southern Japan. These rainfall features were associated with flooding in India and Bangladesh in the early part of the month and very strong floods at various times during the month across the southern half of China. Monthly rainfall accumulations were above 500 mm in some locations in China. Floods also occurred in southern Japan, especially late in the month and continuing into July. These heavy rainfall features in the China-Japan area are a likely combination of springtime Maiu front activity, along with the beginning of the summer monsoon.
To the south, Australia and southern Africa are normally dry this time of year, but show rainfall deficits from normal, especially evident in the percentage anomaly chart (Fig. 1, bottom panel). Drought conditions continue in these areas even as they go into their climatological dry periods. With ENSO-neutral conditions holding sway from the Pacific, the climatology and the monsoon should dominate in this region. Across the tropical Pacific both the ITCZ and the SPCZ are shifted toward the north as seen by the banded positive-negative, east-west features. Poleward of these features in both hemispheres the Pacific is dominated by negative anomalies.
Over Eurasia the anomaly field (Fig. 1, middle panel) has positive-negative features lined up in an east-west direction with western Europe being relatively wet and then alternating toward the east ending up with a dry area in Siberia, where very warm temperatures combined with that drying have resulted in unusual wildfires. Over South America, the north coastal area is dry and south Brazil coastal area has wet anomaly, partly associated with floods at the end of the month. In Central America a small wet anomaly feature is centered over Yucatan, with an extension northward over the Gulf of Mexico and into the U.S. This feature is the effect of Tropical Storm Cristobal from early June. The Atlantic hurricane season is off to a fast start with four named storms by the end of June, but in addition to Cristobal over the gulf, they have developed along the coastal U.S., even at high latitudes over the Gulf Stream. Over the Caribbean and to the east in the more typical development area over the Atlantic, there is a rainfall deficit dominating, which is probably due in part to the dry Saharan dust layer in the news during this month. Over North America, Alaska, Canada and the northwest U.S. are relatively wet with the southwest U.S. with below normal rainfall, with significant drought. The dry conditions resulted in multiple fires in Arizona and other states in that region.
Here at the halfway point in 2020 a quick look at the last full year gives a longer perspective of the recent global precipitation fields, as seen in Fig. 2. Some key features in this longer-term look include the large negative (dry) anomaly that covers the Maritime Continent, Australia and the eastern Indian Ocean, and extends northwestward into Indochina. The two strongest features are over the Indian Ocean, with the negative feature already mentioned and the strong positive feature to the west and extending into eastern Africa. The eastern Pacific ITCZ is intense and displaced to the north from climatology and the tropical North Atlantic is relatively dry. The western U.S. is also dry over the last twelve months.
Background discussion of long-term means, variations and trends of global precipitation can be found in Adler et al. (2017).
Ocean Heat Content
Ocean Heat Content (OHC) is essential for understanding and modeling global climate since > 90% of excess heat in the Earth's system is absorbed by the ocean. Further, expansion due to increased ocean heat contributes to sea level rise. Change in OHC is calculated from the difference of observed temperature profiles from the long-term mean.
| Basin | 0-700 meters | Rank (1955-2023) | |||||
|---|---|---|---|---|---|---|
| Entire Basin | Northern Hemisphere | Southern Hemisphere | ||||
| Atlantic | 7.590 | 4th | 3.937 | 5th | 3.653 | 3rd |
| Indian | 2.947 | 12th | 1.033 | 2nd | 1.914 | 14th |
| Pacific | 6.750 | 4th | 3.416 | 3rd | 3.334 | 6th |
| World | 17.286 | 5th | 8.385 | 2nd | 8.901 | 6th |
| Source: Basin time series of heat content | ||||||

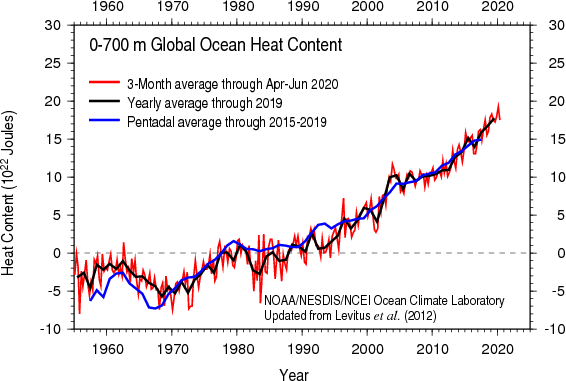
Global OHC for April–June 2020 tied with April–June 2019 for the highest April–June OHC in our records, which extend back to 1955. Overall, the latest quarterly OHC reveals widespread warmer than normal conditions relative to the 1955–2006 mean, a situation observed since the end of 2016. Cool conditions, < -10x105 J/m3, in the tropical and subtropical western Pacific Ocean weakened relative to January–March 2020, with the cool signal now extending eastward just north of the Equator. In contrast, warmer than normal conditions, > 10x105 J/m3, appear in the tropical South Pacific Ocean. Much higher, > 30x105 J/m3, than normal OHC conditions continue to exist in the Gulf Stream/North Atlantic Current, the Northwestern Pacific Ocean, the Southwestern Atlantic Ocean, and the Tasman Sea. Cool conditions, < -10x105 J/m3, still appear in the eastern South Indian Ocean and along the south coast of Australia. Much cooler than normal conditions, < -30x105 J/m3, appear along the Antarctic Circumpolar Current in most of the Indian and Pacific Ocean sectors of the Southern Ocean. The cooler than normal conditions that exist in the subpolar North Atlantic Ocean south of Greenland and Iceland extend now northeastward into the Norwegian Sea.
References
- Adler, R., G. Gu, M. Sapiano, J. Wang, G. Huffman 2017. Global Precipitation: Means, Variations and Trends During the Satellite Era (1979-2014). Surveys in Geophysics 38: 679-699, doi:10.1007/s10712-017-9416-4
- Adler, R., M. Sapiano, G. Huffman, J. Wang, G. Gu, D. Bolvin, L. Chiu, U. Schneider, A. Becker, E. Nelkin, P. Xie, R. Ferraro, D. Shin, 2018. The Global Precipitation Climatology Project (GPCP) Monthly Analysis (New Version 2.3) and a Review of 2017 Global Precipitation. Atmosphere. 9(4), 138; doi:10.3390/atmos9040138
- Gu, G., and R. Adler, 2022. Observed Variability and Trends in Global Precipitation During 1979-2020. Climate Dynamics, doi:10.1007/s00382-022-06567-9
- Huang, B., Peter W. Thorne, et. al, 2017: Extended Reconstructed Sea Surface Temperature version 5 (ERSSTv5), Upgrades, validations, and intercomparisons. J. Climate, doi: 10.1175/JCLI-D-16-0836.1
- Huang, B., V.F. Banzon, E. Freeman, J. Lawrimore, W. Liu, T.C. Peterson, T.M. Smith, P.W. Thorne, S.D. Woodruff, and H-M. Zhang, 2016: Extended Reconstructed Sea Surface Temperature Version 4 (ERSST.v4). Part I: Upgrades and Intercomparisons. J. Climate, 28, 911-930, doi:10.1175/JCLI-D-14-00006.1.
- Menne, M. J., C. N. Williams, B.E. Gleason, J. J Rennie, and J. H. Lawrimore, 2018: The Global Historical Climatology Network Monthly Temperature Dataset, Version 4. J. Climate, in press. https://doi.org/10.1175/JCLI-D-18-0094.1.
- Peterson, T.C. and R.S. Vose, 1997: An Overview of the Global Historical Climatology Network Database. Bull. Amer. Meteorol. Soc., 78, 2837-2849.
- Vose, R., B. Huang, X. Yin, D. Arndt, D. R. Easterling, J. H. Lawrimore, M. J. Menne, A. Sanchez-Lugo, and H. M. Zhang, 2021. Implementing Full Spatial Coverage in NOAA's Global Temperature Analysis. Geophysical Research Letters 48(10), e2020GL090873; doi:10.1029/2020gl090873.