
Introduction
Temperature anomalies and percentiles are shown on the gridded maps below. The anomaly map on the left is a product of a merged land surface temperature (Global Historical Climatology Network, GHCN) and sea surface temperature (ERSST version 5) anomaly analysis. Temperature anomalies for land and ocean are analyzed separately and then merged to form the global analysis. For more information, please visit NCEI's Global Surface Temperature Anomalies page. The percentile map on the right provides additional information by placing the temperature anomaly observed for a specific place and time period into historical perspective, showing how the most current month, season or year compares with the past.
Please note: During the construction of this report, three stations in Egypt were determined to have submitted data from April. This will be corrected in future runs of the global temperature records. However, this is not expected to have significant impact on the May 2020 global temperature value.
Temperature
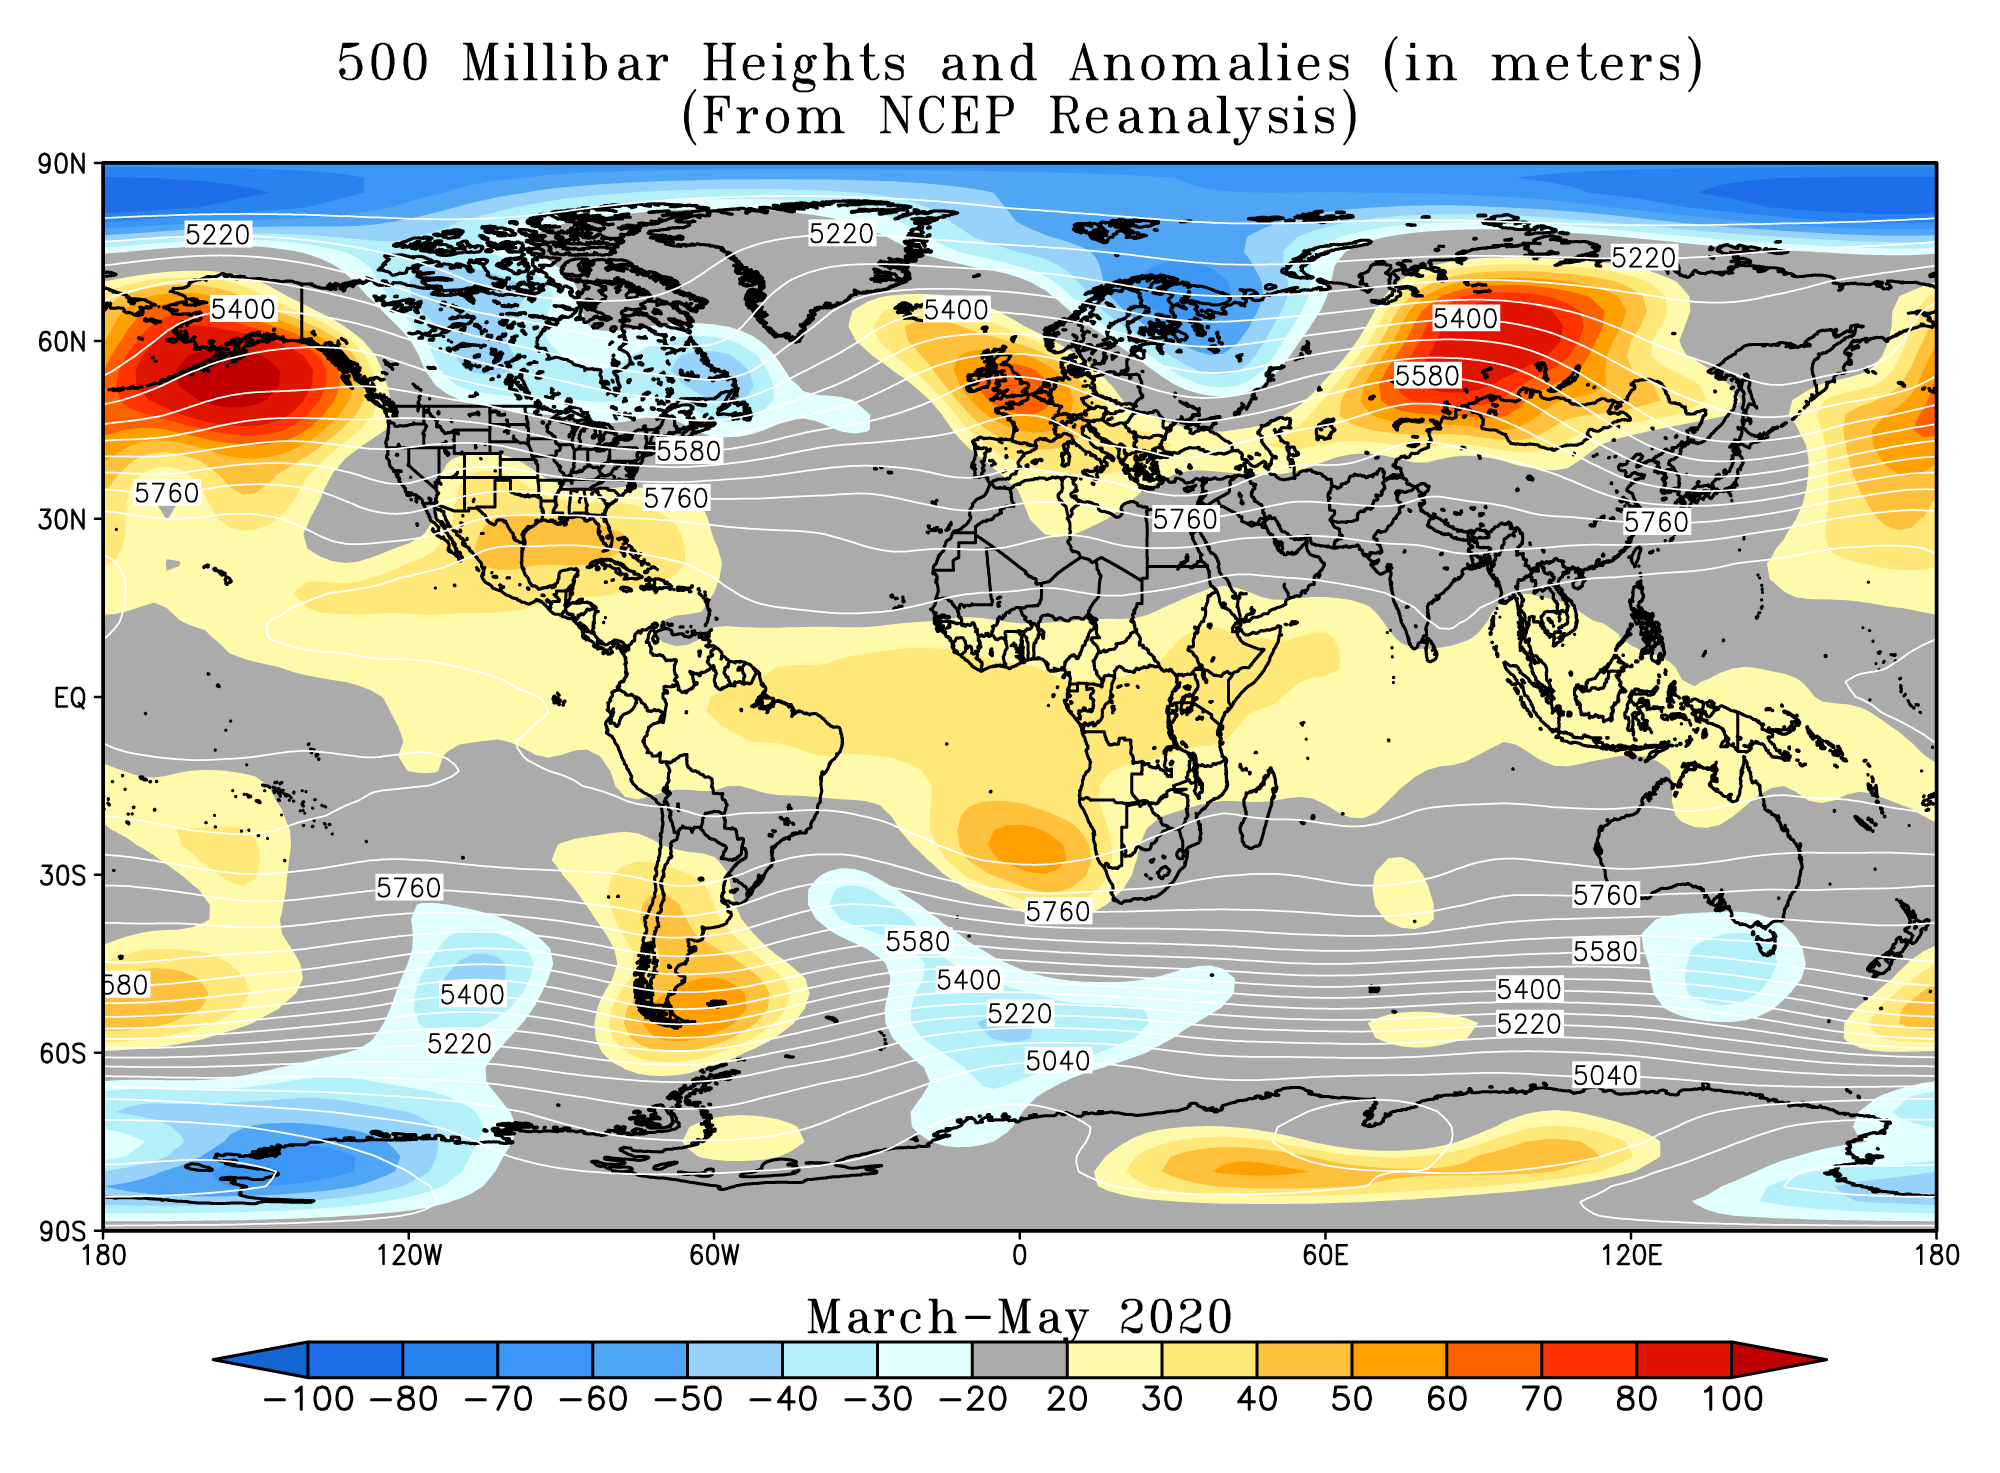
In the atmosphere, 500-millibar height pressure anomalies correlate well with temperatures at the Earth's surface. The average position of the upper-level ridges of high pressure and troughs of low pressure—depicted by positive and negative 500-millibar height anomalies on the May 2020 and March–May 2020 maps—is generally reflected by areas of positive and negative temperature anomalies at the surface, respectively.
Monthly Temperature: May 2020
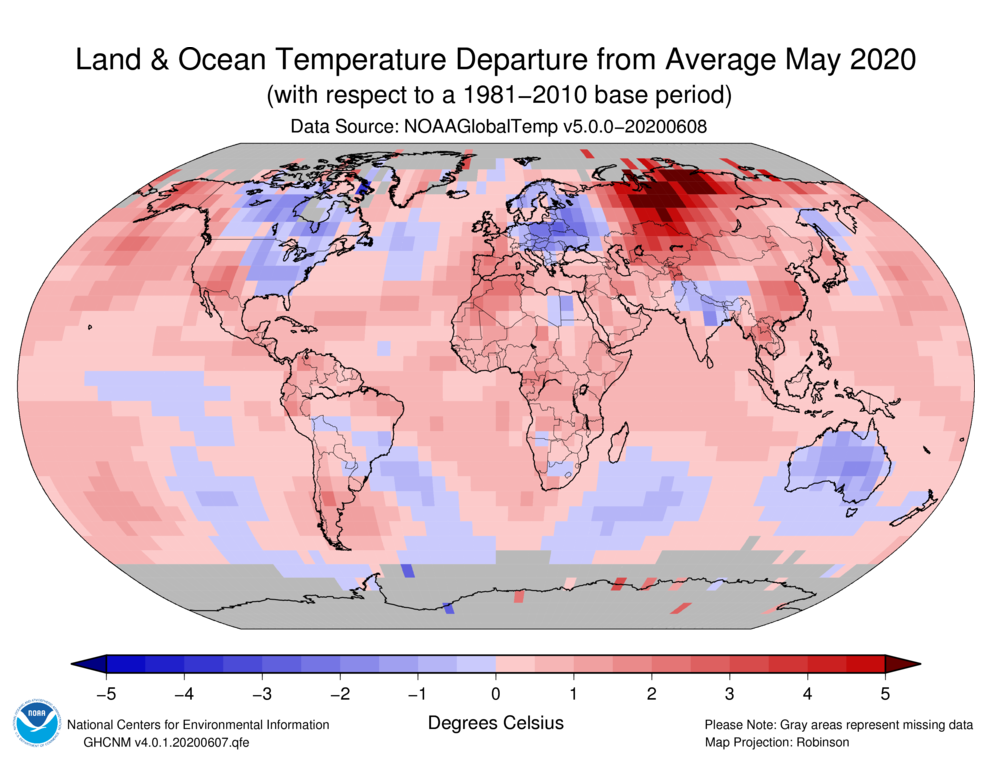
The global land and ocean surface temperature for May 2020 tied with 2016 as the highest in the 141-year record at 0.95°C (1.71°F) above the 20th century average of 14.8°C (58.6°F). The 10 warmest Mays have all occurred since 1998; however, the 2014–2020 Mays are the seven warmest in the 141-year record. May 2020 also marked the 44th consecutive May and the 425th consecutive month with temperatures, at least nominally, above the 20th century average.

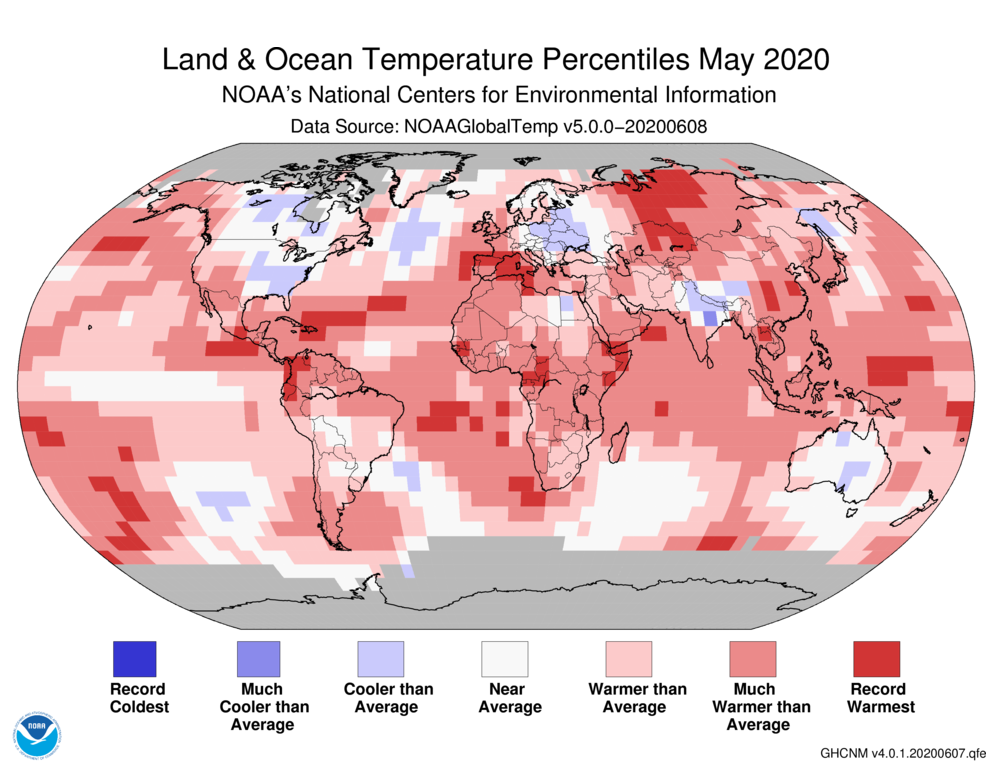
Warmer-than-average temperatures were present across much of the globe during May 2020, with the most notable temperatures departures across parts of northern and southeastern Asia, northern Africa, Alaska, the southwest contiguous U.S., and the northern Pacific Ocean, where temperatures were 1.5°C (2.7°F) above the 1981–2010 average or higher. Record-warm May temperatures were observed across parts of the Atlantic, Pacific, and Indian oceans, as well as parts of western Europe, Central and Southern America, Africa, and Asia. Overall, May 2020 had 7.55% of the world's land and ocean surfaces with a record high May temperature. This was the third highest percentage for May record warm temperatures since records began in 1951, behind 2016 (11.85%) and 2010 (8.42%). Meanwhile, the most notable cool temperatures were observed across much of Canada, the eastern contiguous U.S., eastern Europe, and Australia, with temperatures at least 1.0°C (1.8°F) below average. However, no land or ocean areas had record-cold May temperatures.
The global land-only surface temperature for May 2020 was also the highest on record at 1.39°C (2.50°F) above the 20th century average of 11.1°C (52.0°F). This was 0.04°C (0.07°F) above the previous record set in 2012. The 10 highest May global land-only surface temperature departures have occurred since 2010.
The May 2020 global ocean-only surface temperature was near-record warm at 0.79°C (1.42°F) above average. This value was only 0.01°C (0.02°F) shy of tying the record warm May of 2016.
The Northern Hemisphere global land and ocean surface temperature departure was also the highest on record at 1.19°C (2.14°F) above average. This value exceeded the previous record set in 2015 and, again in 2016, by 0.10°C (0.18°F). Meanwhile, the Southern Hemisphere global land and ocean surface temperature departure of +0.72°C (+1.30°F) tied with 1998 as the fifth highest May temperature on record.
Regionally, Asia had its warmest May on record at 2.09°C (3.76°F) above average, surpassing the now second-warmest May set in 2012 by 0.25°C (0.45°F). May 2020 also marked the first time Asia's May temperature departure from average surpassed 2.0°C (3.6°F). May 2020 was Asia's 27th consecutive May with temperatures, at least nominally, above the 1919–2000 average. Meanwhile, Africa, South America, and the Caribbean region had a May temperature that ranked among the six warmest Mays on record.
While western Europe had unusually warm May temperatures, much of northern and eastern Europe had cooler-than-average conditions. Averaged as a whole, Europe's May temperature was 0.45°C (0.81°F) above the 1910–2000 average, resulting in the coolest May since 2004. Oceania had a near-average May temperature and the coolest May since 2012.
| May | Anomaly | Rank (out of 141 years) | Records | ||||
|---|---|---|---|---|---|---|---|
| °C | °F | Year(s) | °C | °F | |||
| Global | |||||||
| Land | +1.39 ± 0.11 | +2.50 ± 0.20 | Warmest | 1st | 2020 | +1.39 | +2.50 |
| Coolest | 141st | 1917 | -0.92 | -1.66 | |||
| Ocean | +0.79 ± 0.14 | +1.42 ± 0.25 | Warmest | 2nd | 2016 | +0.80 | +1.44 |
| Coolest | 140th | 1911 | -0.55 | -0.99 | |||
| Land and Ocean | +0.95 ± 0.13 | +1.71 ± 0.23 | Warmest | 1st | 2016, 2020 | +0.95 | +1.71 |
| Coolest | 141st | 1917 | -0.57 | -1.03 | |||
| Ties: 2016 | |||||||
| Northern Hemisphere | |||||||
| Land | +1.60 ± 0.11 | +2.88 ± 0.20 | Warmest | 1st | 2020 | +1.60 | +2.88 |
| Coolest | 141st | 1907 | -0.99 | -1.78 | |||
| Ocean | +0.94 ± 0.14 | +1.69 ± 0.25 | Warmest | 1st | 2020 | +0.94 | +1.69 |
| Coolest | 141st | 1911 | -0.55 | -0.99 | |||
| Land and Ocean | +1.19 ± 0.13 | +2.14 ± 0.23 | Warmest | 1st | 2020 | +1.19 | +2.14 |
| Coolest | 141st | 1917 | -0.64 | -1.15 | |||
| Southern Hemisphere | |||||||
| Land | +0.87 ± 0.13 | +1.57 ± 0.23 | Warmest | 14th | 2019 | +1.35 | +2.43 |
| Coolest | 128th | 1917 | -1.26 | -2.27 | |||
| Ocean | +0.69 ± 0.15 | +1.24 ± 0.27 | Warmest | 2nd | 2016 | +0.73 | +1.31 |
| Coolest | 140th | 1911 | -0.53 | -0.95 | |||
| Land and Ocean | +0.72 ± 0.15 | +1.30 ± 0.27 | Warmest | 5th | 2016 | +0.80 | +1.44 |
| Coolest | 137th | 1911 | -0.54 | -0.97 | |||
| Ties: 1998 | |||||||
| Arctic | |||||||
| Land and Ocean | +2.06 ± 0.09 | +3.71 ± 0.16 | Warmest | 4th | 2016 | +2.15 | +3.87 |
| Coolest | 138th | 1890 | -1.94 | -3.49 | |||


The most current data can be accessed via the Global Surface Temperature Anomalies page.
Select national information is highlighted below. Please note that different countries report anomalies with respect to different base periods. The information provided here is based directly upon these data:
- May 2020 was France's fifth warmest May in the nation's 121-year record, with a national temperature 1.5°C (2.7°F) above the 1981–2010 average.
- A historic heat wave affected southeastern Europe from May 16–19, resulting in numerous maximum temperature records above 40.0°C (104.0°F). According to Meteo France, Italy set a new Italian May maximum temperature record on May 16 when temperatures soared to 39.9°C (103.8°F) at Palermo Punta Raisi airport in Sicily. This new value surpassed the previous record of 39.4°C (102.9°F) set on May 23, 2006 in Trapani. Greece also set a new May national temperature record when Plora's maximum temperature rose to 41.8°C (107.2°F) on May 16. On May 17, the district of Tire, Turkey had a maximum temperature of 44.5°C (112.1°F), exceeding the previous national May maximum temperature record of 42.8°C (109.0°F) set on May 30, 2019 in Kirikhan by 1.7°C (3.1°F).
- Spain's national May 2020 temperature of 19.3°C (66.7°F) was 2.7°C (4.9°F) above the 1981–2020 average. This was Spain's warmest May since national records began in 1965, surpassing the now second warmest May set in 2015 by 0.2°C (0.4°F). Spain's eight warmest Mays have all occurred in the 21st century.
- Hong Kong had its fifth warmest May on record, with a mean temperature of 1.8°C (3.2°F) above average.
- Cooler-than-average conditions engulfed much of Australia during May 2020. Overall, the national mean temperature for May 2020 was 0.62°C (1.12°F) below the 1961–1990 average—Australia's coolest May since 2011. This was also the first time since October 2016 that Australia had a cooler-than-average national temperature.
Seasonal Temperature: March–May 2020
The March–May period is defined as the Northern Hemisphere's meteorological spring and the Southern Hemisphere's meteorological autumn.
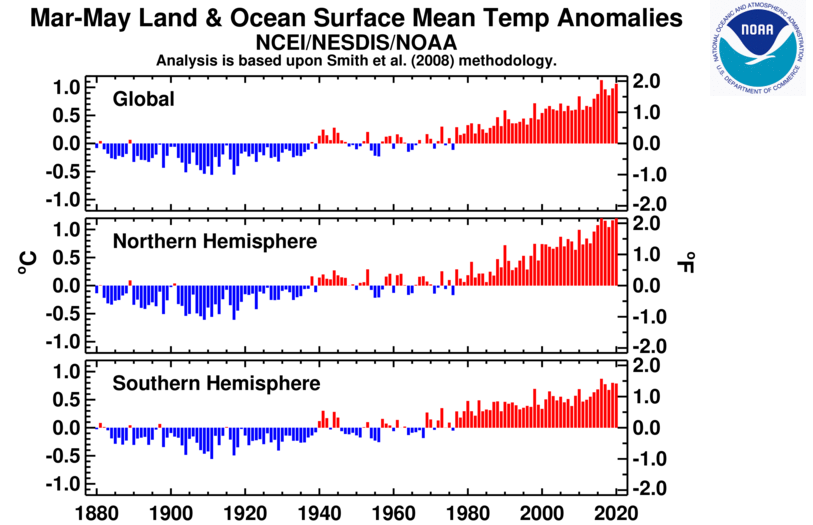
The seasonal global land and ocean surface temperature for March–May 2020 was the second highest in the 141-year record, with a temperature departure from average of 1.06°C (1.91°F) above the 20th century average of 13.7°C (56.7°F). Only March–May of 2016 had a higher temperature departure at 1.13°C (2.03°F). This was also the tenth highest three-month temperature departure for any three-month period on record. The top 10 three-month periods have occurred since 2015.

The Northern Hemisphere had its second warmest spring on record at 1.33°C (2.39°F) above average. This was only 0.05°C (0.09°F) shy of tying the record warm spring of 2016. Meanwhile, the Southern Hemisphere had its third warmest autumn on record at +0.79°C (+1.42°F), behind autumns of 2016 (warmest) and 2019 (second warmest).
The global land-only and global ocean-only surface temperatures were also the second warmest for March–May on record, behind March–May 2016.


During the three-month period of March–May 2020, much of the global land and ocean surfaces had warmer-than-average temperatures. Much of northern Asia had temperatures that were 3.0°C (5.4°F) above average or higher, while the most notable cooler-than-average conditions were present across much of Canada. Record-warm March–May temperatures were observed over Central and South America, the Gulf of Mexico, Europe, Africa, northern Asia, as well as across parts of the Atlantic, Indian, and Pacific oceans.
Regionally, South America, Asia, and the Gulf of Mexico had their warmest March–May period since regional records began in 1910, while Europe and Africa had a top 10 warm March–May period. Although North America had an above-average March–May temperature, it was the smallest spring temperature departure for North America since 2014.
Select national information is highlighted below. Please note that different countries report anomalies with respect to different base periods. The information provided here is based directly upon these data:
- France had its second warmest spring on record, with a national average temperature 1.7°C (3.1°F) above average. Only spring of 2011 was warmer (+2.0°C / +3.6°F).
- With a mean spring temperature of 23.7°C (&4.7°F), Hong Kong had its fifth warmest spring on record.
- Argentina had its fourth warmest autumn since national records began in 1961 at 1.0°C (1.8°F) above average.
- Australia had a warmer-than-average autumn, with a national temperature at 0.56°C (1.11°F) above the 1961–1990 average and the 21st warmest autumn in the nation's 111-year record. Western Australia had its ninth warmest autumn on record. Meanwhile, New South Wales, Victoria, and Tasmania had a cooler-than-average autumn.
| March–May | Anomaly | Rank (out of 141 years) | Records | ||||
|---|---|---|---|---|---|---|---|
| °C | °F | Year(s) | °C | °F | |||
| Global | |||||||
| Land | +1.74 ± 0.12 | +3.13 ± 0.22 | Warmest | 2nd | 2016 | +1.95 | +3.51 |
| Coolest | 140th | 1898 | -0.87 | -1.57 | |||
| Ocean | +0.81 ± 0.15 | +1.46 ± 0.27 | Warmest | 2nd | 2016 | +0.82 | +1.48 |
| Coolest | 140th | 1911 | -0.52 | -0.94 | |||
| Land and Ocean | +1.06 ± 0.14 | +1.91 ± 0.25 | Warmest | 2nd | 2016 | +1.13 | +2.03 |
| Coolest | 140th | 1911 | -0.56 | -1.01 | |||
| Northern Hemisphere | |||||||
| Land | +1.96 ± 0.15 | +3.53 ± 0.27 | Warmest | 2nd | 2016 | +2.18 | +3.92 |
| Coolest | 140th | 1898 | -0.94 | -1.69 | |||
| Ocean | +0.95 ± 0.14 | +1.71 ± 0.25 | Warmest | 1st | 2020 | +0.95 | +1.71 |
| Coolest | 141st | 1904, 1911, 1917 | -0.49 | -0.88 | |||
| Land and Ocean | +1.33 ± 0.14 | +2.39 ± 0.25 | Warmest | 2nd | 2016 | +1.38 | +2.48 |
| Coolest | 140th | 1909, 1917 | -0.61 | -1.10 | |||
| Southern Hemisphere | |||||||
| Land | +1.17 ± 0.14 | +2.11 ± 0.25 | Warmest | 4th | 2019 | +1.39 | +2.50 |
| Coolest | 138th | 1917 | -0.98 | -1.76 | |||
| Ocean | +0.72 ± 0.16 | +1.30 ± 0.29 | Warmest | 2nd | 2016 | +0.78 | +1.40 |
| Coolest | 140th | 1911 | -0.53 | -0.95 | |||
| Land and Ocean | +0.79 ± 0.15 | +1.42 ± 0.27 | Warmest | 3rd | 2016 | +0.87 | +1.57 |
| Coolest | 139th | 1911 | -0.55 | -0.99 | |||
| Arctic | |||||||
| Land and Ocean | +2.62 ± 0.22 | +4.72 ± 0.40 | Warmest | 3rd | 2019 | +2.91 | +5.24 |
| Coolest | 139th | 1902 | -2.42 | -4.36 | |||

Year-to-date Temperature: January–May 2020
The year-to-date global land and ocean surface temperature was the second highest in the 141-year record at 1.10°C (1.98°F) above the 20th century average of 13.1°C (55.5°F). This was only 0.06°C (0.11°F) less than the record set in 2016. According to NCEI's annual ranking outlook, the year 2020 is very likely (>99.9%) to rank among the five warmest years on record.

The period was characterized by warmer-than-average temperatures across much of the global land and ocean surfaces. The most notable warm temperature departures were present across much of the northern half of Asia, where temperatures were at least 3.5°C (6.3°F) above average. Record warm January–May temperatures were present across parts of the Atlantic, southern Pacific, and southern Indian oceans, as well as Europe, southern North America, South America, Africa, and across a large portion of northern Asia. Unusually warm conditions have been present across northern Asia since the start of the year. Meanwhile, the most notable cool temperature departures of -1.5°C (-2.7°F) or cooler were present across much of Alaska. No land or ocean area had a record cold January–May temperature.

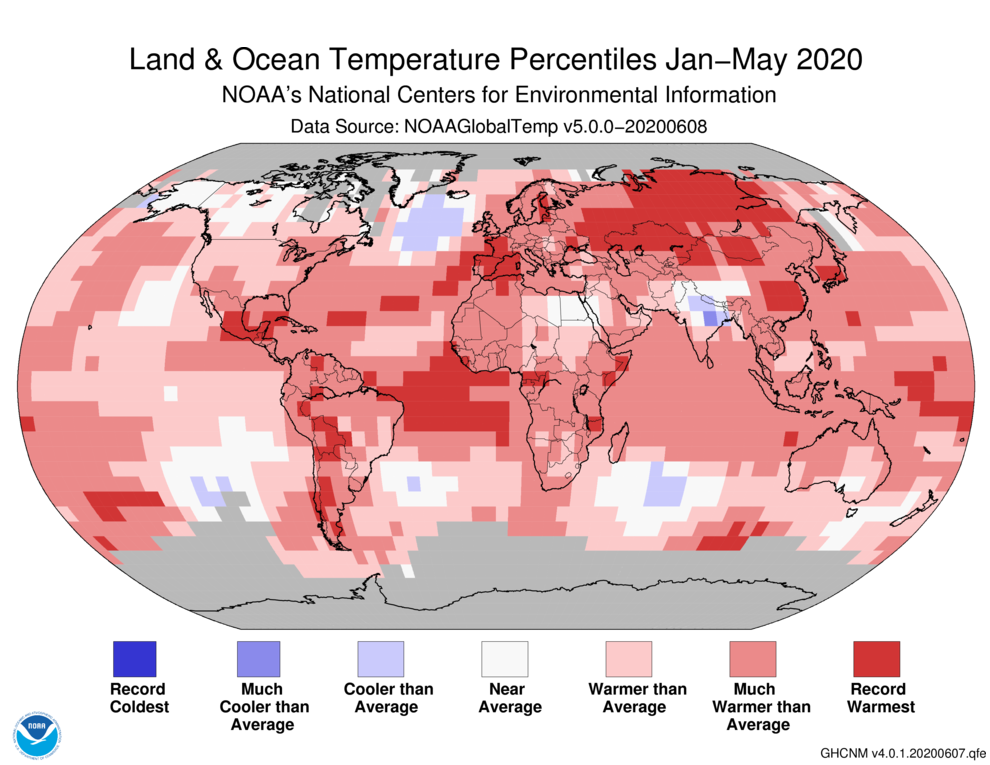
Regionally, South America, Europe, Asia, and the Gulf of Mexico had their warmest January–May period on record. Asia's year-to-date temperature departure of +3.12°C (+5.62°F) surpassed the now second warmest January–May period by 0.72°C (1.30°F). This was also the first time Asia's January–May temperature surpassed 3.0°C (5.4°F). The Caribbean region and Africa had a January–May temperature that ranked among the three highest such period on record.
| January–May | Anomaly | Rank (out of 141 years) | Records | ||||
|---|---|---|---|---|---|---|---|
| °C | °F | Year(s) | °C | °F | |||
| Global | |||||||
| Land | +1.92 ± 0.15 | +3.46 ± 0.27 | Warmest | 2nd | 2016 | +2.00 | +3.60 |
| Coolest | 140th | 1893 | -0.97 | -1.75 | |||
| Ocean | +0.80 ± 0.16 | +1.44 ± 0.29 | Warmest | 2nd | 2016 | +0.84 | +1.51 |
| Coolest | 140th | 1904, 1911 | -0.50 | -0.90 | |||
| Land and Ocean | +1.10 ± 0.16 | +1.98 ± 0.29 | Warmest | 2nd | 2016 | +1.16 | +2.09 |
| Coolest | 140th | 1911 | -0.56 | -1.01 | |||
| Northern Hemisphere | |||||||
| Land | +2.21 ± 0.18 | +3.98 ± 0.32 | Warmest | 2nd | 2016 | +2.24 | +4.03 |
| Coolest | 140th | 1893 | -1.14 | -2.05 | |||
| Ocean | +0.93 ± 0.16 | +1.67 ± 0.29 | Warmest | 2nd | 2016 | +0.94 | +1.69 |
| Coolest | 140th | 1904 | -0.52 | -0.94 | |||
| Land and Ocean | +1.41 ± 0.17 | +2.54 ± 0.31 | Warmest | 2nd | 2016 | +1.44 | +2.59 |
| Coolest | 140th | 1893 | -0.71 | -1.28 | |||
| Southern Hemisphere | |||||||
| Land | +1.19 ± 0.14 | +2.14 ± 0.25 | Warmest | 3rd | 2016, 2019 | +1.39 | +2.50 |
| Coolest | 139th | 1917 | -0.91 | -1.64 | |||
| Ocean | +0.71 ± 0.17 | +1.28 ± 0.31 | Warmest | 2nd | 2016 | +0.78 | +1.40 |
| Coolest | 140th | 1911 | -0.52 | -0.94 | |||
| Land and Ocean | +0.79 ± 0.16 | +1.42 ± 0.29 | Warmest | 2nd | 2016 | +0.87 | +1.57 |
| Coolest | 140th | 1911, 1917 | -0.53 | -0.95 | |||
| Ties: 2019 | |||||||
| Arctic | |||||||
| Land and Ocean | +2.55 ± 0.35 | +4.59 ± 0.63 | Warmest | 3rd | 2016 | +3.10 | +5.58 |
| Coolest | 139th | 1966 | -1.86 | -3.35 | |||


Precipitation
May Precipitation

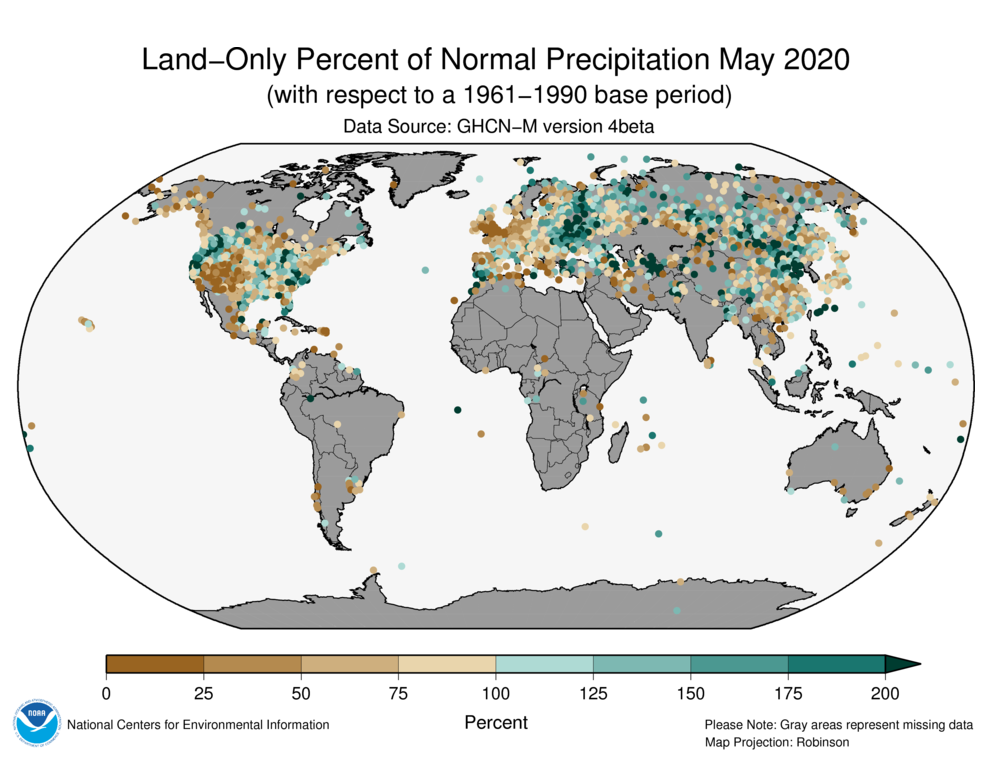
The maps shown above represent precipitation percent of normal (left, using a base period of 1961–1990) and precipitation percentiles (right, using the period of record) based on the GHCN dataset of land surface stations. As is typical, precipitation anomalies during May 2020 varied significantly around the world. May 2020 precipitation was generally drier than normal across parts of the southwest, northern, and northeastern contiguous U.S., southern Alaska, northern and central Europe, and across Asia. Wetter-than-average conditions were present across parts of the northwestern and southeastern contiguous U.S., eastern Europe, and across central and eastern Asia.
Select national information is highlighted below. (Please note that different countries report anomalies with respect to different base periods. The information provided here is based directly upon these data):
- Drier-than-average conditions were present across the United Kingdom during May, with a national average of 47% below average. Regionally, England had its driest May, while Wales had its second driest since records began in 1862.
- Spain's precipitation varied greatly, with above-average precipitation across parts western and southwestern Spain. national average precipitation was 89% of normal May precipitation. Some locations, such as parts of Andalucía, Aragón, Cataluña, and Ceuta, had more than double their May average precipitation. Meanwhile, precipitation deficits were observed across parts of northwestern and southeastern Spain.
- While most of northern Australia had above-average precipitation, the southern half of Australia had near to below-average precipitation. As a whole, Australia had drier-than-average May conditions at 31% below average. Most regions had a May precipitation total that was below average, with South Australia having the largest precipitation deficit at 66% below average. Western Australia had near average conditions.
March–May Precipitation

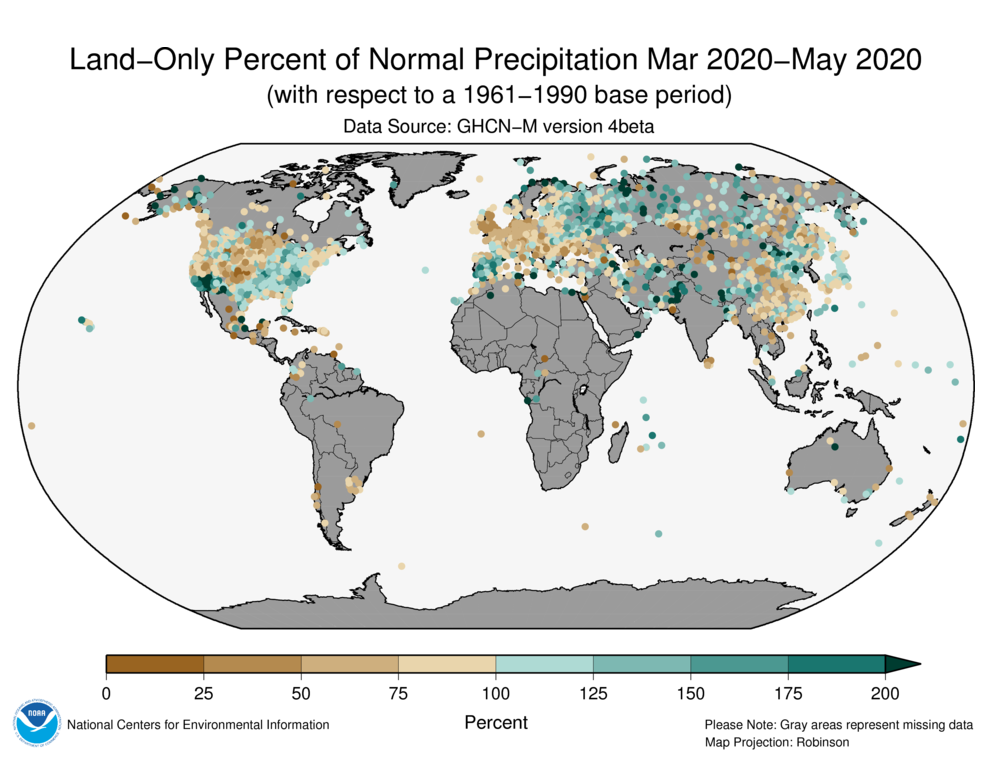
March–May precipitation was generally drier than normal across parts of the western half of the contiguous U.S., southern Mexico, central and northern Europe, and across parts of eastern Asia. Wetter-than-normal conditions were notable across the southwestern and eastern half of the contiguous U.S., Alaska, western and southern parts of Europe, western, central and southwestern Asia.
Select national information is highlighted below. (Please note that different countries report anomalies with respect to different base periods. The information provided here is based directly upon these data):
- The United Kingdom had its fifth driest spring on record.
- March–May 2020 was Argentina's ninth driest autumn in the nation's 60-year record.
- Australia had 19% below-average precipitation during autumn 2020. Regionally, Queensland, South Australia, Western Australia, and the Northern Territory had below-average conditions, while New South Wales, Victoria, and Tasmania had above-average autumn precipitation. According to Australia's Bureau of Meteorology, several locations across Victoria, Tasmania, and New South Wales had their wettest autumn on record or their wettest in at least 20 years.
Global Precipitation Climatology Project (GPCP)
The following analysis is based upon the Global Precipitation Climatology Project (GPCP) Interim Climate Data Record. It is provided courtesy of the GPCP Principal Investigator team at the University of Maryland.
The Global Precipitation Climatology Project (GPCP) monthly data set is a long-term (1979-present) analysis (Adler et al., 2018) using a combination of satellite and gauge information. An interim GPCP analysis completed within ~10 days of the end of the month allows its use in climate monitoring.


For May the ITCZ across the Pacific and Atlantic Oceans is a narrow line of maximum rainfall already well north of the Equator (May Precipitation Totals Map), in fact further north than usual as seen by the east-west pattern of positive/negative anomalies (May Precipitation Anomalies Map) in both oceans. SST's over the central Pacific along the Equator currently show a negative anomaly associated with an ocean Kelvin wave and that ocean influence may be related to the positioning of the ITCZ there. Over South America and Africa the ITCZ is broader, with specific maxima.
Over the Indian Ocean there are significant rain features both north and south of the Equator, and the tropical cyclone season has already started on the north side of the Equator with strong Cyclone Amphan sweeping up the Bay of Bengal in the middle of the month and causing flooding in northeast India and Bangladesh. Another small feature of interest in the May precipitation maps (middle and bottom panels) is along the southeast coast of the Arabian Peninsula, where a small unnamed tropical cyclone slowly moved onto the coast in Oman and caused serious flooding, before edging southwestward into Yemen. Indochina and the South China Sea show a rainfall deficit for May and Australia is almost completely dry as the Asian monsoon has already moved north and begun to impact the Asian continent. In the sub-tropics the rain feature associated with the springtime East Asian Maiu Front can be seen south of Japan and extending back across Taiwan and into southern China where some flooding occurred in Guangzhou and Macao along the southern coast.
In North America the May precipitation map shows the general climatological pattern of wetter eastern half and drier western part of the continent. The May 2020 anomaly map is correlated positively with that climatology in general with much of the southwest U.S. drier than normal and with significant drought. Florida and parts of the southeast were relatively wet in May due to the early passage of Tropical Storm Arthur. Even the eastern Pacific got an early start on the tropical cyclone season with Tropical Storm Amanda producing flooding on the Pacific side of Central America in El Salvador at the end of May, before crossing over the land and becoming Tropical Storm Cristobal in Yucatan in early June and eventually crossing the Gulf of Mexico and coming ashore in the Louisiana and Mississippi. Even before that, during May, the SSTs in the Gulf were above the mean and the rainfall anomaly was also, perhaps foreshadowing an active tropical cyclone season there and in the open Atlantic to the east.
Precipitation deficits dominate over western to central Europe and Scandinavia and are related to continuing drought conditions there. Further east very warm temperatures for May in central Asia, even up to the Arctic Ocean coast, are associated with a varied pattern of precipitation anomalies.
Figure 2 shows the three-month (March–May 2020) mean and anomaly precipitation fields. The mean precipitation map shows most typical climatological-type features for the Northern Hemisphere spring season and does not as clearly show smaller-scale features evident in the monthly maps, such as oceanic tracks of tropical cyclones. Instead the three-month compilation shows the larger climatological features, but the anomaly map shows important variations. For example, along the ITCZ in both the Pacific and Atlantic Oceans, the core of the ITCZ has a positive anomaly and the surrounding, drier sub-tropics have a negative anomaly, signaling the wet areas there are wetter than normal and dry areas are drier than normal. Even the double ITCZ is weakly evident in the eastern Pacific.
The Indian Ocean shows mostly positive anomalies and extends that feature into eastern Africa, at least north of 10°S, associated with floods and the locust plague over the last several months in that region. The precipitation deficit over western Europe relates to the drought conditions there. Over North America general relative wetness in the East and dryness in the West continues and matches estimated drought distributions, as expected. Australia and Indochina are also noted for dry conditions for the three-month period.
Background discussion of long-term means, variations and trends of global precipitation can be found in Adler et al. (2017).
References
- Menne, M. J., C. N. Williams, B.E. Gleason, J. J Rennie, and J. H. Lawrimore, 2018: The Global Historical Climatology Network Monthly Temperature Dataset, Version 4. J. Climate, in press. https://doi.org/10.1175/JCLI-D-18-0094.1.
- Huang, B., Peter W. Thorne, et. al, 2017: Extended Reconstructed Sea Surface Temperature version 5 (ERSSTv5), Upgrades, validations, and intercomparisons. J. Climate, doi: 10.1175/JCLI-D-16-0836.1
- Peterson, T.C. and R.S. Vose, 1997: An Overview of the Global Historical Climatology Network Database. Bull. Amer. Meteorol. Soc., 78, 2837-2849.
- Huang, B., V.F. Banzon, E. Freeman, J. Lawrimore, W. Liu, T.C. Peterson, T.M. Smith, P.W. Thorne, S.D. Woodruff, and H-M. Zhang, 2016: Extended Reconstructed Sea Surface Temperature Version 4 (ERSST.v4). Part I: Upgrades and Intercomparisons. J. Climate, 28, 911-930.
- Adler, R., G. Gu, M. Sapiano, J. Wang, G. Huffman 2017. Global Precipitation: Means, Variations and Trends During the Satellite Era (1979-2014). Surveys in Geophysics 38: 679-699, doi:10.1007/s10712-017-9416-4
- Adler, R., M. Sapiano, G. Huffman, J. Wang, G. Gu, D. Bolvin, L. Chiu, U. Schneider, A. Becker, E. Nelkin, P. Xie, R. Ferraro, D. Shin, 2018. The Global Precipitation Climatology Project (GPCP) Monthly Analysis (New Version 2.3) and a Review of 2017 Global Precipitation. Atmosphere. 9(4), 138; doi:10.3390/atmos9040138