
Introduction
Temperature anomalies and percentiles are shown on the gridded maps below. The anomaly map on the left is a product of a merged land surface temperature (Global Historical Climatology Network, GHCN) and sea surface temperature (ERSST version 5) anomaly analysis. Temperature anomalies for land and ocean are analyzed separately and then merged to form the global analysis. For more information, please visit NCEI's Global Surface Temperature Anomalies page. The percentile map on the right provides additional information by placing the temperature anomaly observed for a specific place and time period into historical perspective, showing how the most current month, season or year compares with the past.
Temperature
In the atmosphere, 500-millibar height pressure anomalies correlate well with temperatures at the Earth's surface. The average position of the upper-level ridges of high pressure and troughs of low pressure—depicted by positive and negative 500-millibar height anomalies on the January 2020 map—is generally reflected by areas of positive and negative temperature anomalies at the surface, respectively.
Monthly Temperature: January 2020
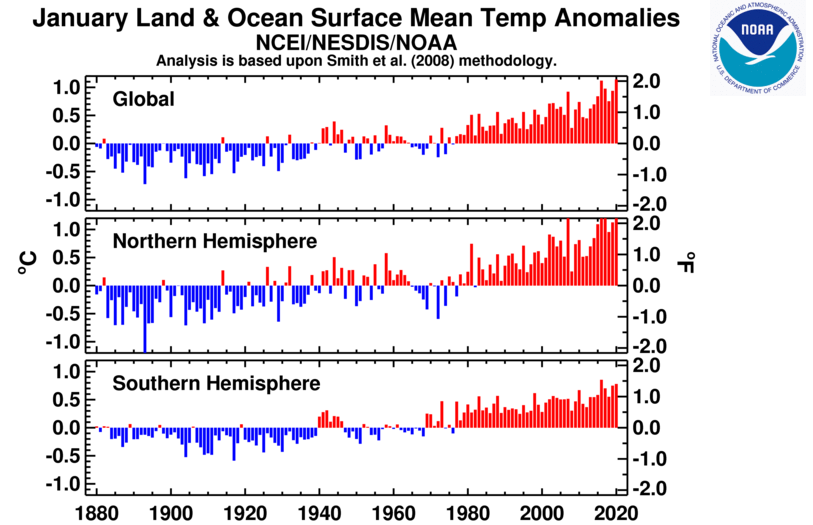
The global land and ocean surface temperature for January 2020 was the highest in the 141-year record, with a temperature departure from average of 1.14°C (2.05°F) above the 20th century average. This value was only 0.02°C (0.04°F) higher than the now second highest January temperature departure from average set in 2016. The four warmest Januaries on record have occurred since 2016, while the 10 warmest Januaries have occurred since 2002. The only Januaries with a global land and ocean surface temperature departure from average above 1.0°C (1.8°F) occurred in 2016 and 2020.

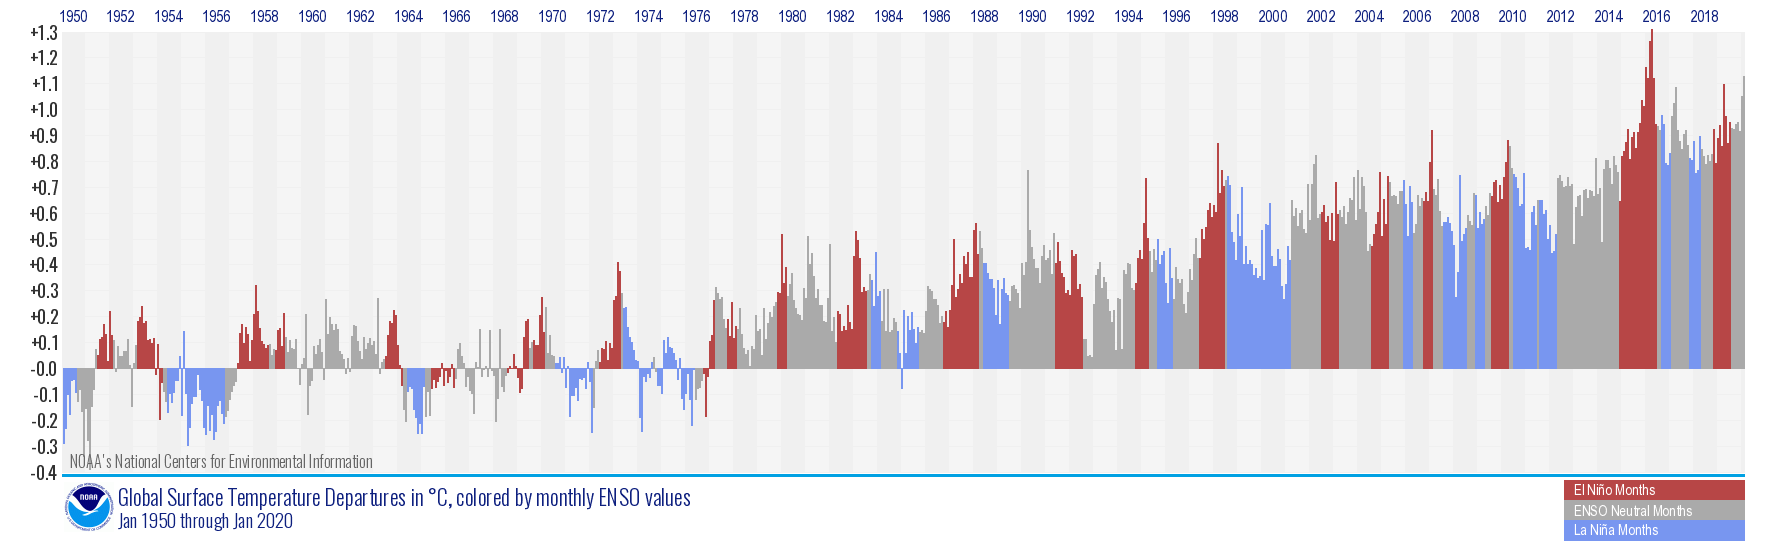
The January global land and surface temperature departure was also the fourth highest monthly temperature departure in the 1681-month record. Only March 2016, February 2016, and December 2015 had a greater temperature departure; all months that had a strong warm phase El Niño / Southern Oscillation (ENSO) present in the tropical Pacific Ocean. ENSO, which is a periodic fluctuation in sea surface temperature and air pressure of the overlying atmosphere across the tropical Pacific Ocean, can influence global temperatures. A warm phase ENSO, also known as El Niño, tends to have a warming influence on global temperatures, while the cold phase (La Niña) tends to have a cooling influence.
However, the January 2020 global land and ocean surface temperature departure from average was the highest for any month during ENSO neutral conditions, meaning El Niño or La Niña was not present in the tropical Pacific Ocean. March 2017 (+1.08°C / +1.94°F), December 2019 (+1.05°C / +1.89°F), and February 2017 (+1.02°C / +1.84°F) were the other months where the global land and ocean surface temperature departure from average was above 1.0°C (1.8°F) during ENSO neutral conditions in the tropical Pacific Ocean.
The global land-only surface temperature departure of +2.12°C (+3.82°F) was the highest on record for January, besting the previous record set in 2007 by 0.15°C (0.27°F). This was also the third highest global land surface temperature for any month in the 1,681-montlhy record. The months of March 2016 (+2.53°C / +4.55°F) and February 2016 (+2.43°C / +4.37°F) were warmer. The January 2020 global ocean surface temperature was the second highest for January on record with a temperature departure from average of +0.78°C (+1.40°F). Only January 2016 was warmer at +0.91°C (+1.64°F).
The Northern Hemisphere land and ocean surface temperature departure from average was also highest on record at 1.50°C (2.70°F) above average. This value exceeded the previous record of 1.38°C (2.48°F) set in January 2016 by 0.12°C (0.22°F). The Southern Hemisphere had its second warmest January on record, with a land and ocean surface temperature departure from average of 0.78°C (1.40°F) above average. Only January 2016 was warmer.
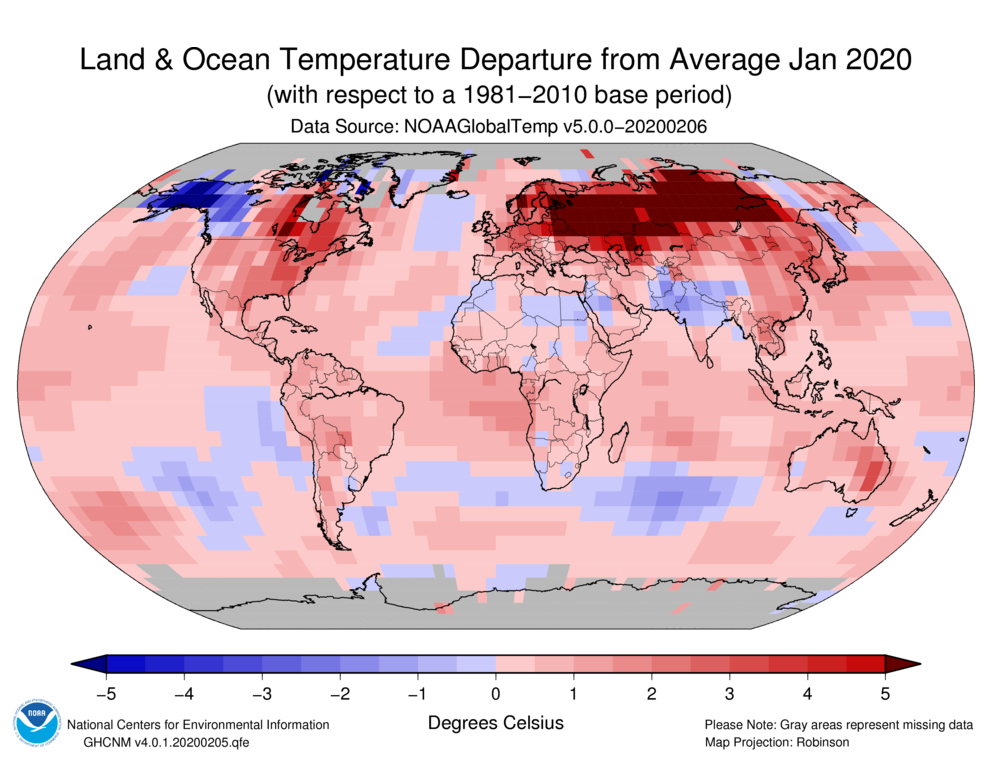

The first month of the year was characterized by warmer-than-average temperatures across much of the world's land and ocean surface. The most notable warm temperatures were observed across much of Russia and parts of Scandinavia and eastern Canada, where temperatures were at least 5.0°C (9.0°F) above average. Other notable warm temperatures were observed across parts of the eastern contiguous U.S., central Europe, and eastern Australia, where temperatures were more than 2.0°C (3.6°F) above average. Meanwhile, the most notable cool temperature departures from average were observed across much of Alaska and parts of western Canada, where temperatures were at least 4.0°C (7.2°F) below average. Record warm January surface temperatures present across parts of Scandinavia, Asia, the Indian Ocean, the central and western Pacific Ocean, the Atlantic Ocean, and Central and South America. However, no land or ocean areas had record-cold January temperatures.
Select national information is highlighted below. Please note that different countries report anomalies with respect to different base periods. The information provided here is based directly upon these data:
- North America had its 16th warmest January in the 111-year record.
- The contiguous U.S. had its fifth warmest January in its 126-year record with a temperature 3.0°C (5.4°F) above the 20th century average. The Hawaiian region had its second warmest January on record, while Alaska had its coldest January since 2012 and tied with 1970 as the 13th coldest January on record.
- The Caribbean region had its second warmest January on record, with a temperature 1.01°C (1.82°F) above average. Only January 2016 was warmer.
- January 2020 was South America's second warmest January on record at +1.37°C (+2.47°F). Only January 2016 was warmer.
- Europe also had its second warmest January on record with a temperature departure from average of +3.16°C (+5.69°F), trailing behind the record warm January of 2007 (+3.32°C / +5.98°F). This was also Europe's seventh highest monthly temperature departure from average in the 1,321 monthly record. February 1990 had the highest monthly temperature departure from average at +4.11°C (+7.40°F).
- The United Kingdom had its sixth warmest January since national records began in 1884 with a national average temperature of 5.6°C (42.1°F), which is 2.0°C (3.6°F) above the 1981–2010 average. Of note, England and Scotland had their fifth warmest January on record.
- Norway had its second warmest January since national records began in 1900. The national January 2020 temperature of 6.1°C (43.0°F) was only 0.1°C (0.2°F) cooler than the record warm January of 1989. Several stations across eastern Norway had their warmest January on record.
- Finland had its second warmest January on record, falling behind January 1925. According to the Finnish Meteorological Institute, up to 60% of Finland had its warmest January on record with many locations observing temperatures that were 7°–8°C (12.6°–14.4°F) above the 1981–2010 average.
- Denmark had its warmest January since national records began in 1874, with a national average temperature of 5.5°C (41.9°F) and 3.9°C (7.02°F) above the 1991–2020 average. The previous record of 5.0°C (41.0°F) was set in 2007.
- France had its 10th warmest January since national records began in 1900. The January 2020 national average temperature of 7.1°C (44.8°F) was 2.2°C (4.0°F) above average.
- The January 2020 temperature for Asia was 3.46°C (6.23°F) above average and the second highest for January on record. This is 0.11°C (0.20°F) less than the record warm January of 2007. This was also the sixth highest monthly temperature departure from average for Asia in the 1,321 monthly record. Asia's March 2008 temperature departure of +4.27°C (7.69°F) was the highest on record.
- Hong Kong had its highest maximum and mean temperatures on record at 2.6°C (4.7°F) and 2.3°C (4.1°F) above average, respectively. Hong Kong's minimum temperature for January 2020 was also 2.3°C (4.1°F) above average and the second highest on record.
- Oceania had its third warmest January on record at +1.61°C (+2.90°F), trailing behind 2019 (+2.51°C / +4.52°F) and 2013 (+1.79°C / +3.22°F).
- Australia's mean temperature during January 2020 was 1.45°C (2.61°F) above the 1961–1990 average, resulting in the third warmest January in the 111-year record. The national minimum and maximum temperatures were also 1.45°C (2.61°F) above average and were the third and ninth highest, respectively, on record. Regionally, Queensland had its second highest mean temperature on record at 2.38°C (4.28°F) above average. New South Wales mean temperature was the fifth highest for January on record.
| January | Anomaly | Rank (out of 141 years) | Records | ||||
|---|---|---|---|---|---|---|---|
| °C | °F | Year(s) | °C | °F | |||
| Global | |||||||
| Land | +2.12 ± 0.21 | +3.82 ± 0.38 | Warmest | 1st | 2020 | +2.12 | +3.82 |
| Coolest | 141st | 1893 | -1.97 | -3.55 | |||
| Ocean | +0.78 ± 0.15 | +1.40 ± 0.27 | Warmest | 2nd | 2016 | +0.91 | +1.64 |
| Coolest | 140th | 1917 | -0.53 | -0.95 | |||
| Land and Ocean | +1.14 ± 0.17 | +2.05 ± 0.31 | Warmest | 1st | 2020 | +1.14 | +2.05 |
| Coolest | 141st | 1893 | -0.72 | -1.30 | |||
| Northern Hemisphere | |||||||
| Land | +2.44 ± 0.29 | +4.39 ± 0.52 | Warmest | 1st | 2007, 2020 | +2.44 | +4.39 |
| Coolest | 141st | 1893 | -2.51 | -4.52 | |||
| Ties: 2007 | |||||||
| Ocean | +0.91 ± 0.14 | +1.64 ± 0.25 | Warmest | 2nd | 2016 | +1.10 | +1.98 |
| Coolest | 140th | 1904 | -0.53 | -0.95 | |||
| Land and Ocean | +1.50 ± 0.20 | +2.70 ± 0.36 | Warmest | 1st | 2020 | +1.50 | +2.70 |
| Coolest | 141st | 1893 | -1.32 | -2.38 | |||
| Southern Hemisphere | |||||||
| Land | +1.29 ± 0.14 | +2.32 ± 0.25 | Warmest | 2nd | 2019 | +1.44 | +2.59 |
| Coolest | 140th | 1918 | -0.91 | -1.64 | |||
| Ocean | +0.69 ± 0.15 | +1.24 ± 0.27 | Warmest | 2nd | 2016 | +0.78 | +1.40 |
| Coolest | 140th | 1917 | -0.58 | -1.04 | |||
| Land and Ocean | +0.78 ± 0.15 | +1.40 ± 0.27 | Warmest | 2nd | 2016 | +0.86 | +1.55 |
| Coolest | 140th | 1917 | -0.59 | -1.06 | |||
| Arctic | |||||||
| Land and Ocean | +2.44 ± 0.74 | +4.39 ± 1.33 | Warmest | 11th | 1981 | +4.33 | +7.79 |
| Coolest | 131st | 1900 | -3.07 | -5.53 | |||

The most current data can be accessed via the Global Surface Temperature Anomalies page.
Precipitation
January Precipitation


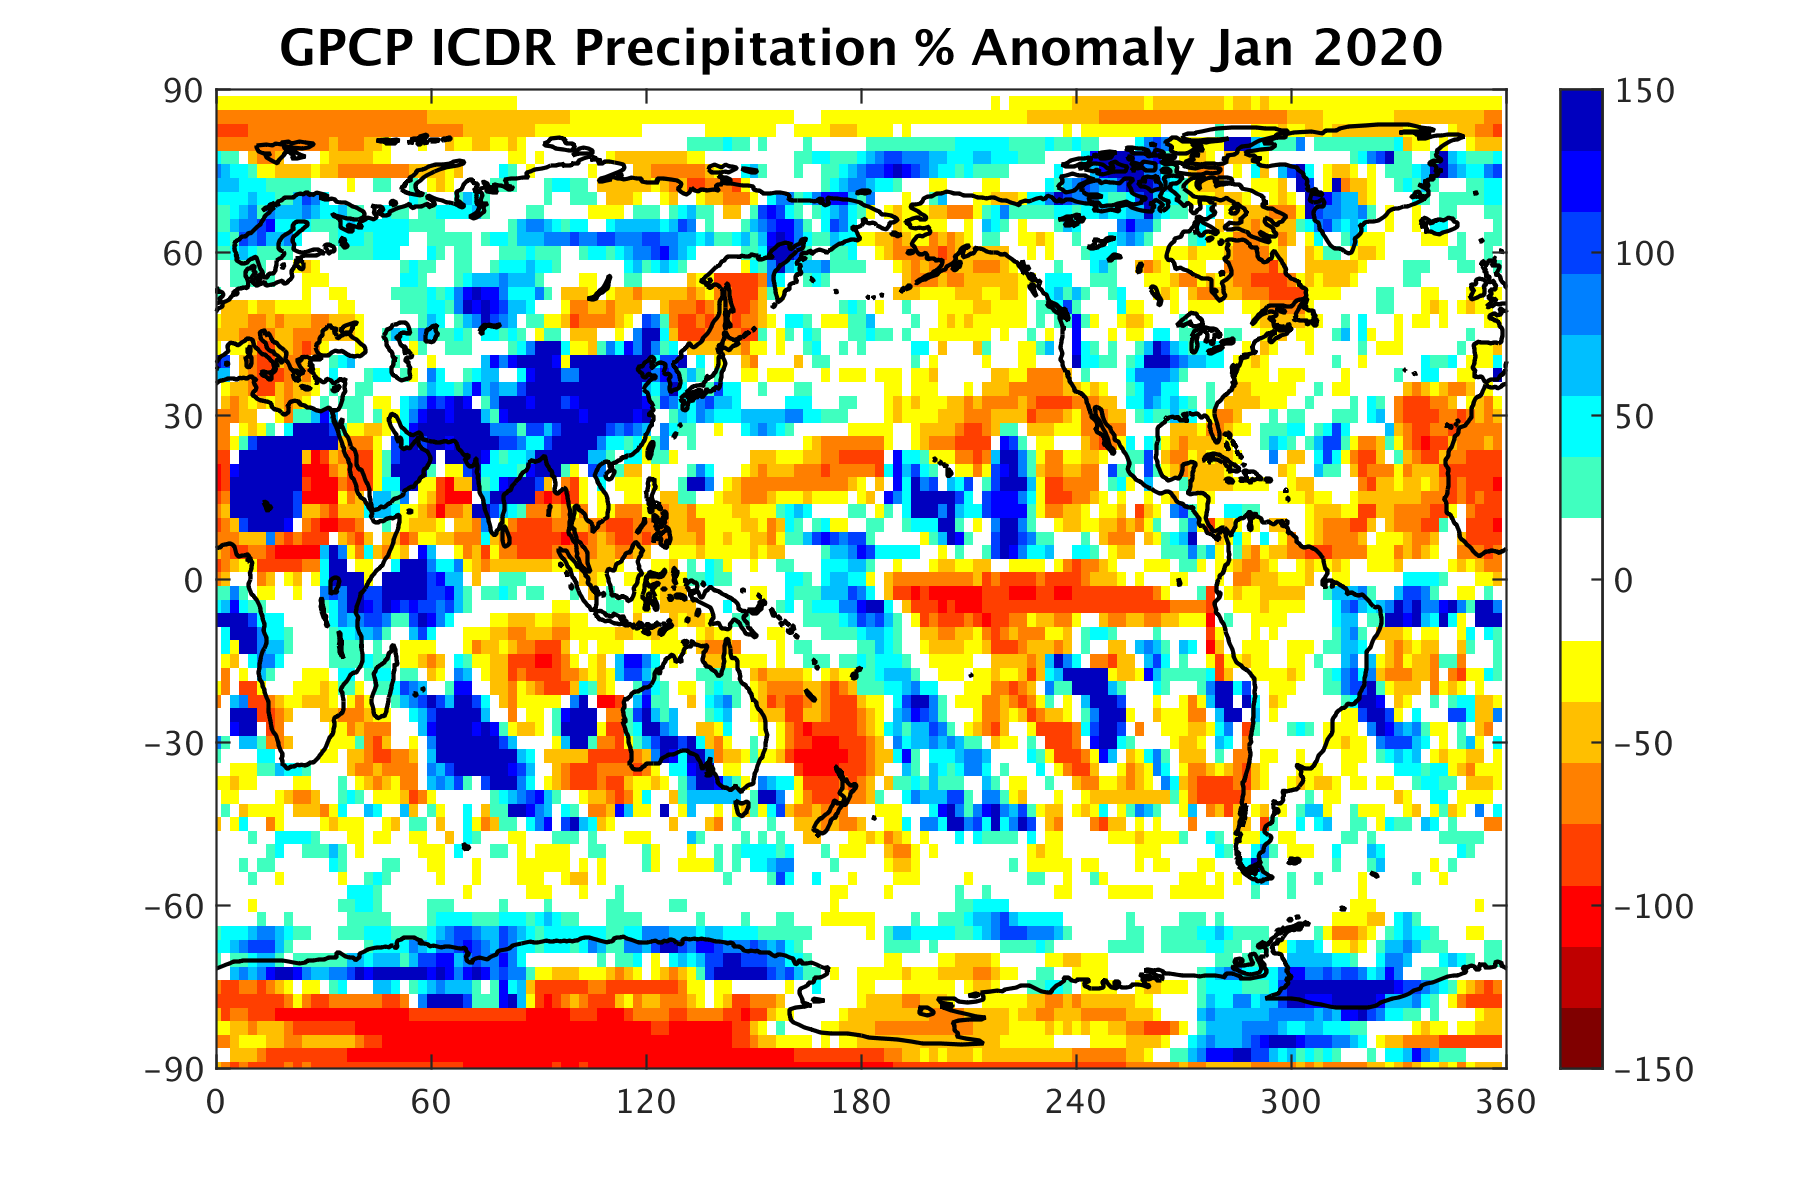
The maps shown above represent precipitation percent of normal (left, using a base period of 1961–1990) and precipitation percentiles (right, using the period of record) based on the GHCN dataset of land surface stations. As is typical, precipitation anomalies during January 2020 varied significantly around the world. January precipitation was generally drier than normal across parts of Alaska, the southwestern contiguous U.S., central and western Europe, New Zealand, and parts of eastern Asia. Wetter-than-normal conditions were notable across the northwestern and eastern half of the contiguous U.S., eastern Brazil, northern Europe, western and central Russia, and parts of southern and eastern Asia.
Select national information is highlighted below. (Please note that different countries report anomalies with respect to different base periods. The information provided here is based directly upon these data):
- Alaska had its driest January since 2006 and the 14th driest on record.
- While much of the western half of Spain had below-average precipitation, much of the east had above-average conditions. Overall, Spain's January 2020 was near average at 11% above average precipitation for January. Several locations set new high January precipitation records. Of note, the Barcelona airport had a total of 174 mm of precipitation for the month, the highest on record for January.
- Australia, as a whole, had 12% above average January precipitation. The region with the highest precipitation was Western Australia, receiving 59% above average precipitation for January. However, New South Wales and South Australia had 36% and 25% below average precipitation, respectively.
Global Precipitation Climatology Project (GPCP)
The following analysis is based upon the Global Precipitation Climatology Project (GPCP) Interim Climate Data Record. It is provided courtesy of the GPCP Principal Investigator team at the University of Maryland.

- Australia receives some rainfall to help fight wildfires and even experiences floods in the north
- West Indian Ocean area and into Madagascar and eastern Africa still have positive rainfall anomalies and flooding over the land areas
- South America rainfall anomaly pattern reverses from December
- Northern Hemisphere mid-latitude storm tracks over both ocean and land related to variations in precipitation
As the sun reaches its furthest south position the major rain features across continents have followed and have peaks south of the Equator (see Africa and South America) as seen in the GPCP global monthly analysis for January 2020. Over tropical oceans, this is also the case in the Indian and Atlantic Oceans, while across the Pacific the ITCZ hovers near the Equator, with a strong extension to the southeast into the Southern Hemisphere as part of the SPCZ. The Asian monsoon produced rainfall across the Maritime Continent and into parts of Australia, giving some relief to the wildfire-ravaged continent.
Positive rainfall anomalies are still prevalent in the western Indian Ocean, as they have been over the last few months, again associated with positive SST anomalies, even though the IOD index has gone neutral due to warming in the eastern portion of that ocean. These rainfall excesses over the ocean extend inland into eastern Africa and are tending to continue the flooding evident over the last few months. A positive SST anomaly off the southwest coast of Africa is also associated with excess rainfall over that ocean area and extending onto the coastal countries.
Australia, which has suffered an extended drought and one of the worst wildfire seasons in their history has gotten some relief in January as the monsoon has arrived. The anomaly field even shows some significant positive features in the north that were associated with floods, mostly in areas of low population density. In the southeast portion of the country, where wildfires were concentrated, the limited rainfall was helpful, but insufficient to end the fires. To the north over the Maritime Continent the monsoon is active, but still shows below normal rainfall for the month. Further to the southeast, New Zealand continues their drought accompanied by a negative precipitation anomaly over the islands and surrounding waters.
Over South America a rainfall maximum is evident in eastern Brazil, with a rainfall deficit over the western part of the continent. This alignment is a flip-flop from last month. The rainfall feature in the east was accompanied by floods and landslides in that area.
In the Northern Hemisphere the typical mid-winter rainfall maxima extend to the northeast from the Asian and North American continents, with the anomaly field showing variations from the mean pattern. For the Pacific feature positive precipitation above the mean is evident at the western edge of the feature in China, extending to the east over the water through southern Japan. Further to the east this midlatitude storm track has mostly negative anomalies. Over North America the U.S. Pacific northwest had a positive precipitation (snow) anomaly, with excess precipitation also in the Midwest and part of the Gulf coast. The Gulf of Mexico itself had a rain deficit.
In the North Atlantic there is a rainfall deficit just east of the U.S., but further to the northeast the anomaly pattern indicates a northward shift to the Atlantic storm track and related precipitation feature with a peak at the coast of Norway. Southwest Europe has a precipitation deficit this month, while to the northeast, over Scandinavia and east over northern Europe there is a moderate precipitation excess.
References
- Menne, M. J., C. N. Williams, B.E. Gleason, J. J Rennie, and J. H. Lawrimore, 2018: The Global Historical Climatology Network Monthly Temperature Dataset, Version 4. J. Climate, in press. https://doi.org/10.1175/JCLI-D-18-0094.1.
- Huang, B., Peter W. Thorne, et. al, 2017: Extended Reconstructed Sea Surface Temperature version 5 (ERSSTv5), Upgrades, validations, and intercomparisons. J. Climate, doi: 10.1175/JCLI-D-16-0836.1
- Peterson, T.C. and R.S. Vose, 1997: An Overview of the Global Historical Climatology Network Database. Bull. Amer. Meteorol. Soc., 78, 2837-2849.
- Huang, B., V.F. Banzon, E. Freeman, J. Lawrimore, W. Liu, T.C. Peterson, T.M. Smith, P.W. Thorne, S.D. Woodruff, and H-M. Zhang, 2016: Extended Reconstructed Sea Surface Temperature Version 4 (ERSST.v4). Part I: Upgrades and Intercomparisons. J. Climate, 28, 911-930.
- Adler, R., G. Gu, M. Sapiano, J. Wang, G. Huffman 2017. Global Precipitation: Means, Variations and Trends During the Satellite Era (1979-2014). Surveys in Geophysics 38: 679-699, doi:10.1007/s10712-017-9416-4
- Adler, R., M. Sapiano, G. Huffman, J. Wang, G. Gu, D. Bolvin, L. Chiu, U. Schneider, A. Becker, E. Nelkin, P. Xie, R. Ferraro, D. Shin, 2018. The Global Precipitation Climatology Project (GPCP) Monthly Analysis (New Version 2.3) and a Review of 2017 Global Precipitation. Atmosphere. 9(4), 138; doi:10.3390/atmos9040138