
Introduction
PLEASE NOTE: With the May 2019 global report and data release, the National Centers for Environmental Information transitioned to an improved version of NOAA's Global Temperature data set (NOAAGlobalTemp version 5), which includes the updated versions of its global land (GHCNm version 4.0.1) and ocean (ERSST version 5) data sets. Please note that anomalies and ranks reflect the historical record according to these updated versions. Historical months and years may differ from what was reported in previous years. Please visit our Commonly Asked Questions for additional information.
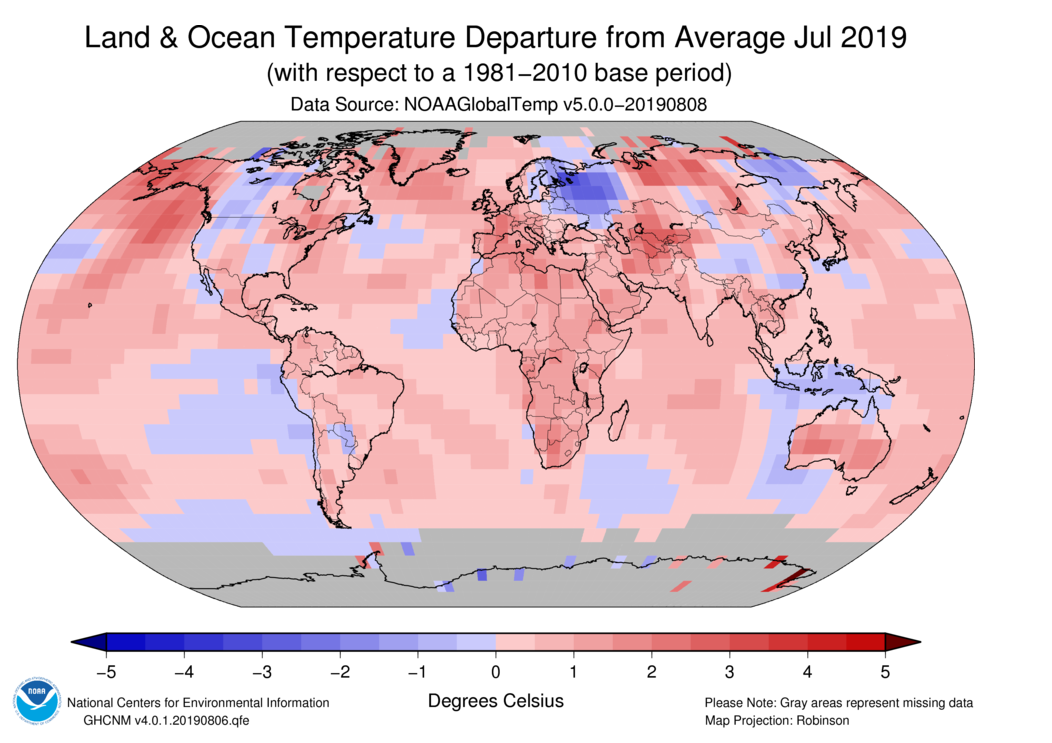
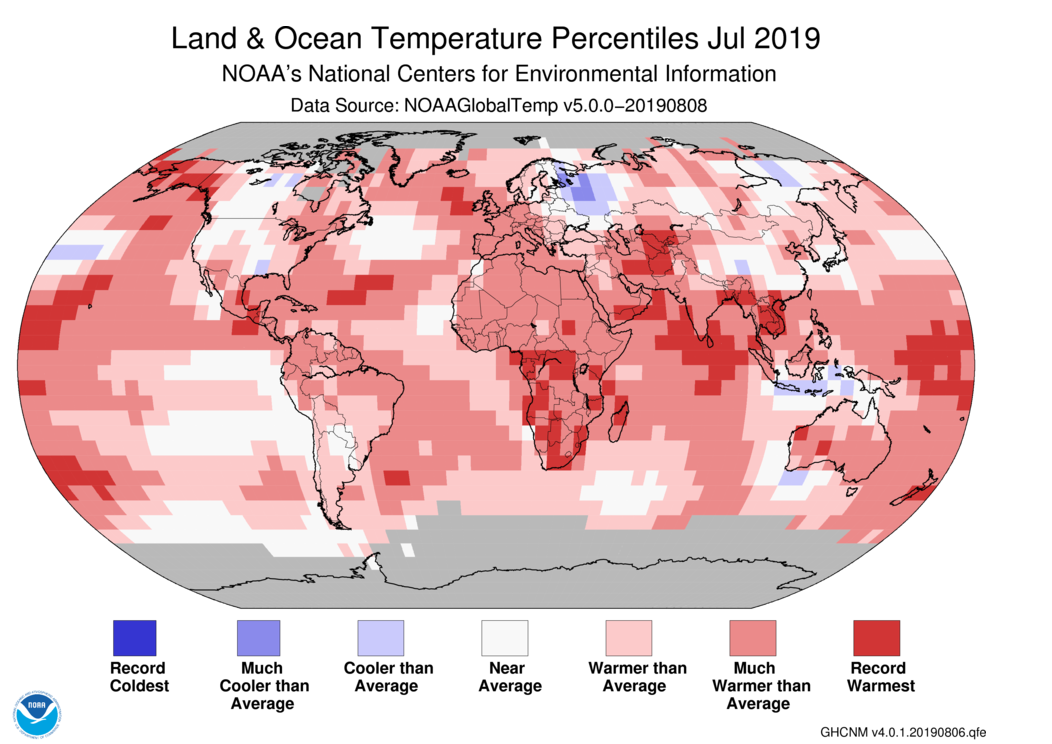
Temperature anomalies and percentiles are shown on the gridded maps below. The anomaly map on the left is a product of a merged land surface temperature (Global Historical Climatology Network, GHCN) and sea surface temperature (ERSST version 5) anomaly analysis. Temperature anomalies for land and ocean are analyzed separately and then merged to form the global analysis. For more information, please visit NCEI's Global Surface Temperature Anomalies page. The percentile map on the right provides additional information by placing the temperature anomaly observed for a specific place and time period into historical perspective, showing how the most current month, season or year compares with the past.
Temperature
In the atmosphere, 500-millibar height pressure anomalies correlate well with temperatures at the Earth's surface. The average position of the upper-level ridges of high pressure and troughs of low pressure—depicted by positive and negative 500-millibar height anomalies on the July 2019 map—is generally reflected by areas of positive and negative temperature anomalies at the surface, respectively.
July Temperature
The July 2019 global land and ocean surface temperature departure from average was the highest for July since global records began in 1880 at 0.95°C (1.71°F) above the 20th century average. This value surpassed the previous record set in 2016 by 0.03°C (0.05°F). Nine of the 10 warmest Julys have occurred since 2005, with the last five years (2015–2019) ranking among the five warmest Julys on record. July 1998 is the only July from the 20th century to be among the 10 warmest Julys on record. July 2019 marked the 43rd consecutive July and the 415th consecutive month with temperatures, at least nominally, above the 20th century average. Julys 2016, 2017, and 2019 are the only Julys that had a temperature departure from average at or above 0.90°C (1.62°F). Climatologically, July is the globe's warmest month of the year. With July 2019 the warmest July on record, at least nominally, this resulted in the warmest month on record for the globe.

The global land-only surface temperature for July 2019 was 1.23°C (2.21°F) above the 20th century average and was the second highest July temperature in the 140-year record. July 2017 holds the record for the highest July global land-only temperature at +1.24°C (+2.23°F). The July 2019 globally averaged ocean-only temperature departure from average of +0.84°C (+1.51°F) was the highest on record for July, surpassing the previous record set in 2016 (+0.82°C / +1.48°F). Compared to all months, this value tied with September 2015 as the sixth highest monthly global ocean temperature departure from average among all months (1675 months) on record. The 10 highest global ocean monthly temperature departures have all occurred since September 2015.
| Rank 1 = Warmest Period of Record: 1880–2019 |
Month + Year | Anomaly °C | Anomaly °F |
|---|---|---|---|
| 1 | January 2016 | 0.91 | 1.64 |
| 2 (tied) | October 2015 | 0.87 | 1.57 |
| 2 (tied) | November 2015 | 0.87 | 1.57 |
| 4 | March 2016 | 0.86 | 1.55 |
| 5 | December 2015 | 0.85 | 1.53 |
| 6 (tied) | September 2015 | 0.84 | 1.51 |
| 6 (tied) | July 2019 | 0.84 | 1.51 |
| 8 | February 2016 | 0.83 | 1.49 |
| 9 (tied) | July 2016 | 0.82 | 1.48 |
| 9 (tied) | August 2016 | 0.82 | 1.48 |
The month was characterized by warmer-than-average temperatures across much of the global land and ocean surfaces. Record-temperatures were present across parts of North America, southern Asia, the southern half of Africa, the northern Indian Ocean, the Atlantic Ocean, as well as across the western and northern parts of the Pacific Ocean. Near- to cooler-than-average conditions were limited to parts of western Canada, parts of the contiguous U.S., western and eastern parts of Russia, China, Indonesia, as well as parts of the North Atlantic Ocean, southern Indian Ocean, and parts of the southeastern and northwestern Pacific Ocean. No record cold temperatures were evident in the analysis for July 2019.
Regionally, North America, Africa, Asia, Oceania, the Caribbean region, the Hawaiian region, and the Gulf of Mexico had a July temperature that ranked among the ten warmest Julys on record. Of note, Africa had its warmest July on record at 1.65°C (2.97°F) above average. This value exceeds the previous record set in 2015 by 0.18°C (0.32°F).
| July | Anomaly | Rank (out of 140 years) | Records | ||||
|---|---|---|---|---|---|---|---|
| °C | °F | Year(s) | °C | °F | |||
| Global | |||||||
| Land | +1.23 ± 0.25 | +2.21 ± 0.45 | Warmest | 2nd | 2017 | +1.24 | +2.23 |
| Coolest | 139th | 1884 | -0.70 | -1.26 | |||
| Ocean | +0.84 ± 0.14 | +1.51 ± 0.25 | Warmest | 1st | 2019 | +0.84 | +1.51 |
| Coolest | 140th | 1909 | -0.50 | -0.90 | |||
| Land and Ocean | +0.95 ± 0.17 | +1.71 ± 0.31 | Warmest | 1st | 2019 | +0.95 | +1.71 |
| Coolest | 140th | 1904 | -0.49 | -0.88 | |||
| Northern Hemisphere | |||||||
| Land | +1.19 ± 0.22 | +2.14 ± 0.40 | Warmest | 5th | 2012 | +1.34 | +2.41 |
| Coolest | 136th | 1884 | -0.73 | -1.31 | |||
| Ocean | +1.07 ± 0.13 | +1.93 ± 0.23 | Warmest | 1st | 2019 | +1.07 | +1.93 |
| Coolest | 140th | 1904 | -0.58 | -1.04 | |||
| Land and Ocean | +1.11 ± 0.19 | +2.00 ± 0.34 | Warmest | 1st | 2019 | +1.11 | +2.00 |
| Coolest | 140th | 1904 | -0.60 | -1.08 | |||
| Southern Hemisphere | |||||||
| Land | +1.34 ± 0.12 | +2.41 ± 0.22 | Warmest | 2nd | 2017 | +1.39 | +2.50 |
| Coolest | 139th | 1891 | -0.93 | -1.67 | |||
| Ocean | +0.68 ± 0.16 | +1.22 ± 0.29 | Warmest | 2nd | 2016 | +0.70 | +1.26 |
| Coolest | 139th | 1909 | -0.44 | -0.79 | |||
| Land and Ocean | +0.78 ± 0.16 | +1.40 ± 0.29 | Warmest | 1st | 2019 | +0.78 | +1.40 |
| Coolest | 140th | 1911 | -0.45 | -0.81 | |||
| Arctic | |||||||
| Land and Ocean | +1.36 ± 0.09 | +2.45 ± 0.16 | Warmest | 5th | 2016 | +1.83 | +3.29 |
| Coolest | 136th | 1912 | -1.22 | -2.20 | |||


The most current data can be accessed via the Global Surface Temperature Anomalies page.
Select national information is highlighted below. Please note that different countries report anomalies with respect to different base periods. The information provided here is based directly upon these data:
- Europe as a whole had its 13th warmest July on record at 1.35°C (2.43°F) above average. July 2019 marked Europe's 23rd consecutive July with temperatures, at least nominally, above average. Of note, another intense heatwave affected Europe at the end of the month, less than four weeks apart from the June heat wave.
- According to Météo France, 25 July 2019 was the hottest day during the heat wave with a national temperature index of 29.4°C (84.9°F), which is equal to the record set on 5 August 2003. During the heat wave, several locations set new monthly temperature records. Of note, Paris' maximum temperature soared to 42.6°C (108.7°F) on 25 July, surpassing the previous July record of 40.4°C (104.7°F) set on 28 July 1947 by 2.2°C (4.0°F). The July 2019 average temperature for France was 23.0°C (73.4°F) or 2.2°C (4.0°F) above average, resulting in the fourth highest July temperature on record for the nation, behind 2006 (+3.6°C / +6.5°F), 1983 (+2.6°C / +4.7°F), and 2018 (+2.4°C / +4.3°F).
- According to the World Meteorological Organization (WMO), Belgium, Germany, Luxembourg, and the Netherlands set new national temperature records. Germany's temperature of 42.6°C (108.7°F) on 25 July became the new national temperature record for July, breaking the previous record of 40.3°C (104.5°F) set on 5 July 2015 by 2.3°C (4.1°F). Netherlands' new national all-time maximum temperature of 40.7°C (105.3°F) set on 25 July in Gilze-Rijen surpassed a 75-year-old record of 38.8°C (101.8°F) set on 23 August 1944 by 0.5°C (0.9°F). This marked the first time ever that temperatures exceeded 40.0°C (104.0°F) in the Netherlands.
- Norway recorded a maximum temperature of 35.6°C (96.1°F) at Laksfors, tying the national maximum temperature record set on 20 June 1970 at Nesbyen (Buskerud). Saltdal recorded a maximum temperature of 34.6°C (94.3°F)—the highest temperature ever recorded north of the Arctic Circle in Norway, according to Météo France. Similarly, Sweden had a maximum temperature of 34.8°C (94.6°F) in the Markusvinsa on 26 July—the nation's[*] highest temperature on record north of the Arctic Circle.
- The United Kingdom's July 2019 temperature of 16.4°C (61.5°F) was 1.2°C (2.2°F) above the 1981–2010 average and tied as the eighth highest July temperature since national records began in 1910. Minimum (nighttime) temperatures were warmer than average, resulting in the fourth highest July minimum temperature for the nation. The heat wave affected the United Kingdom from July 22–26, setting multiple new temperature records. Of note, the station located in Cambridge Botanic Garden had temperatures as high as 38.7°C (101.7°F) on 25 July, becoming the U.K.'s highest temperature on record.
- Spain had its seventh warmest July on record, with a nationally averaged temperature of 25.2°C (77.4°F) or 1.2°C (2.2°F) above the 1981–2010 average. According to Spain's Agencia Estatal de Meteorología, eight of the 10 warmest Julys on record have occurred since 2001. Spain was also affected by the heat wave from 21–24 July. Several stations set new maximum and minimum temperature records. Of interest, the station located in San Sebastián-Igueldo had a maximum temperature of 39.0°C (102.2°F) on 23 July—the highest temperature observed in this location since records began in 1928.
- Several stations across Israel had record-breaking temperatures during July 2019. Of note, at Sedom, located south of the Dead Sea, the daily maximum temperature of 49.9°C (121.8°F) was observed on 17 July—the first time such a high temperature was recorded since 1942. Israel's highest maximum temperature was set on 21 June 1942 at 54.0°C (129.2°F) in Tirat Tzvi. The maximum temperature at Hazeva soared to 48.5°C (119.3°F) on 17 July, the highest temperature for this location since records began in 1988.
- The Kingdom of Bahrain's July 2019 mean temperature of 36.0°C (96.8°F) was 2.1°C (3.8°F) above average and tied with 2012 and 2016 as the third highest mean temperature for July since national records began in 1902. Only Julys 2017 (36.9°C / 98.4°F) and 2018 (36.2°C / 97.2°F) were warmer.
- Hong Kong's July 2019 minimum temperature of 27.7°C (81.9°F) was 0.9°C (1.62°F) above average—this was the highest July minimum temperature on record.
- Warmer-than-average conditions engulfed much of Australia during July 2019, resulting in the fourth highest mean temperature for the nation at 1.62°C (2.92°F) above the 1961–90 average. July 1973 is the warmest July in the 110-year record at +2.01°C (3.62°F). The nation's maximum temperature was 2.23°C (4.01°F) above average and was the third highest on record. Regionally, New South Wales, Victoria, South Australia, and Western Australia had a July 2019 temperature that ranked among the top four warmest Julys on record.
- New Zealand had its second warmest July at 9.6°C (49.3°F) or 1.7°C (3.1°F) above the 1981–2010 average. July 1998 is the warmest July on record for the nation. New Zealand's temperature records extend back to 1909. July 2019 also marks the 30th consecutive month with temperatures above average. Several stations across New Zealand had their warmest July on record, with temperature departures from average ranging between +1.7°C (+3.1°F) and +3.8°C (+6.8°F).
El Niño transitioned to ENSO-neutral during July 2019. According to NOAA's Climate Prediction Center, ENSO-neutral is most likely to continue through the Northern Hemisphere winter (Southern Hemisphere summer). This forecast focuses on the ocean surface temperatures between 5°N and 5°S latitude and 170°W to 120°W longitude, called the Niño 3.4 region.
* - the word "nation's" was added to the original report to clarify the scope of the record
Year-to-date Temperature
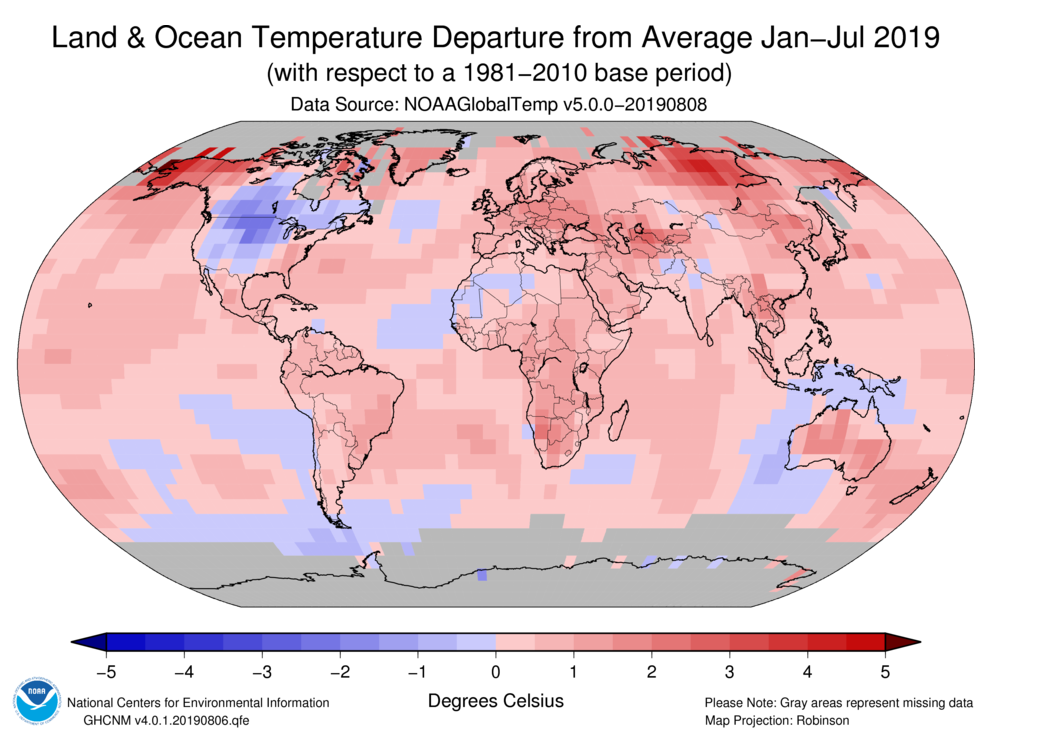
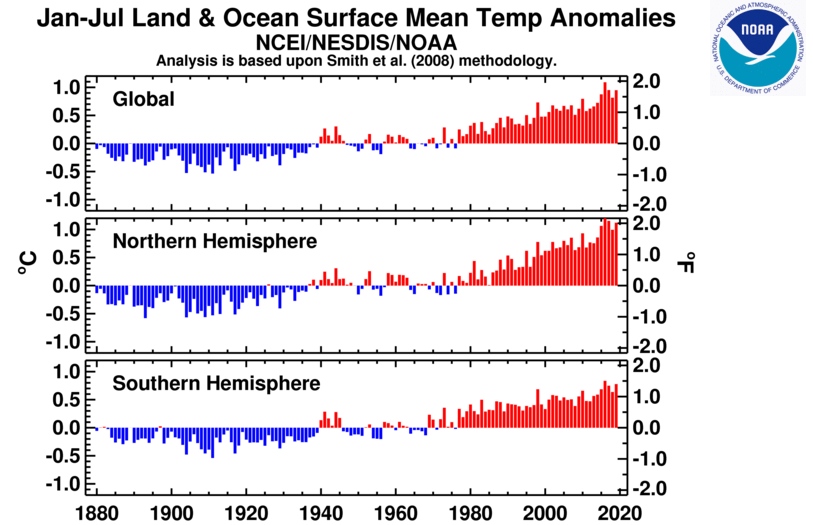
The combined global land and ocean surface temperature for January–July 2019 was 0.95°C (1.71°F), tying with 2017 as the second highest January–July period since global records began in 1880. Only January–July 2016 was warmer at +1.09°C (+1.96°F). According to NCEI's global annual temperature ranking outlook, it is virtually certain that 2019 will end among the top five warm years.

The first seven months of the year were characterized by warmer-than-average conditions across much of the world's land and ocean surfaces. The most notable warm temperature departures from average were present across parts of the Northern Hemisphere, specifically Alaska, northwestern Canada, and central Russia, where temperature departures from average were +2.0°C (+3.6°F) or higher. Meanwhile, the most notable cool temperature departures from average were present across much of the contiguous United States and southern Canada, where temperatures were at least 1.0°C (1.8°F) below average or cooler. Record warm January–July temperatures were present across the southern half of Africa and parts of North America, South America, Asia, Australia, New Zealand and its surrounding ocean, as well as parts of the western Pacific Ocean, Atlantic Ocean, and western Indian Ocean. No land or ocean areas had record cold temperatures for January–July 2019.
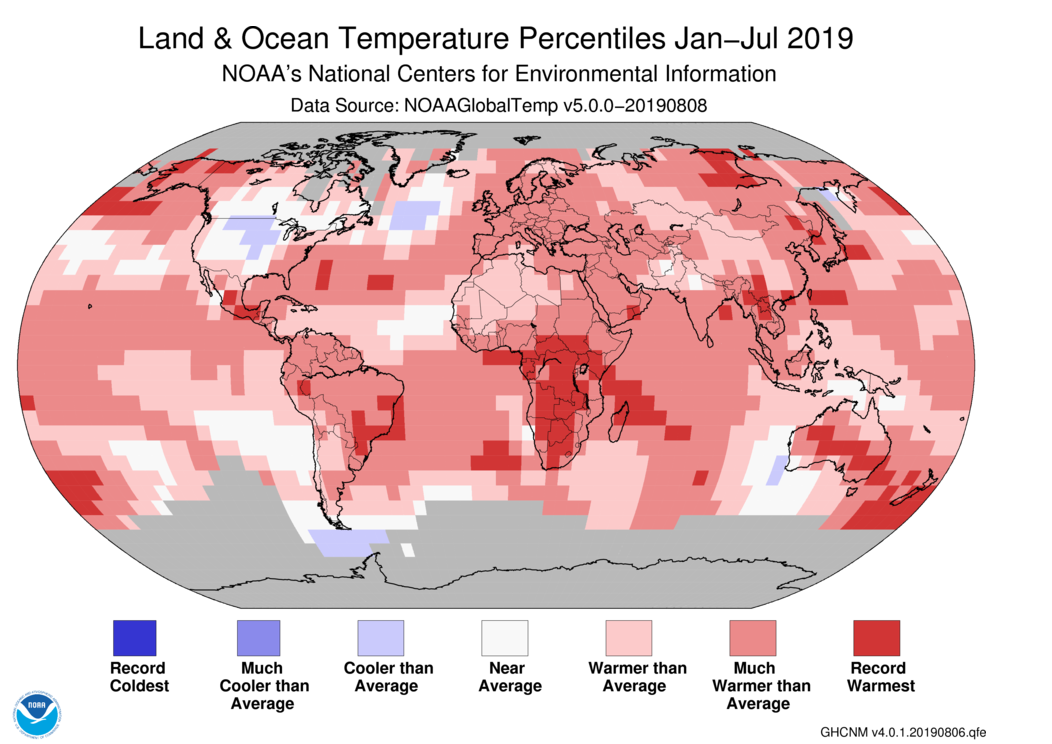
Regionally, South America, Europe, Africa, Asia, Oceania, and the Hawaiian region had a January–July temperature that ranked among the five highest such periods on record, with South America and Oceania having their second warmest year-to-date on record. The Caribbean region had its eighth warmest January–July (tied with 2014) on record. Meanwhile, North America had its coolest (or least warm) January–July temperature since 2014.
Select national information is highlighted below. Please note that different countries report anomalies with respect to different base periods. The information provided here is based directly upon these data:
- The January–July temperature for Australia ranked as the second highest for such period on record.
| January–July | Anomaly | Rank (out of 140 years) | Records | ||||
|---|---|---|---|---|---|---|---|
| °C | °F | Year(s) | °C | °F | |||
| Global | |||||||
| Land | +1.46 ± 0.17 | +2.63 ± 0.31 | Warmest | 3rd | 2016 | +1.78 | +3.20 |
| Coolest | 138th | 1893 | -0.78 | -1.40 | |||
| Ocean | +0.76 ± 0.17 | +1.37 ± 0.31 | Warmest | 2nd | 2016 | +0.83 | +1.49 |
| Coolest | 139th | 1904, 1911 | -0.50 | -0.90 | |||
| Land and Ocean | +0.95 ± 0.17 | +1.71 ± 0.31 | Warmest | 2nd | 2016 | +1.09 | +1.96 |
| Coolest | 139th | 1911 | -0.54 | -0.97 | |||
| Ties: 2017 | |||||||
| Northern Hemisphere | |||||||
| Land | +1.50 ± 0.20 | +2.70 ± 0.36 | Warmest | 4th | 2016 | +1.98 | +3.56 |
| Coolest | 137th | 1883, 1893 | -0.86 | -1.55 | |||
| Ocean | +0.89 ± 0.17 | +1.60 ± 0.31 | Warmest | 2nd | 2016 | +0.95 | +1.71 |
| Coolest | 139th | 1904 | -0.53 | -0.95 | |||
| Land and Ocean | +1.12 ± 0.18 | +2.02 ± 0.32 | Warmest | 3rd | 2016 | +1.34 | +2.41 |
| Coolest | 138th | 1893 | -0.58 | -1.04 | |||
| Southern Hemisphere | |||||||
| Land | +1.36 ± 0.14 | +2.45 ± 0.25 | Warmest | 1st | 2019 | +1.36 | +2.45 |
| Coolest | 140th | 1917 | -0.85 | -1.53 | |||
| Ocean | +0.67 ± 0.18 | +1.21 ± 0.32 | Warmest | 3rd | 2016 | +0.76 | +1.37 |
| Coolest | 138th | 1911 | -0.51 | -0.92 | |||
| Land and Ocean | +0.78 ± 0.17 | +1.40 ± 0.31 | Warmest | 2nd | 2016 | +0.84 | +1.51 |
| Coolest | 139th | 1911 | -0.54 | -0.97 | |||
| Arctic | |||||||
| Land and Ocean | +2.34 ± 0.24 | +4.21 ± 0.43 | Warmest | 2nd | 2016 | +2.77 | +4.99 |
| Coolest | 139th | 1888 | -1.41 | -2.54 | |||

Precipitation
July Precipitation


The maps shown above represent precipitation percent of normal (left, using a base period of 1961–1990) and precipitation percentiles (right, using the period of record) based on the GHCN dataset of land surface stations. As is typical, precipitation anomalies during July 2019 varied significantly around the world. July precipitation was generally drier than normal across Hawaii, the western, southern, and southeastern parts of the contiguous U.S., southern South America, central Europe, north-central Russia, as well as Australia, and across some Pacific Islands. Wetter-than-normal conditions were notable across the northern contiguous U.S., southeastern Europe, parts of western and southern Asia, and southern Japan.
Select national information is highlighted below. (Please note that different countries report anomalies with respect to different base periods. The information provided here is based directly upon these data):
- Australia had a drier-than-average July at 53% below average and the 12th driest July since national precipitation records began in 1900. All regions had below average conditions during the month, with the exception of Tasmania which had 36% above average precipitation. Several stations across Tasmania had their wettest July on record. The region with the most precipitation deficit was the Northern Territory at 99% below average. South Australia had its driest July since 1997 and the eighth driest in the 120-year record at 68% below average. Western Australia had its tenth driest July (61% below average) on record.
- Heavy rain fell across parts of northeastern Brazil on 24 July. According to Floodlist, the municipality of Recife had 102 mm (4.0 inches) in just 6 hours and 146 mm (5.7 inches) of rain in 24-hours.
References
- Menne, M. J., C. N. Williams, B.E. Gleason, J. J Rennie, and J. H. Lawrimore, 2018: The Global Historical Climatology Network Monthly Temperature Dataset, Version 4. J. Climate, in press. https://doi.org/10.1175/JCLI-D-18-0094.1.
- Huang, B., Peter W. Thorne, et. al, 2017: Extended Reconstructed Sea Surface Temperature version 5 (ERSSTv5), Upgrades, validations, and intercomparisons. J. Climate, doi: 10.1175/JCLI-D-16-0836.1
- Peterson, T.C. and R.S. Vose, 1997: An Overview of the Global Historical Climatology Network Database. Bull. Amer. Meteorol. Soc., 78, 2837-2849.
- Huang, B., V.F. Banzon, E. Freeman, J. Lawrimore, W. Liu, T.C. Peterson, T.M. Smith, P.W. Thorne, S.D. Woodruff, and H-M. Zhang, 2016: Extended Reconstructed Sea Surface Temperature Version 4 (ERSST.v4). Part I: Upgrades and Intercomparisons. J. Climate, 28, 911-930.