
Introduction
Temperature anomalies and percentiles are shown on the gridded maps below. The anomaly map on the left is a product of a merged land surface temperature (Global Historical Climatology Network, GHCN) and sea surface temperature (ERSST.v4) anomaly analysis as described in Huang et al. (2016). Temperature anomalies for land and ocean are analyzed separately and then merged to form the global analysis. For more information, please visit NCEI's Global Surface Temperature Anomalies page. The percentile map on the right provides additional information by placing the temperature anomaly observed for a specific place and time period into historical perspective, showing how the most current month, season or year compares with the past.
Temperature
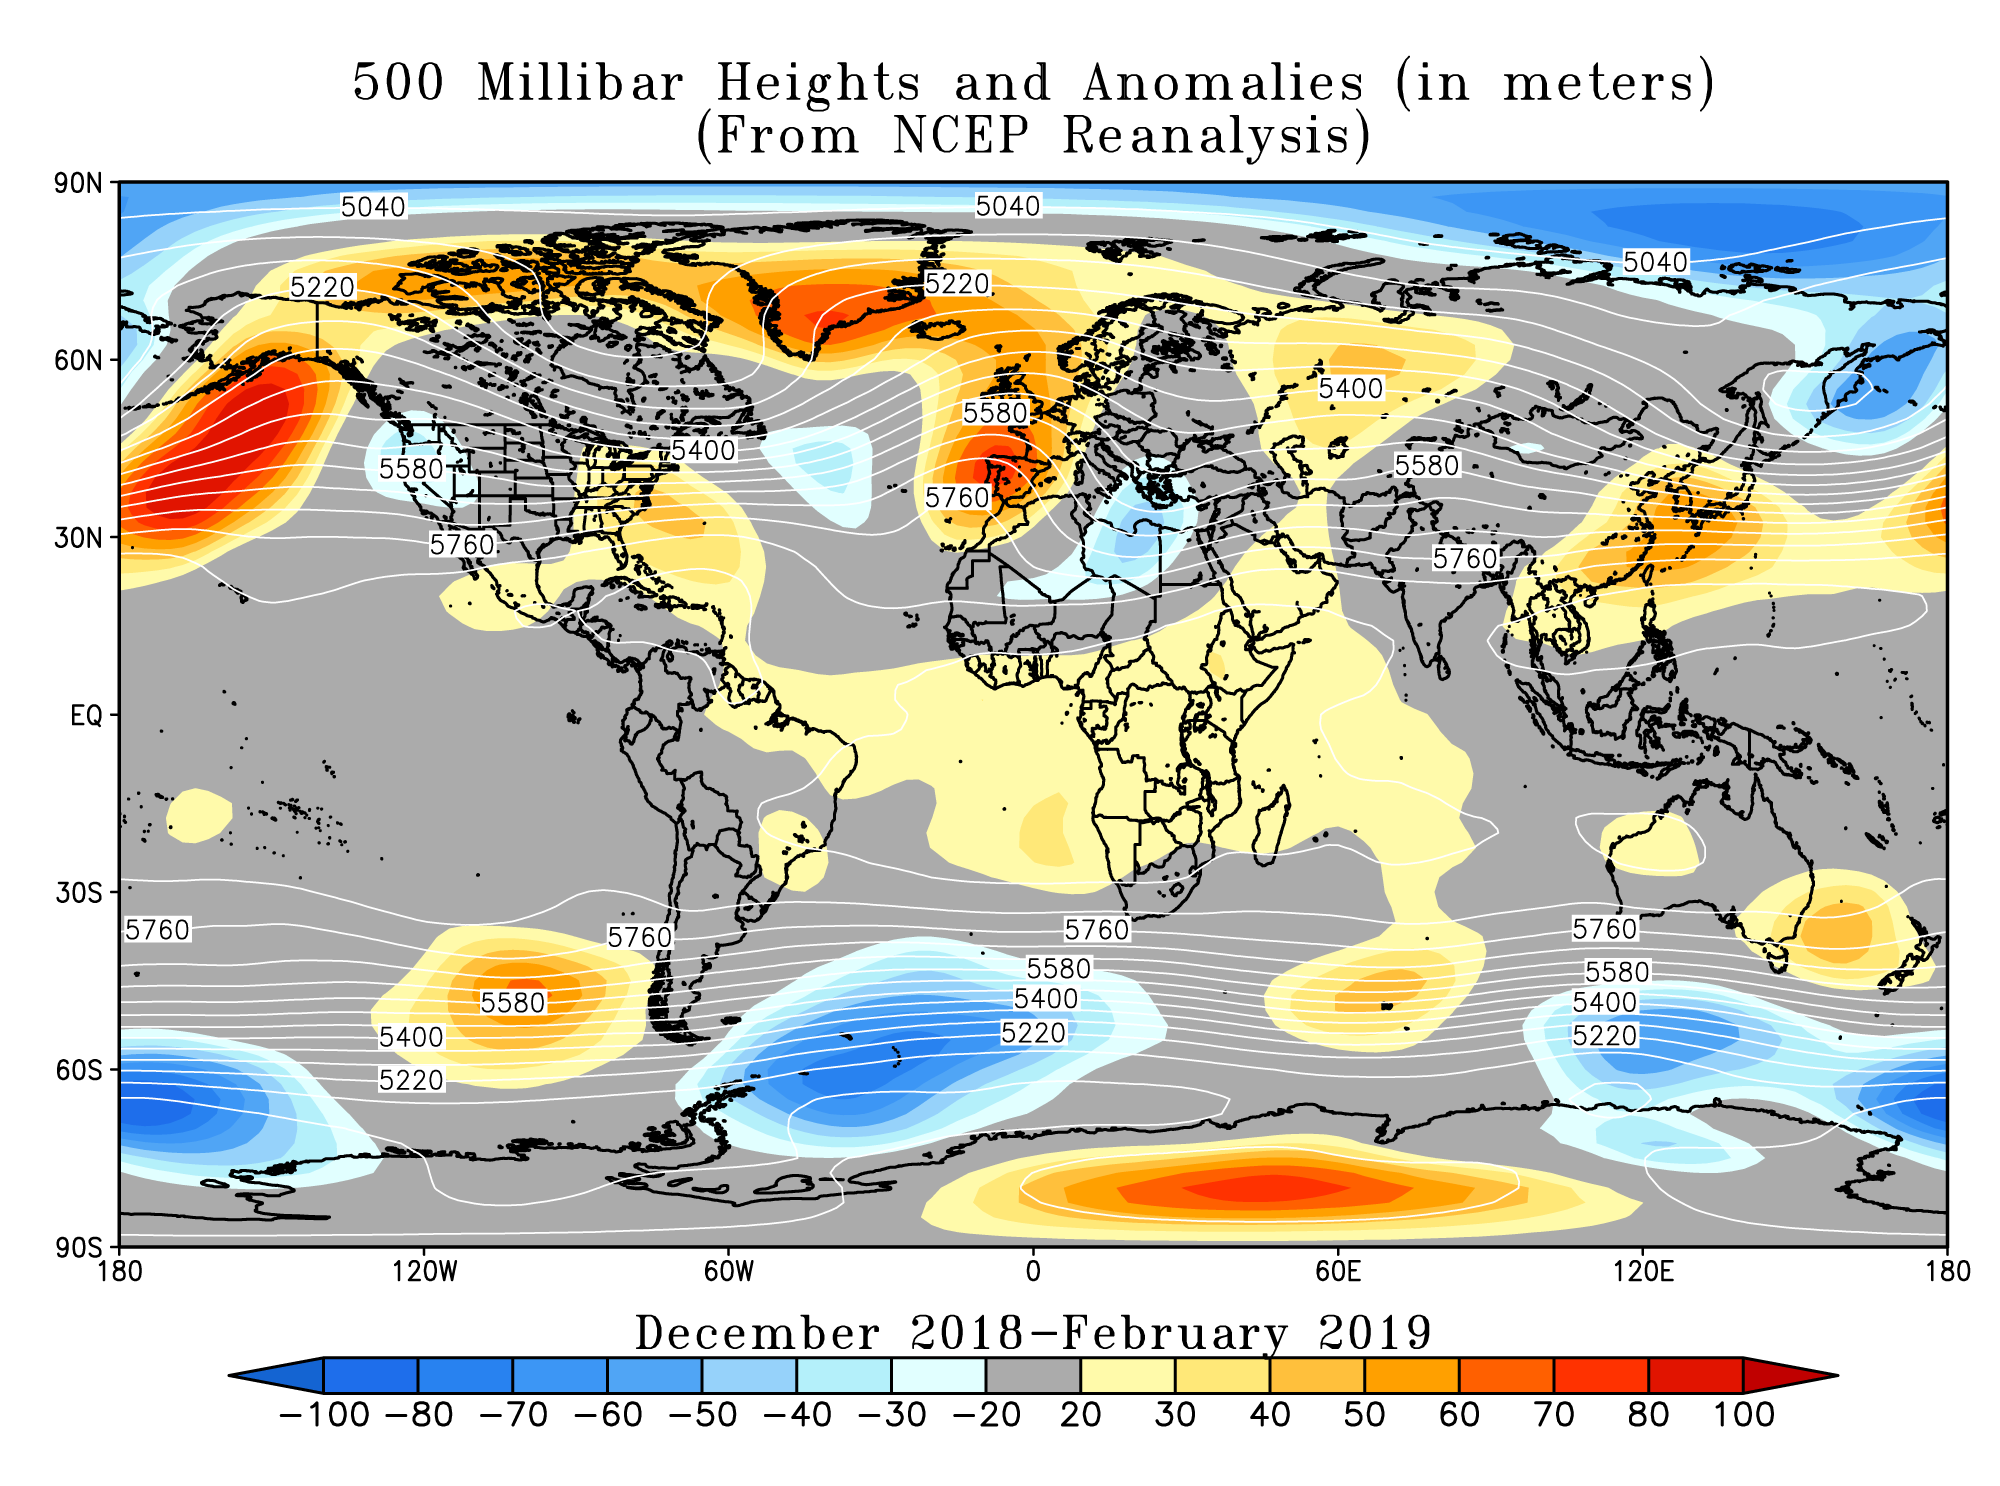
In the atmosphere, 500-millibar height pressure anomalies correlate well with temperatures at the Earth's surface. The average position of the upper-level ridges of high pressure and troughs of low pressure—depicted by positive and negative 500-millibar height anomalies on the February 2019 and December–February 2019 maps—is generally reflected by areas of positive and negative temperature anomalies at the surface, respectively.
February Temperature


The February 2019 global land and ocean surface temperature was the fifth highest for February in the 140-year record at 0.79°C (1.42°F) above the 20th century average. While much of the Southern Hemisphere was experiencing unusually warm conditions during February, the Northern Hemisphere was much more variable. The most notable cool temperature departures from average were present across parts of the Northern Hemisphere, specifically across Canada and the contiguous U.S. as well as parts of central Asia, where temperatures were 3.0°C (5.4°F) below average or cooler. Meanwhile, much of Alaska, Europe, central Russia and the Far East had temperatures that were 4.0°C (7.2°F) above average or higher. Across the oceans, the Southern Ocean off the southern coast of South Africa was quite remarkable and record warm for this region, with temperature departures from average at +2.5°C (+4.5°F) or higher. Additional areas with record warm February temperatures include parts of Alaska, Central America, the Barents Sea, the Southern Ocean off Australia's southeastern coast, the Indian Ocean, the East China Sea as well as parts of northeastern Brazil.
Averaged separately, the global land-only surface temperature was the 15th highest on record for February at 1.04°C (1.87°F) above the 20th century average. Meanwhile, the global ocean-only surface temperature was 0.70°C (1.26°F) above average and the second warmest February since global records began in 1880. This value is 0.11°C (0.20°F) less than the record-warm February set in 2016.
Of note, the Southern Hemisphere, as a whole, had its second warmest February on record at 0.76°C (1.37°F) above average, trailing behind 2016 (+0.87°C / +1.57°F).
According to NCEI's Regional Analysis, South America, Europe and Oceania had a February temperature that ranked among the eight warmest Februarys on record. Meanwhile, Africa and North America had their smallest (least warm) February temperature departure from average since 2014. North America was the only continent that had a February temperature that was below average. The Caribbean region had a February temperature that was the sixth highest on record. Meanwhile, the Hawaiian region had its smallest (least warm) February temperature since 2013.
Select national information is highlighted below. Please note that different countries report anomalies with respect to different base periods. The information provided here is based directly upon these data:
-
Warmer-than-average conditions were present across much of western and central Europe during late February, causing several locations to set new February maximum temperature records.
- The United Kingdom recorded for the first time a maximum temperature over 20.0°C (68.0°F) during a winter month. The maximum temperature of 20.6°C (69.1°F) was first set on 25 February 2019 at Trawsgoed, Ceredigion, surpassing the United Kingdom's February maximum temperature of 19.7°C (67.5°F) set in 1998. However, this temperature was broken again the following day (26 February 2019) when maximum temperatures soared to 21.2°C (70.2°F) in Kew Gardens, London.
- A new Swedish maximum temperature for February was set on 26 February 2019 when temperatures rose to 16.7°C (62.1°F) in Karlshamn. This value surpassed the previous record of 16.5°C (61.7°F) set in Ölvingstorp and Västervik, Småland on 18 February 1961.
- The Netherlands observed their highest February maximum temperature since national records began in 1901. On 26 February 2019, maximum temperatures reached 18.9°C (66.0°F) in De Bilt.
- According to MeteoLux, the maximum temperature of 19.8°C (67.6°F) observed at the Findel-Aéroport in Luxembourg was the highest maximum temperature recorded since the station's records began in 1947. The previous record of 18.2°C (64.8°F) was set on 29 February 1960.
- Austria set a new national maximum temperature record on 28 February 2019 when temperatures soared to 24.2°C (75.6°F) in Güssing and Deutschlandsberg. This value exceeded the previous record set in 29 February 1960 by 0.6°C (1.1°F).
- On 27 February, France's thermal indicator (which is the daily average temperatures of 30 metropolitan stations) for maximum temperature was 21.3°C (70.3°F). This value is 10.0°C (18.0°F) above the seasonal average and was the hottest winter day since 1950. Only two other times have temperatures been 20.0°C (68°F) or higher on record: 23 February 1990 with a maximum temperature of 20.0°C (68.0°F) and 28 February 1960 with a maximum temperature of 20.2°C (68.4°F). Several locations across France reached new maximum temperatures for February. Of note, Brive-la-Gaillarde had a maximum temperature of 25.0°C (77.0°F) set on 27 February 2019. This value surpassed the previous record set on 28 February 1997 with a maximum temperature of 24.4°C (75.9°F). Averaged for the nation as a whole, France had its second highest maximum temperature on record at 4.1°C (7.4°F) above average, behind 1990 (+4.8°C / +8.6°F).
- The United Kingdom's February 2019 national mean temperature was 6.0°C (42.8°F) or 2.4°C (4.3°F) above the 1981–2010 average—the second highest February mean temperature in the nation's 110-year record, trailing behind 1998. The nation's maximum temperature was the highest on record. Provisionally, England (fifth warmest), Wales (third warmest), Scotland (second warmest), and Northern Ireland (tied third warmest) had a mean temperature that ranked among the five highest on record.
- Warmer-than-average conditions were present across much of Australia during February 2019. The nation's monthly average mean temperature was 1.38°C (2.48°F) above the 1961–1990 average and the fourth highest since national records began in 1910. The warmest February took place in 1983 with a nationally-averaged temperature of 2.0°C (3.6°F) above average. Australia's maximum and minimum temperatures were also warmer than average at 2.05°C (3.69°F) and 0.71°C (1.28°F) above average. The national maximum temperature ranked as the fifth highest in the 110-year record. Regionally, Western Australia and Northern Territory had their fourth highest February mean temperature on record at 2.05°C (3.69°F) and 1.87°C (3.37°F) above average.
- Hong Kong's monthly mean, maximum, and minimum temperatures during February 2019 were the second highest on record at 3.3°C (5.9°F), 3.7°C (6.7°F) and 3.4°C (6.1°F) above average, respectively.
El Niño conditions persisted across the tropical Pacific Ocean during February 2019. According to NOAA's Climate Prediction Center, El Niño conditions are likely to continue through the Northern Hemisphere spring (Southern Hemisphere autumn) 2019 with ~80% chance. This forecast focuses on the ocean surface temperatures between 5°N and 5°S latitude and 170°W to 120°W longitude, called the Niño 3.4 region.
| February | Anomaly | Rank (out of 140 years) | Records | ||||
|---|---|---|---|---|---|---|---|
| °C | °F | Year(s) | °C | °F | |||
| Global | |||||||
| Land | +1.04 ± 0.12 | +1.87 ± 0.22 | Warmest | 15th | 2016 | +2.31 | +4.16 |
| Coolest | 126th | 1893 | -1.62 | -2.92 | |||
| Ocean | +0.70 ± 0.14 | +1.26 ± 0.25 | Warmest | 2nd | 2016 | +0.81 | +1.46 |
| Coolest | 139th | 1911 | -0.51 | -0.92 | |||
| Land and Ocean | +0.79 ± 0.13 | +1.42 ± 0.23 | Warmest | 5th | 2016 | +1.21 | +2.18 |
| Coolest | 136th | 1905 | -0.62 | -1.12 | |||
| Northern Hemisphere | |||||||
| Land | +1.00 ± 0.16 | +1.80 ± 0.29 | Warmest | 20th | 2016 | +2.67 | +4.81 |
| Coolest | 121st | 1893 | -1.96 | -3.53 | |||
| Ocean | +0.72 ± 0.13 | +1.30 ± 0.23 | Warmest | 2nd | 2016 | +0.87 | +1.57 |
| Coolest | 139th | 1911 | -0.48 | -0.86 | |||
| Land and Ocean | +0.82 ± 0.13 | +1.48 ± 0.23 | Warmest | 10th | 2016 | +1.56 | +2.81 |
| Coolest | 131st | 1893 | -0.98 | -1.76 | |||
| Southern Hemisphere | |||||||
| Land | +1.16 ± 0.11 | +2.09 ± 0.20 | Warmest | 3rd | 2016 | +1.38 | +2.48 |
| Coolest | 138th | 1917 | -1.03 | -1.85 | |||
| Ocean | +0.69 ± 0.14 | +1.24 ± 0.25 | Warmest | 2nd | 2016 | +0.77 | +1.39 |
| Coolest | 139th | 1911 | -0.53 | -0.95 | |||
| Ties: 2017 | |||||||
| Land and Ocean | +0.76 ± 0.14 | +1.37 ± 0.25 | Warmest | 2nd | 2016 | +0.87 | +1.57 |
| Coolest | 139th | 1911 | -0.55 | -0.99 | |||
| Arctic | |||||||
| Land and Ocean | +2.38 ± 0.66 | +4.28 ± 1.19 | Warmest | 8th | 1934 | +3.77 | +6.79 |
| Coolest | 133rd | 1895 | -3.47 | -6.25 | |||
| Ties: 2000 | |||||||


Seasonal Temperature


The period of December–February is defined as the Northern Hemisphere's winter and the Southern Hemisphere's summer.
The three-month period was characterized by warmer-than-average conditions across much of the global land and ocean surfaces. The most notable warmer-than-normal land surface temperature departures from average during December 2018–February 2019 were present across much of Alaska, the southeastern contiguous U.S., central Russia, Europe, southwestern Asia, Australia and the Southern Ocean off South Africa's southern coast. These areas had temperature departures that were 2.0°C (3.6°F) above average or higher. Meanwhile, the most notable cool temperature departures were present across much of Canada, the northern contiguous U.S., and central Asia, where temperatures were 1.5°C (2.7°F) below average or cooler. Record-warm temperatures during December–February were present across much of Australia and its surrounding Southern Ocean as well as parts of France, southwestn Asia, Africa, East China and Barents Seas, the southeastern Pacific Ocean and the Southern Ocean off South Africa's southern coast. However, no land or ocean areas had record-cold temperatures during the three-month season.
Averaged as a whole, the global land and ocean surface temperature for the season was 0.84°C (1.51°F) above the 20th century average. This was the fourth highest December–February period since global records began in 1880. The yearly global land and ocean surface temperature for the three-month season has increased at an average rate of 0.07°C (0.13°F) per decade since 1880; however, the average rate of increase has doubled (0.14°C / 0.25°F per decade) since 1981. The global ocean-only temperature was the second highest on record at 0.70°C (1.26°F) above average. This value trails behind 2016 by 0.14°C (0.25°F). Of note, the Southern Hemisphere global land and ocean temperature was also near-record warm, ranking as the second warmest December–February on record, behind 2016. Separately, the Southern Hemisphere land-only and ocean-only temperatures were also the second highest in the 140-year record, behind 2016.
According to NCEI's Regional Analysis, Oceania had its warmest December–February on record. Australia, which is part of the Oceania region, also had its warmest December–February on record. South America and Europe had a December–February temperature that ranked among the seven highest such periods on record. North America and Asia had their smallest (least warm) temperature departure from average for December–February since 2014. The Caribbean region also had its smallest (least warm) temperature departure from average for the three-month season since 2012 and the 10th warmest since regional records began in 1910.
Select national information is highlighted below. (Please note that different countries report anomalies with respect to different base periods. The information provided here is based directly upon these data):
- Winter 2018/19 was France's tenth warmest winter on record, with a national temperature at 1.3°C (2.3°F) above the 1981–2010 average.
- Several locations across Ireland had their warmest winter on record, with mean temperature departures from average ranging between 1.2°C (2.2°F) to 2.1°C (3.8°F) above average. The highest seasonal maximum temperature was reported in Mount Dillon, Co Roscommon on 25 February 2019, when temperatures climbed to 17.3°C (63.1°F). This was the station's highest maximum temperature for winter since 2006.
- With above-average conditions during each month that comprise the winter season, Hong Kong had its warmest winter on record at 19.1°C (66.4°F) or 2.1°C (3.8°F) above average. According to the Government of Hong Kong Special Administration Region, the season had only three cold days—the fewest number of cold days on record.
- New Zealand's summer temperature was 17.9°C (64.2°F), which is 1.2°C (2.2°F) above the 1981–2010 average and the third warmest summer since national records began in 1909. The summers 2017/18 (warmest) and 1934/35 (second warmest) were warmer.
- Summer 2018/19 was Australia's warmest summer on record, with a national average mean temperature at 2.14°C (3.8°F) above the 1961–1990 average. This value exceeds the previous record of +1.28°C (+2.30°F) set in 2012/13 by 0.86°C (1.55°F). The national maximum and minimum temperatures were also record warm at +2.61°C (+4.70°F) and +1.67°C (+3.01°F), respectively. Regionally, New South Wales (+3.41°C / +6.14°F), Victoria (+2.54°C / +4.57°F), Western Australia (+1.73°C / +3.11°F), and the Northern Territory (+2.67°C / +4.81°F) had record warm summer temperatures. South Australia and Tasmania had their second highest summer temperature on record, with Queensland having its fourth warmest on record.
- Argentina's summer was slightly above average. However, this was the least warm summer since 2010.
| December–February | Anomaly | Rank (out of 140 years) | Records | ||||
|---|---|---|---|---|---|---|---|
| °C | °F | Year(s) | °C | °F | |||
| Global | |||||||
| Land | +1.22 ± 0.16 | +2.20 ± 0.29 | Warmest | 8th | 2016 | +1.93 | +3.47 |
| Coolest | 133rd | 1893 | -1.49 | -2.68 | |||
| Ocean | +0.70 ± 0.15 | +1.26 ± 0.27 | Warmest | 2nd | 2016 | +0.84 | +1.51 |
| Coolest | 139th | 1911 | -0.48 | -0.86 | |||
| Land and Ocean | +0.84 ± 0.15 | +1.51 ± 0.27 | Warmest | 4th | 2016 | +1.13 | +2.03 |
| Coolest | 137th | 1893 | -0.58 | -1.04 | |||
| Northern Hemisphere | |||||||
| Land | +1.19 ± 0.20 | +2.14 ± 0.36 | Warmest | 10th | 2016 | +2.15 | +3.87 |
| Coolest | 131st | 1893 | -1.84 | -3.31 | |||
| Ties: 1995 | |||||||
| Ocean | +0.74 ± 0.15 | +1.33 ± 0.27 | Warmest | 2nd | 2016 | +0.94 | +1.69 |
| Coolest | 139th | 1911 | -0.45 | -0.81 | |||
| Land and Ocean | +0.91 ± 0.17 | +1.64 ± 0.31 | Warmest | 6th | 2016 | +1.40 | +2.52 |
| Coolest | 135th | 1893 | -0.97 | -1.75 | |||
| Southern Hemisphere | |||||||
| Land | +1.31 ± 0.13 | +2.36 ± 0.23 | Warmest | 2nd | 2016 | +1.35 | +2.43 |
| Coolest | 139th | 1904 | -0.87 | -1.57 | |||
| Ocean | +0.67 ± 0.16 | +1.21 ± 0.29 | Warmest | 2nd | 2016 | +0.78 | +1.40 |
| Coolest | 139th | 1911 | -0.49 | -0.88 | |||
| Land and Ocean | +0.77 ± 0.15 | +1.39 ± 0.27 | Warmest | 2nd | 2016 | +0.86 | +1.55 |
| Coolest | 139th | 1911 | -0.52 | -0.94 | |||
| Arctic | |||||||
| Land and Ocean | +1.99 ± 0.40 | +3.58 ± 0.72 | Warmest | 5th | 2016 | +2.89 | +5.20 |
| Coolest | 136th | 1893 | -2.49 | -4.48 | |||

Year-to-date Temperature

The January–February 2019 spatial pattern of temperature anomalies was quite similar to February 2019 and the three-month period, with much of the Southern Hemisphere having much-warmer-than-average conditions and the Northern Hemisphere more variable. The most notable warm temperature departures from average were observed across Alaska, Europe, southwestern and northeastern Asia, Australia, and the Southern Ocean off of South Africa's southern coast. These regions had temperatures that were at least 2.0°C (3.6°F) above average or higher. The most notable cool temperatures were present across much of Canada and the western half of the contiguous U.S. as well as parts of central Asia, where temperatures were 2.0°C (3.6°F) below average or lower. Record-warm temperatures were mainly present across Australia and its surrounding Southern Ocean as well as the Southern Ocean off the southern coast of South Africa, East China Sea, southeastern Pacific Ocean, northeastern Brazil, Central America, and the Barents Sea.
The combined global land and ocean surface temperature for January–February 2019 was 0.84°C (1.51°F) above the 20th century average and the fourth highest for the year-to-date since global records began in 1880. The global ocean-only temperature was the third highest on record, while the global land-only temperature being the eighth highest in the 140-year record. Of interest, the Southern Hemisphere land-only temperature was 1.32°C (2.38°F) above average, tying with 2016 as the highest January–February temperature on record. The Southern Hemisphere ocean temperature was the third highest at 0.65°C (1.17°F) above average, falling behind 2016 and 2017. Averaged as a whole, the Southern Hemisphere land and ocean temperature was the second highest on record (behind 2016) at 0.76°C (1.37°F).
According to NCEI's Regional Analysis, Oceania's January–February 2019 temperature was 1.80°C (3.24°F) above average and the highest such period since continental records began in 1910. South America had its fifth highest such period on record. However, North America had its smallest (least warm) January–February temperature departure from average since 2008.
| January–February | Anomaly | Rank (out of 140 years) | Records | ||||
|---|---|---|---|---|---|---|---|
| °C | °F | Year(s) | °C | °F | |||
| Global | |||||||
| Land | +1.27 ± 0.17 | +2.29 ± 0.31 | Warmest | 8th | 2016 | +1.95 | +3.51 |
| Coolest | 133rd | 1893 | -1.79 | -3.22 | |||
| Ocean | +0.67 ± 0.15 | +1.21 ± 0.27 | Warmest | 3rd | 2016 | +0.84 | +1.51 |
| Coolest | 138th | 1911 | -0.47 | -0.85 | |||
| Land and Ocean | +0.84 ± 0.15 | +1.51 ± 0.27 | Warmest | 4th | 2016 | +1.14 | +2.05 |
| Coolest | 137th | 1893 | -0.63 | -1.13 | |||
| Northern Hemisphere | |||||||
| Land | +1.25 ± 0.22 | +2.25 ± 0.40 | Warmest | 9th | 2016 | +2.20 | +3.96 |
| Coolest | 132nd | 1893 | -2.24 | -4.03 | |||
| Ties: 2004 | |||||||
| Ocean | +0.71 ± 0.14 | +1.28 ± 0.25 | Warmest | 3rd | 2016 | +0.92 | +1.66 |
| Coolest | 138th | 1894 | -0.45 | -0.81 | |||
| Land and Ocean | +0.91 ± 0.17 | +1.64 ± 0.31 | Warmest | 6th | 2016 | +1.40 | +2.52 |
| Coolest | 135th | 1893 | -1.12 | -2.02 | |||
| Southern Hemisphere | |||||||
| Land | +1.32 ± 0.13 | +2.38 ± 0.23 | Warmest | 1st | 2016, 2019 | +1.32 | +2.38 |
| Coolest | 140th | 1904 | -0.93 | -1.67 | |||
| Ties: 2016 | |||||||
| Ocean | +0.65 ± 0.15 | +1.17 ± 0.27 | Warmest | 3rd | 2016 | +0.79 | +1.42 |
| Coolest | 138th | 1911 | -0.49 | -0.88 | |||
| Land and Ocean | +0.76 ± 0.15 | +1.37 ± 0.27 | Warmest | 2nd | 2016 | +0.87 | +1.57 |
| Coolest | 139th | 1911 | -0.51 | -0.92 | |||
| Arctic | |||||||
| Land and Ocean | +1.95 ± 0.51 | +3.51 ± 0.92 | Warmest | 8th | 2016 | +3.35 | +6.03 |
| Coolest | 133rd | 1966 | -2.82 | -5.08 | |||

Precipitation
February Precipitation
The maps below represent precipitation percent of normal (left, using a base period of 1961–1990) and precipitation percentiles (right, using the period of record) based on the GHCN dataset of land surface stations. As is typical, precipitation anomalies during February 2019 varied significantly around the world. February precipitation was generally drier than normal across the south-central and southeastern contiguous U.S., Mexico, northern and southern South America, Europe, Australia, northern Japan, and parts of central and southeastern Asia. Wetter-than-normal conditions were notable across much of the contiguous U.S., Alaska, Scandinavia, central Russia, western Mongolia, and southern Asia.
Select national information is highlighted below. (Please note that different countries report anomalies with respect to different base periods. The information provided here is based directly upon these data):
- Spain had its fourth driest February since national records began in 1956 with a nationally-averaged precipitation total of 15 mm (0.59 inch), which is 28% of its normal February precipitation total. Februaries 1997, 2000, and 1990 were drier.
- The nationally-averaged precipitation total for Australia was 48.9 mm (1.93 inches), which is 36% below average. February 2019 was characterized by drier-than-average conditions across most of Australia's regions, with the exception of Queensland and Tasmania, which had 21% and 18% above average conditions, respectively. The region with the most precipitation deficit for the month was South Australia, receiving only 1.5 mm (0.06 inch) or 92% below average for February 2019. This was South Australia's ninth driest February in the nation's 120-year precipitation record. The warm and dry conditions across Australia contributed to the development of significant wildfires. The smoke and dust from the wildfires reduced air quality across eastern Australia.
- In New Zealand, several locations had dry conditions in February 2019, persisting from late January 2019. The city of Nelson on the South Island had a 40-day dry spell (15 days or more with less than 1 mm [0.04 inch] of rain on any one day)—its fourth longest dry spell since records began in 1862. Tauranga and Hamilton had a 36-day dry spell, which is their third longest since records began in 1910 and 1935, respectively.
- According to Germany's Deutscher Wetterdienst, copious rain impacted Israel and Jordan on 27–28 February. The cities of Jerusalem and Amman recorded more than one month's worth of rain in just 24 hours. The heavy rain triggered floods and caused traffic disruptions and prompted evacuations.

Seasonal Precipitation
Northern Hemisphere winter / Southern Hemisphere summer precipitation was generally drier than normal across northern and southern parts of South America, northeastern Brazil, western Europe, eastern Mongolia, central India, Australia, and Japan. Wetter-than-normal conditions were notable across the contiguous U.S., Alaska, northern Argentina, Uruguay, northern Europe, Turkey, western Mongolia, and parts of southern Asia.

References
- Peterson, T.C. and R.S. Vose, 1997: An Overview of the Global Historical Climatology Network Database. Bull. Amer. Meteorol. Soc., 78, 2837-2849.
- Huang, B., V.F. Banzon, E. Freeman, J. Lawrimore, W. Liu, T.C. Peterson, T.M. Smith, P.W. Thorne, S.D. Woodruff, and H-M. Zhang, 2016: Extended Reconstructed Sea Surface Temperature Version 4 (ERSST.v4). Part I: Upgrades and Intercomparisons. J. Climate, 28, 911-930.