Global Highlights:
|
Contents of this Section: |
|
The data presented in this
report are preliminary. Ranks and anomalies may change as more
complete data are received and processed. The most current data may
be accessed via the Global Surface
Temperature Anomalies page.
|
|

|
During March, there were above average
temperatures across Europe, the contiguous U.S., Mexico,
southeastern Brazil, and most of Asia. Cooler than average
temperatures were observed in Alaska, central Russia, and parts of
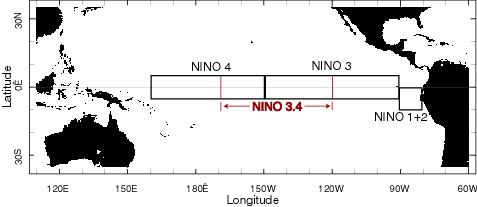
Canada. Warmer than average SSTs occurred in the North Atlantic
Ocean, North Indian Ocean, Northwestern Pacific Ocean, and the
Niño 4
region. SSTs decreased in the Niño 1+2, 3 and 3.4
regions during the month of March, indicative of neutral ENSO
conditions. Please see the latest ENSO
discussion for additional information.
|
 larger image |
 larger image |
The mean position of upper level ridges of
high pressure and troughs of low pressure (depicted by positive and
negative 500-millibar height anomalies on the March map) are
generally reflected by areas of positive and negative temperature
anomalies at the surface, respectively. For other Global products
see the Climate Monitoring
Global Products page.
|
| Images of sea surface temperature conditions are available for all weeks during 2007 at the weekly SST page. |
|
|
Effective with the February 2006 report, NCDC
transitioned from the use of the Operational Global Surface
Temperature Index (Quayle et al. 1999) to the
blended land and ocean dataset developed by Smith and Reynolds (2005).
The differences between the two methods are discussed in Smith et al. (2005).
March 2007 ranked fifth warmest March since
global surface records began in 1880 for combined global land and
ocean surface temperatures. March land surface temperatures were
fourth warmest, while ocean surface temperatures were sixth warmest
in the 127-year record. The January - March 2007 land and ocean
combined temperature is second warmest on record behind 2002.
|
| Current Month Year-to-date |
| March | Anomaly | Rank | Warmest Year on Record |
|---|---|---|---|
GlobalLandOcean Land and Ocean |
+1.16°C (+2.09°F) +0.41°C (+0.74°F) +0.61°C (+1.10°F) |
4th warmest 6th warmest 5th warmest |
1990 (+1.45°C/2.61°F) 1998 (+0.51°C/0.92°F) 2002 (+0.75°C/1.35°F) |
Northern HemisphereLandOcean Land and Ocean |
+1.31°C (+2.36°F) +0.45°C (+0.81°F) +0.77°C (+1.39°F) |
6th warmest 3rd warmest 5th warmest |
1990 (+1.99°C/3.58°F) 2004 (+0.49°C/0.88°F) 1990 (+0.90°C/1.62°F) |
Southern HemisphereLandOcean Land and Ocean |
+0.71°C (+1.28°F) +0.39°C (+0.70°F) +0.43°C (+0.77°F) |
6th warmest 11th warmest 10th warmest |
1988 (+1.60°C/2.88°F) 2002 (+0.56°C/1.01°F) 1988 (+0.63°C/1.13°F) |
 larger image |
 larger image |
| January-March | Anomaly | Rank | Warmest Year on Record |
|---|---|---|---|
GlobalLandOcean Land and Ocean |
+1.30°C (+2.34°F) +0.45°C (+0.81°F) +0.68°C (+1.22°F) |
2nd warmest 5th warmest 2nd warmest |
2002 (+1.50°C/2.70°F) 1998 (+0.53°C/0.95°F) 2002 (+0.73°C/1.31°F) |
Northern HemisphereLandOcean Land and Ocean |
+1.53°C (+2.75°F) +0.47°C (+0.85°F) +0.87°C (+1.57°F) |
2nd warmest 3rd warmest 2nd warmest |
2002 (+1.87°C/3.37°F) 1998 (+0.50°C/0.90°F) 2002 (+0.95°C/1.71°F) |
Southern HemisphereLandOcean Land and Ocean |
+0.62°C (+1.12°F) +0.44°C (+0.79°F) +0.47°C (+0.85°F) |
5th warmest 7th warmest 7th warmest |
1998 (+0.86°C/1.55°F) 1998 (+0.56°C/1.01°F) 1998 (+0.60°C/1.08°F) |
 larger image |
 larger image |
|
 larger image |
 larger image |
|
|

|