NH Snow Cover Extent
| February 2015 | Snow Cover Extent | Anomaly 1991-2020 | Trend per decade | Rank (49 years) | Record | ||||||
|---|---|---|---|---|---|---|---|---|---|---|---|
| million km² | million mi² | million km² | million mi² | million km² | million mi² | Year(s) | million km² | million mi² | |||
| Northern Hemisphere | 44.99 | 17.37 | -0.79 | -0.31 | -0.08 | -0.03 | Largest | 33rd | 1978 | 51.32 | 19.81 |
| Smallest | 17th | 1990 | 42.16 | 16.28 | |||||||
| North America | 17.39 | 6.71 | +0.18 | +0.07 | +0.06 | +0.02 | Largest | 23rd | 1978 | 19.04 | 7.35 |
| Smallest | 27th | 1991 | 15.63 | 6.03 | |||||||
| Eurasia | 27.59 | 10.65 | -0.97 | -0.37 | -0.14 | -0.05 | Largest | 40th | 1972 | 33.26 | 12.84 |
| Smallest | 10th | 2002 | 25.91 | 10.00 | |||||||
Data Source: Global Snow Laboratory, Rutgers University. Period of record: 1967–2015 (49 years)
During February 2015, the Northern Hemisphere snow cover extent (SCE) was 44.99 million square km (17.37 million square miles), 600,000 square km (230,000 square miles) below the 1981-2010 average. This was the 14th smallest February Northern Hemisphere SCE in the 49-year period of record, and the smallest since 2009. This is also the first time since 2009 that the February Northern Hemisphere SCE was below average. The Eurasian SCE was below average, while the North America SCE was above average. For the winter season (December 2014-February 2015), the Northern Hemisphere SCE was 60,000 square km (23,000 square miles) below the 1981-2010 average — the 20th smallest winter SCE for the Northern Hemisphere and the smallest since 2006/07.

The February North American snow cover extent was 17.39 square km (6.72 million square miles), 270,000 square km (110,000 square miles) above average. This was the 20th largest February SCE on record, but the smallest since 2012. Above-average snow cover was observed across the south-central and eastern parts of the contiguous United States. Below-average snow cover was observed across the north-central and western regions of the contiguous U.S. and parts of southern Alaska. Several winter storms impacted the eastern U.S. during February while western U.S. mountain snowpack was significantly below average; please see the U.S. snow and ice report for additional information. The winter SCE for North America was 70,000 square km (27,000 square miles) below the 1981-2010 average, the 22nd largest winter SCE for the continent.

The Eurasian SCE during February was 27.59 million square km (10.65 million square miles), 890,000 square km (340,000 square miles) below average. This was the ninth smallest February Eurasian SCE on record and the smallest since 2004. Above-average snow cover was observed across the European Alps and parts of northeastern China. Below-average snow cover was observed across much of central Europe, southern Kazakhstan, northern Iran, Mongolia, and the Tibetan Plateau. For the winter season, the Eurasian SCE was 10,000 square km (3,900 square miles) above average and the 22nd smallest winter SCE for the continent.
Sea Ice Extent
| February 2015 | Sea Ice Extent | Anomaly 1991-2020 | Trend per decade | Rank (37 years) | Record | ||||
|---|---|---|---|---|---|---|---|---|---|
| million km² | million mi² | Year(s) | million km² | million mi² | |||||
| Northern Hemisphere | 14.40 | 5.56 | -3.10% | -2.89% | Largest | 34th | 1979 | 16.18 | 6.25 |
| Smallest | 4th | 2006 | 14.32 | 5.53 | |||||
| Southern Hemisphere | 3.80 | 1.47 | +22.98% | +4.85% | Largest | 4th | 2008 | 3.89 | 1.50 |
| Smallest | 34th | 1993 | 2.48 | 0.96 | |||||
| Globe | 18.20 | 7.03 | +1.39% | -1.56% | Largest | 25th | 1979 | 19.32 | 7.46 |
| Smallest | 13th | 2011 | 16.88 | 6.52 | |||||
Data Source: National Snow and Ice Data Center (NSIDC). Period of record: 1979–2015 (37 years)

According to the National Snow and Ice Data Center (NSIDC), the Northern Hemisphere sea ice extent — which is measured from passive microwave instruments onboard NOAA satellites — averaged for February 2015 was 14.43 million square km (5.57 million square miles), 950,000 square km (370,000 square km), or 6.18 percent, below the 1981-2010 average. This was the third smallest February sea ice extent on record for the Arctic and the smallest since 2011. The 2015 February Arctic sea ice extent was 30,000 square km (11,600 square miles) larger than the record smallest February Arctic sea ice extent observed in 2005. Regionally, the Pacific side of the Arctic experienced much-below average sea ice during February, especially the Sea of Okhotsk and the Bering Sea. Sea ice was slightly below average across parts of the Atlantic sector, including the Barents Sea and the East Greenland Sea. A small region of above-average ice extent was located near Newfoundland and the Canadian Maritime Provinces, an area that experienced below-average temperatures during the second half of winter. For the month of February, the Arctic sea ice extent is decreasing at an average rate of 2.9 percent per decade.
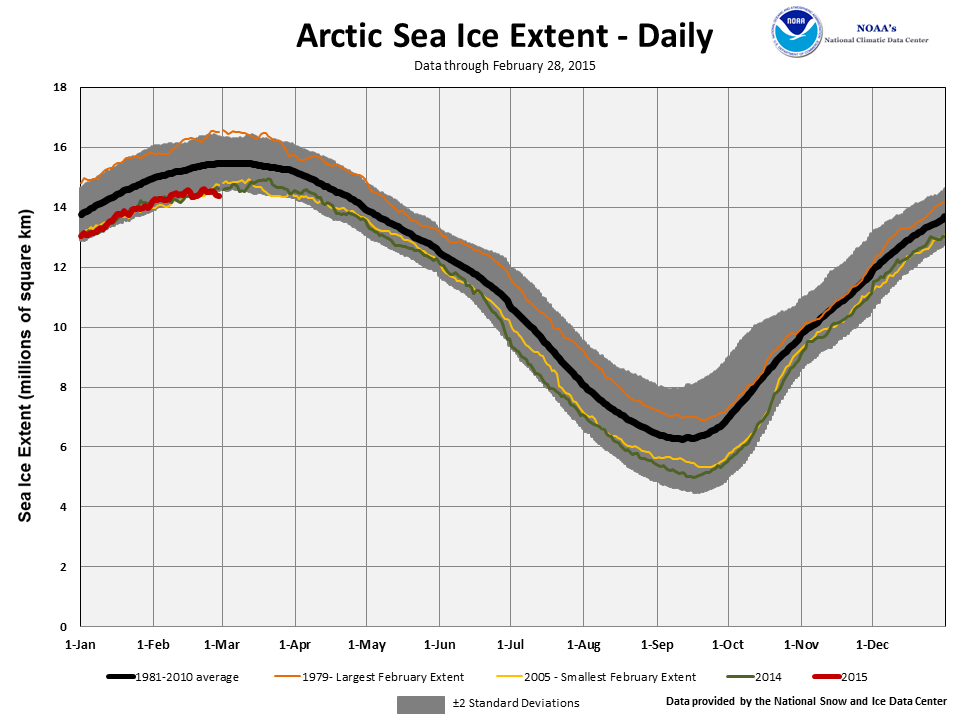
Arctic sea ice extent increased by 429,000 square km (165,600 square miles) during February, slightly less than average, with most of the ice growth occurring early in the month. The growth of the ice nearly stopped by the end of the month with the daily sea ice extent near record low levels. The Arctic sea ice extent typically reaches its annual maximum in mid-March, but unless a change in growth patterns emerges in early March it is likely that the 2015 annual maximum sea ice extent will approach a new record low.

The February 2015 Southern Hemisphere sea ice extent was 3.69 million square km (1.42 million square miles), 650,000 square km (250,000 square miles), or 21.38 percent, above the 1981-2010 average. This was the sixth largest February Antarctic sea ice extent on record but the smallest since 2012. Above-average sea ice was observed in the eastern Weddell Sea, where ice extended several hundred km farther north and east than what is typical this time of year. February Antarctic sea ice extent is increasing at an average rate of 4.9 percent per decade.

According to the NSIDC, the Antarctic sea ice reached its annual minimum extent on February 20th at 3.58 million square kilometers (1.38 million square miles). This was the fourth highest minimum ice extent on record for the Southern Hemisphere, trailing behind the annual minimum extents in 2008, 2013, and 2004. The annual minimum extent has varied greatly over the past few years, approaching record low levels in 2011 and record high levels in 2013.
When combining the Northern Hemisphere and Southern Hemisphere sea ice extents, the globally-averaged sea ice extent during February was 18.12 million square km (7.00 million square miles), 1.68 percent below the 1981-2010 average and the 11th smallest February global sea ice extent on record. Global sea ice extent during February is decreasing at an average rate of 1.6 percent per decade.
For further information on the Northern and Southern Hemisphere snow and ice conditions, please visit the NSIDC News page.