The data presented in this drought report are preliminary. Ranks, anomalies, and percent areas may change as more complete data are received and processed, but they will not be replaced on these pages.
|
Contents Of This Report: |

|
National Drought Overview
|
|
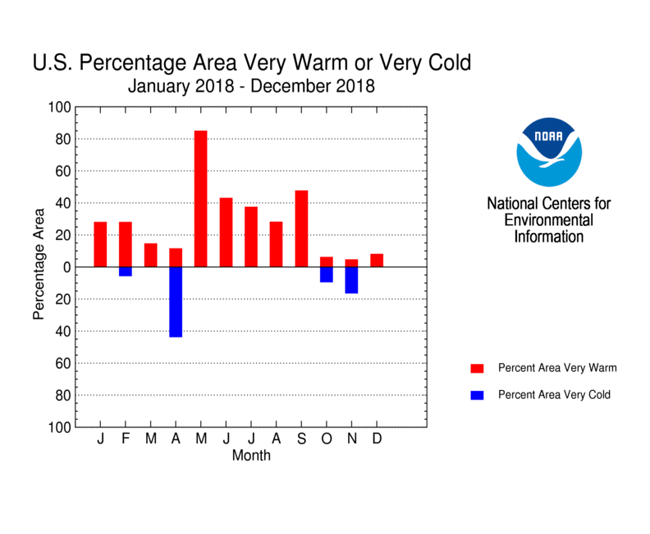
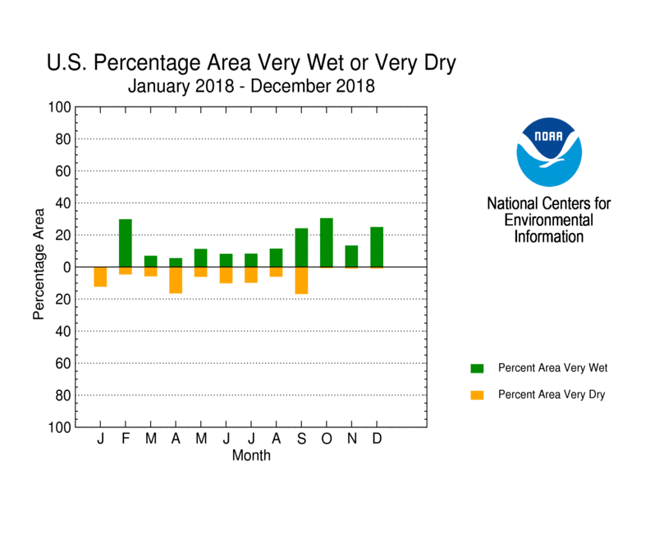
Percent area of the U.S. very warm, very cold, very wet, or very dry for January-December 2018. Very warm and very wet are defined as temperatures or precipitation in the upper tenth percentile of the historical record. Very cold and very dry are defined as temperatures or precipitation in the lowest tenth percentile of the historical record.
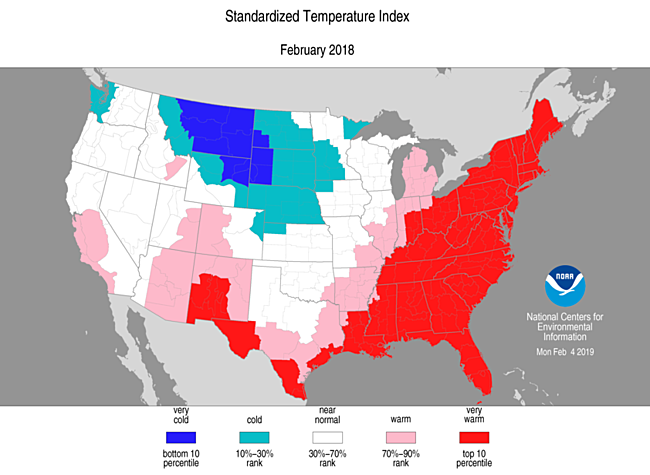
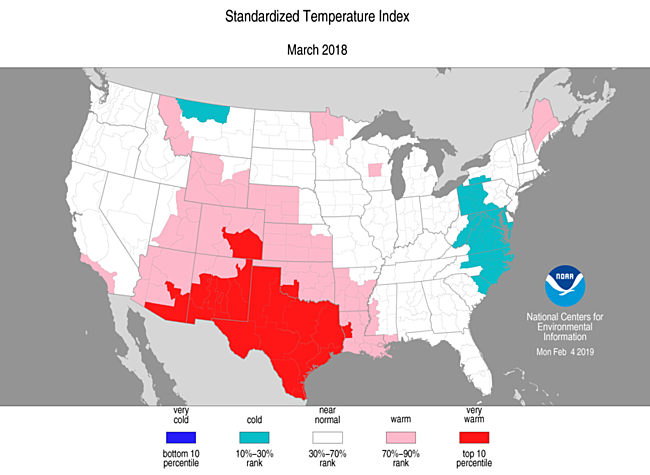
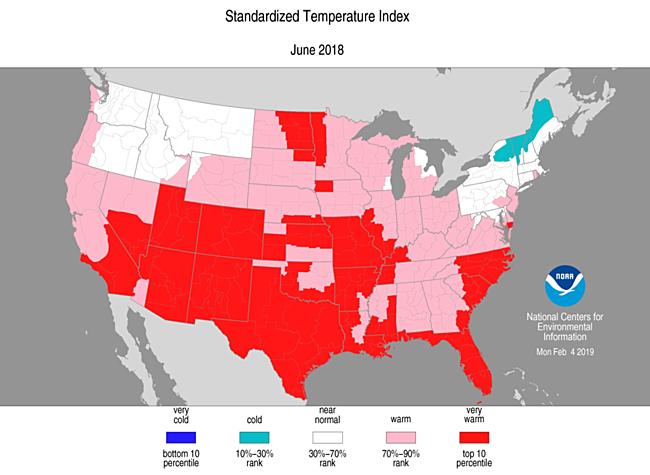
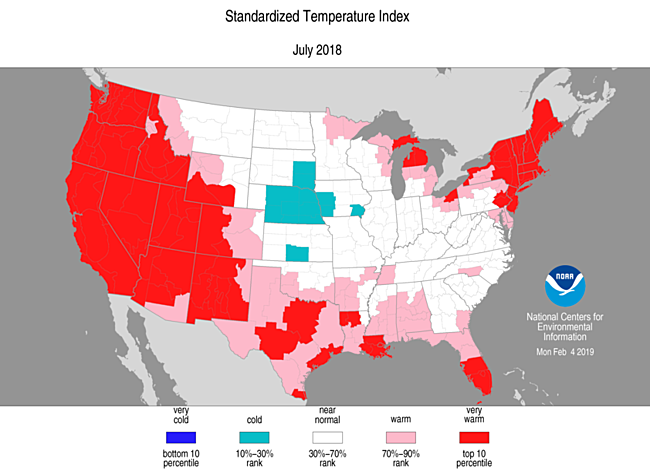
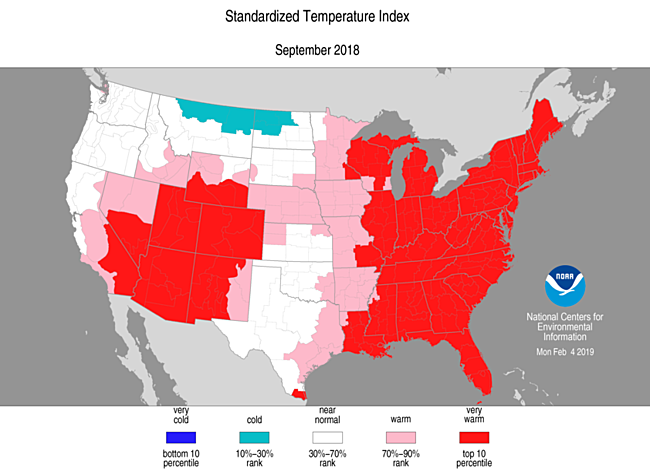
As usually happens, weather conditions varied across the country from month to month during 2018, but some national patterns are evident. About five percent or more of the continuous U.S. (CONUS) was very dry during each month from January through September, with ten percent or more very dry during January (12.1%), April (16.2%), and September (17.7%). Other parts of the country were wet during this period to counterbalance the dryness on a national scale. During October-December, unusually dry conditions were largely absent with unusually wet conditions dominating. Unusually warm temperatures dominated much of the country for the first nine months of the year, with at least ten percent of the CONUS very warm each month (standardized temperature anomaly maps for January, February, March, April, May, June, July, August, September, October, November, December). A fourth or more of the CONUS was very warm during January, February, and May through September, with about 85 percent very warm during May. Above-normal temperatures enhance evapotranspiration which worsens drought conditions, especially in the summer months.
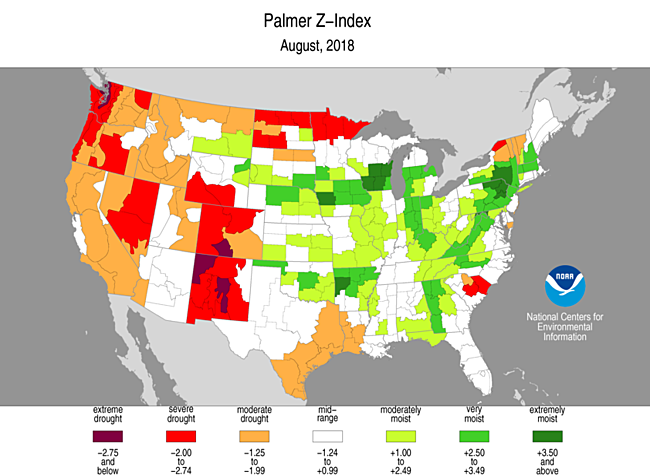
The Palmer Z Index incorporates moisture supply (precipitation) and moisture demand (evapotranspiration) to depict the total moisture status each month. The Palmer Z Index maps below show the monthly moisture status for each month in 2018:
 |
 |
 |
 |
 |
 |
 |
 |
 |
 |
 |
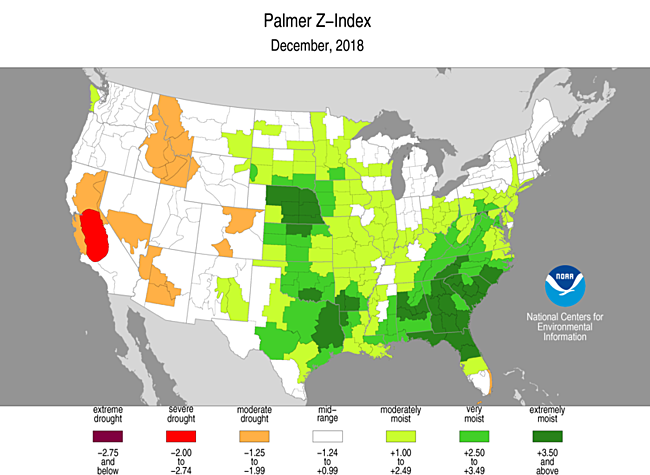 |

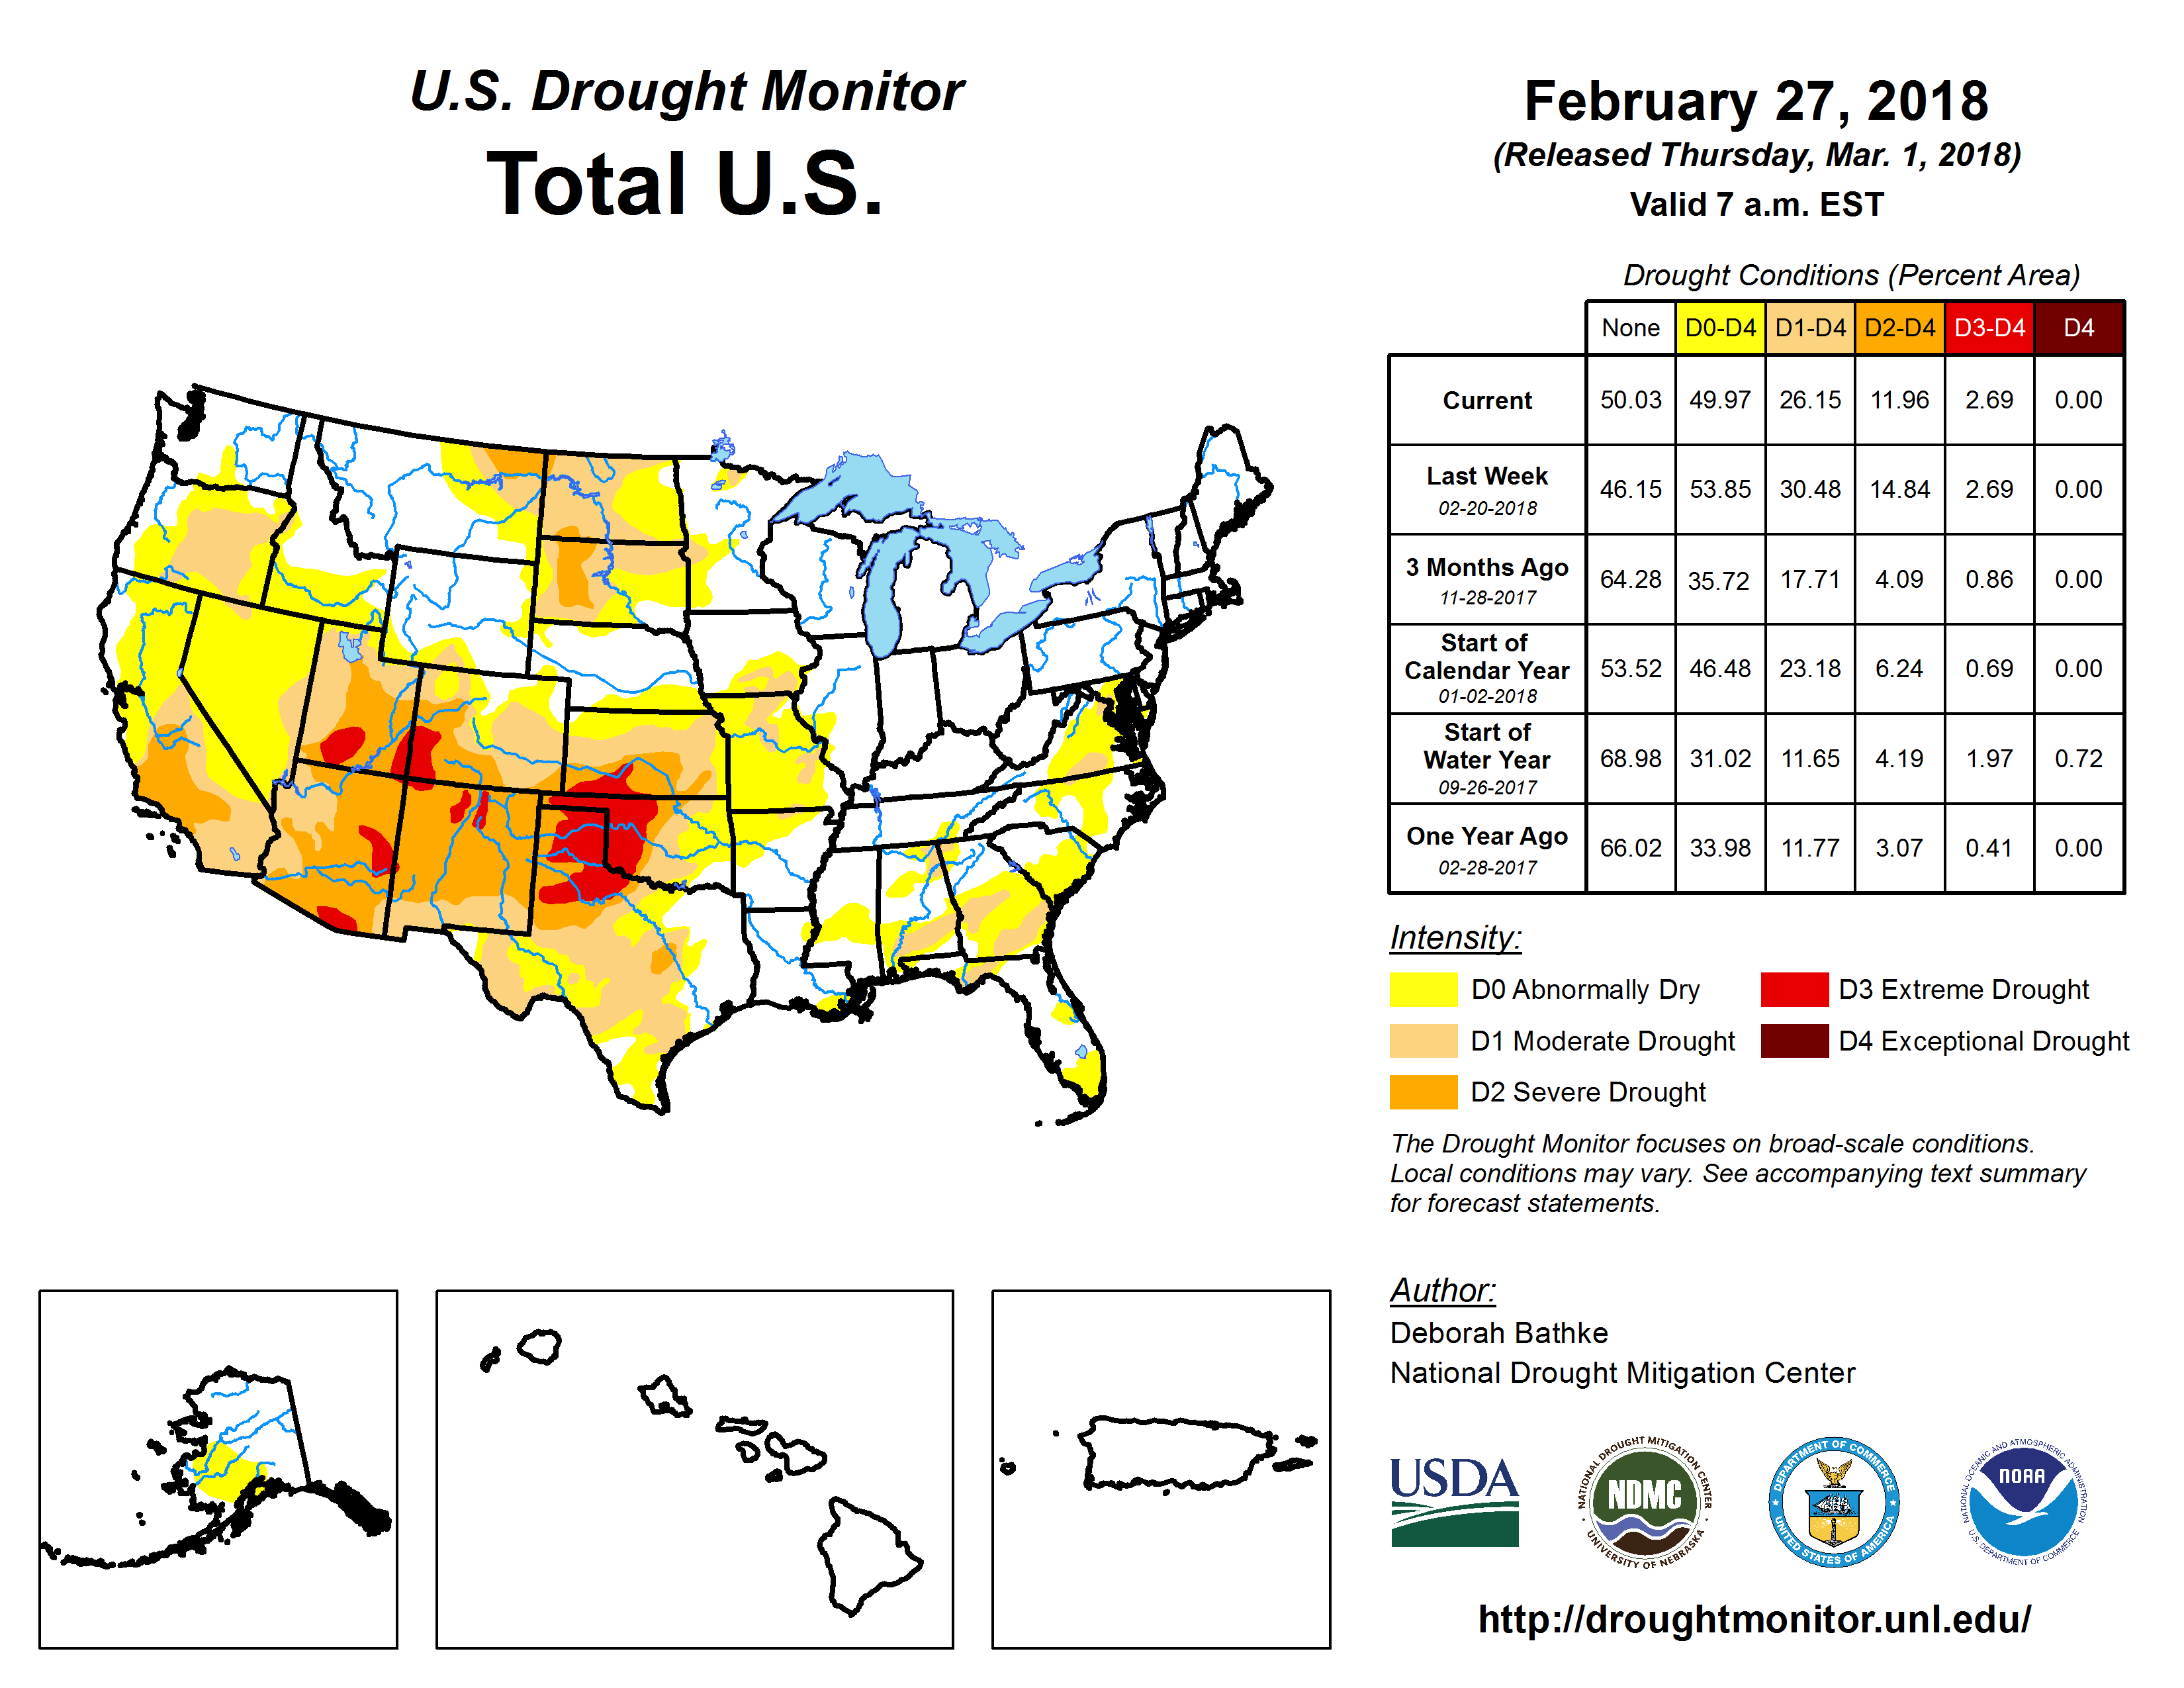
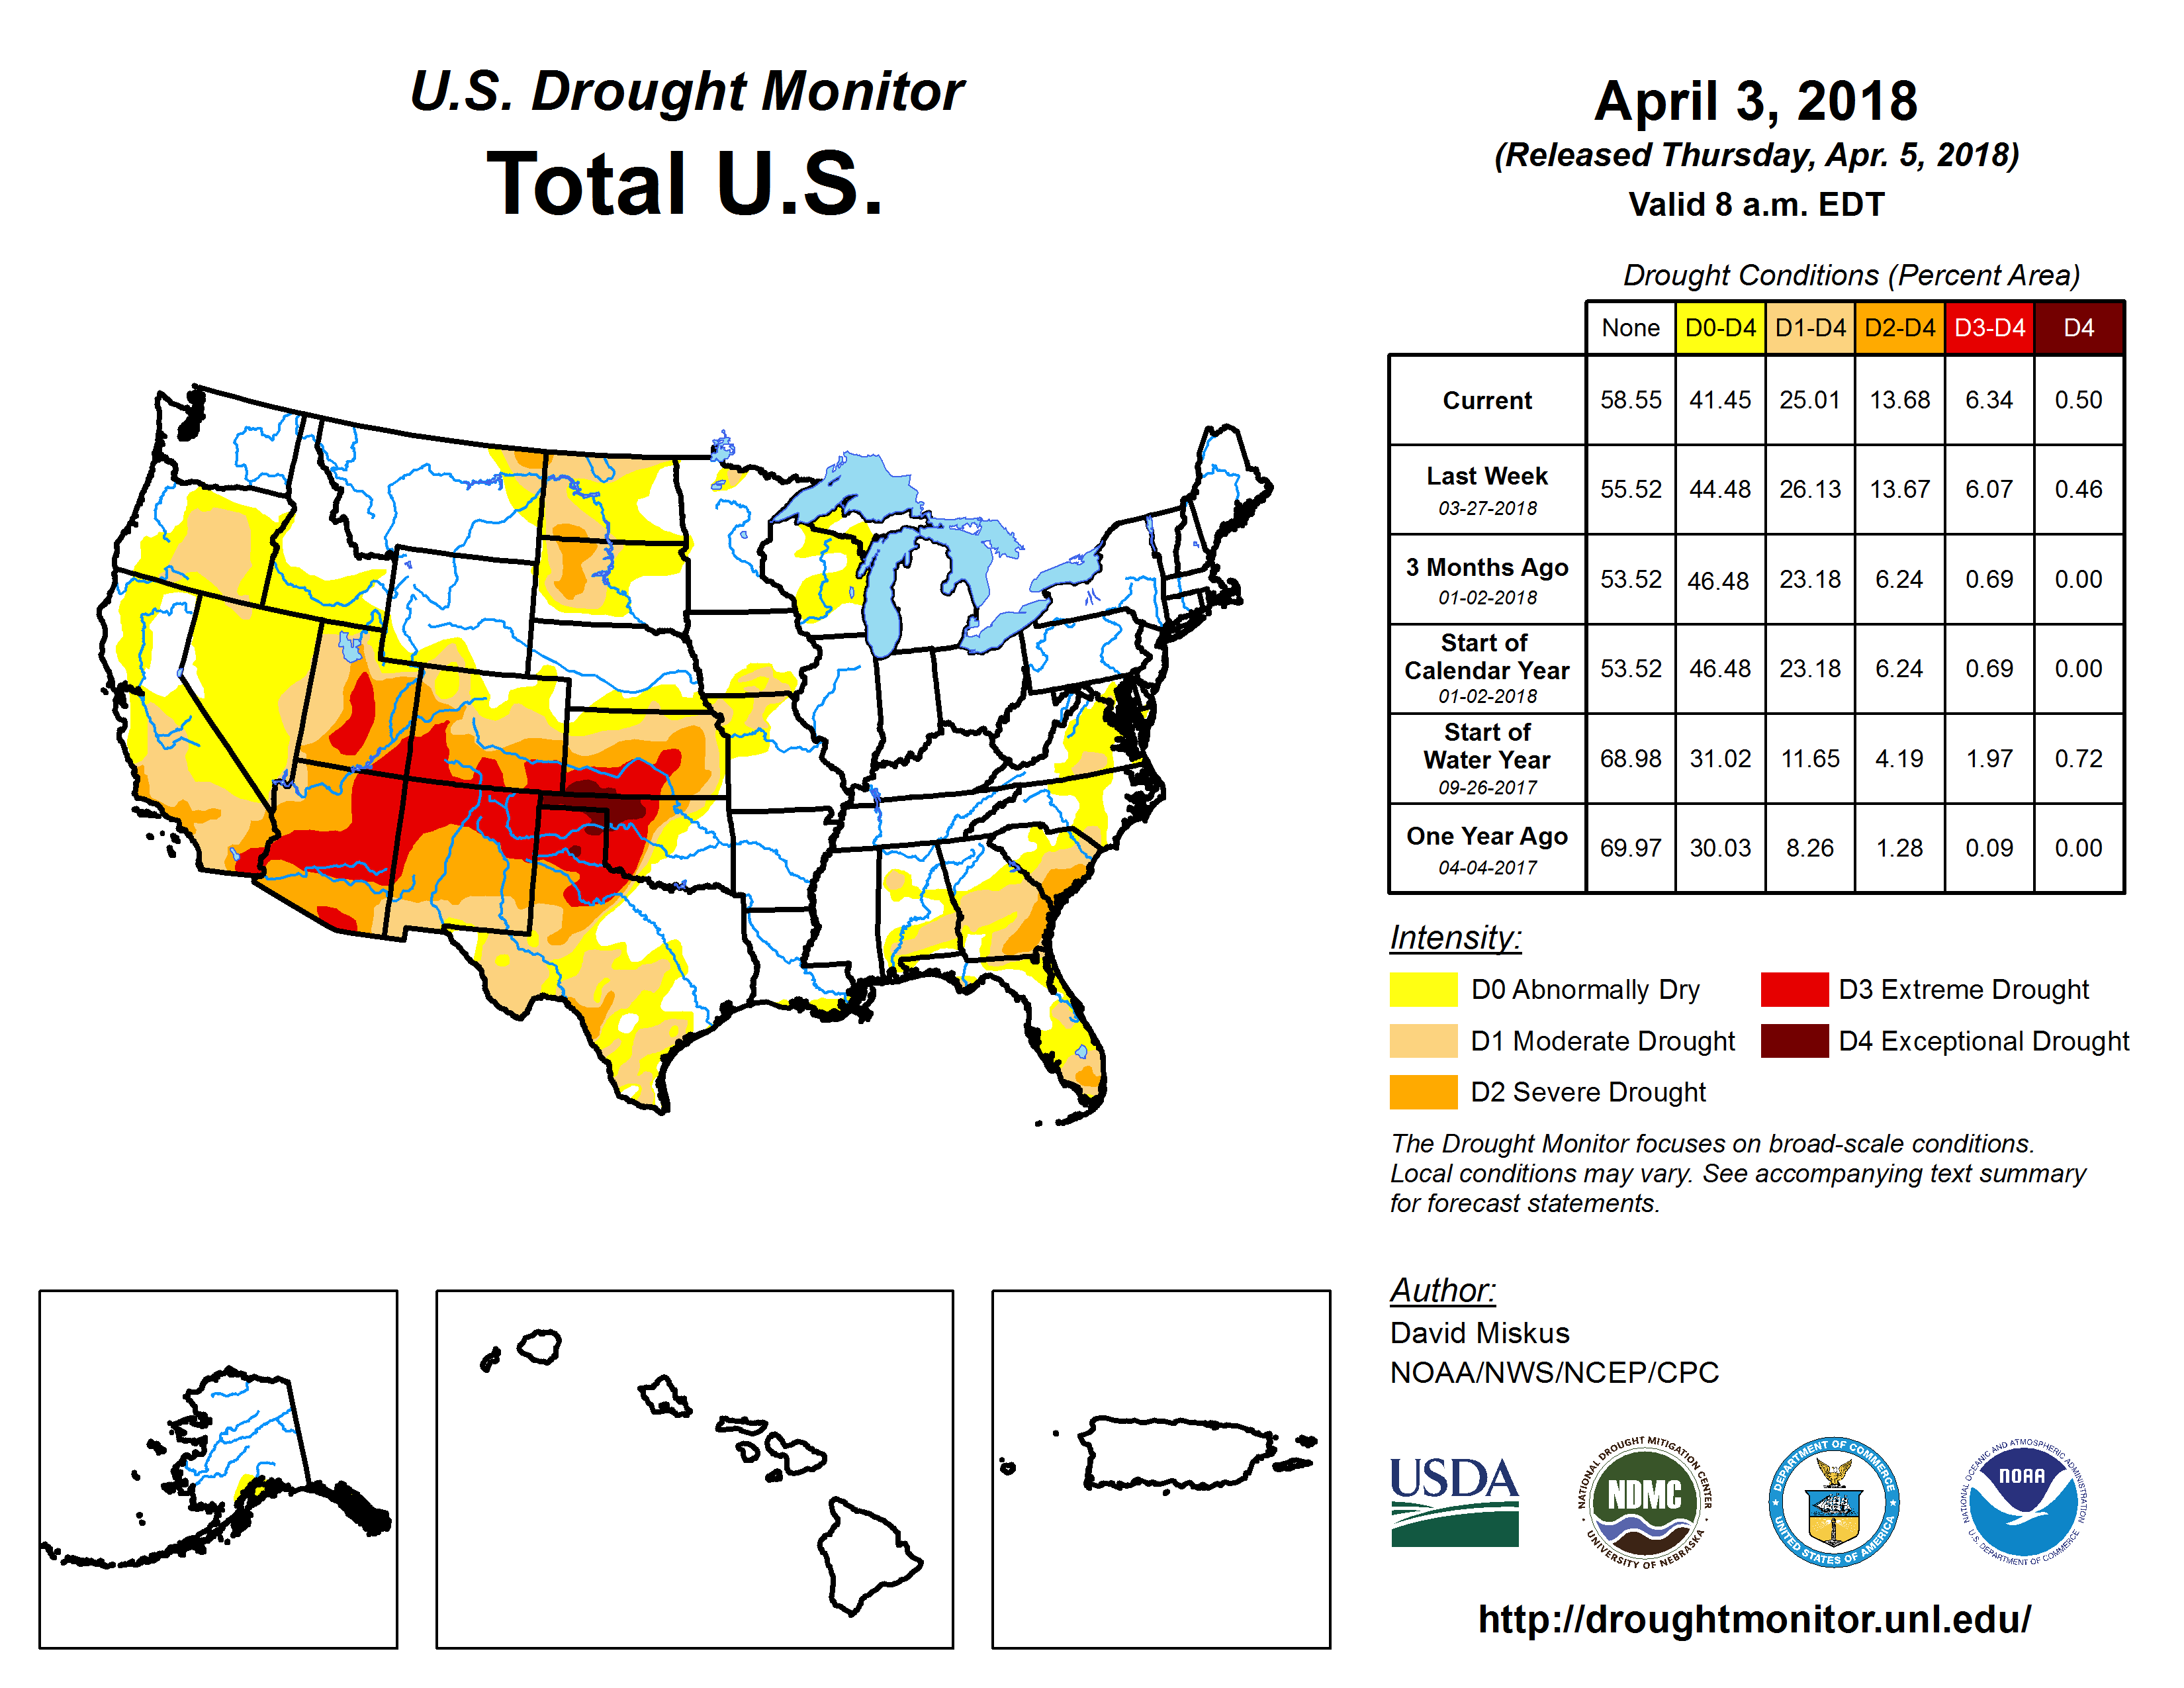
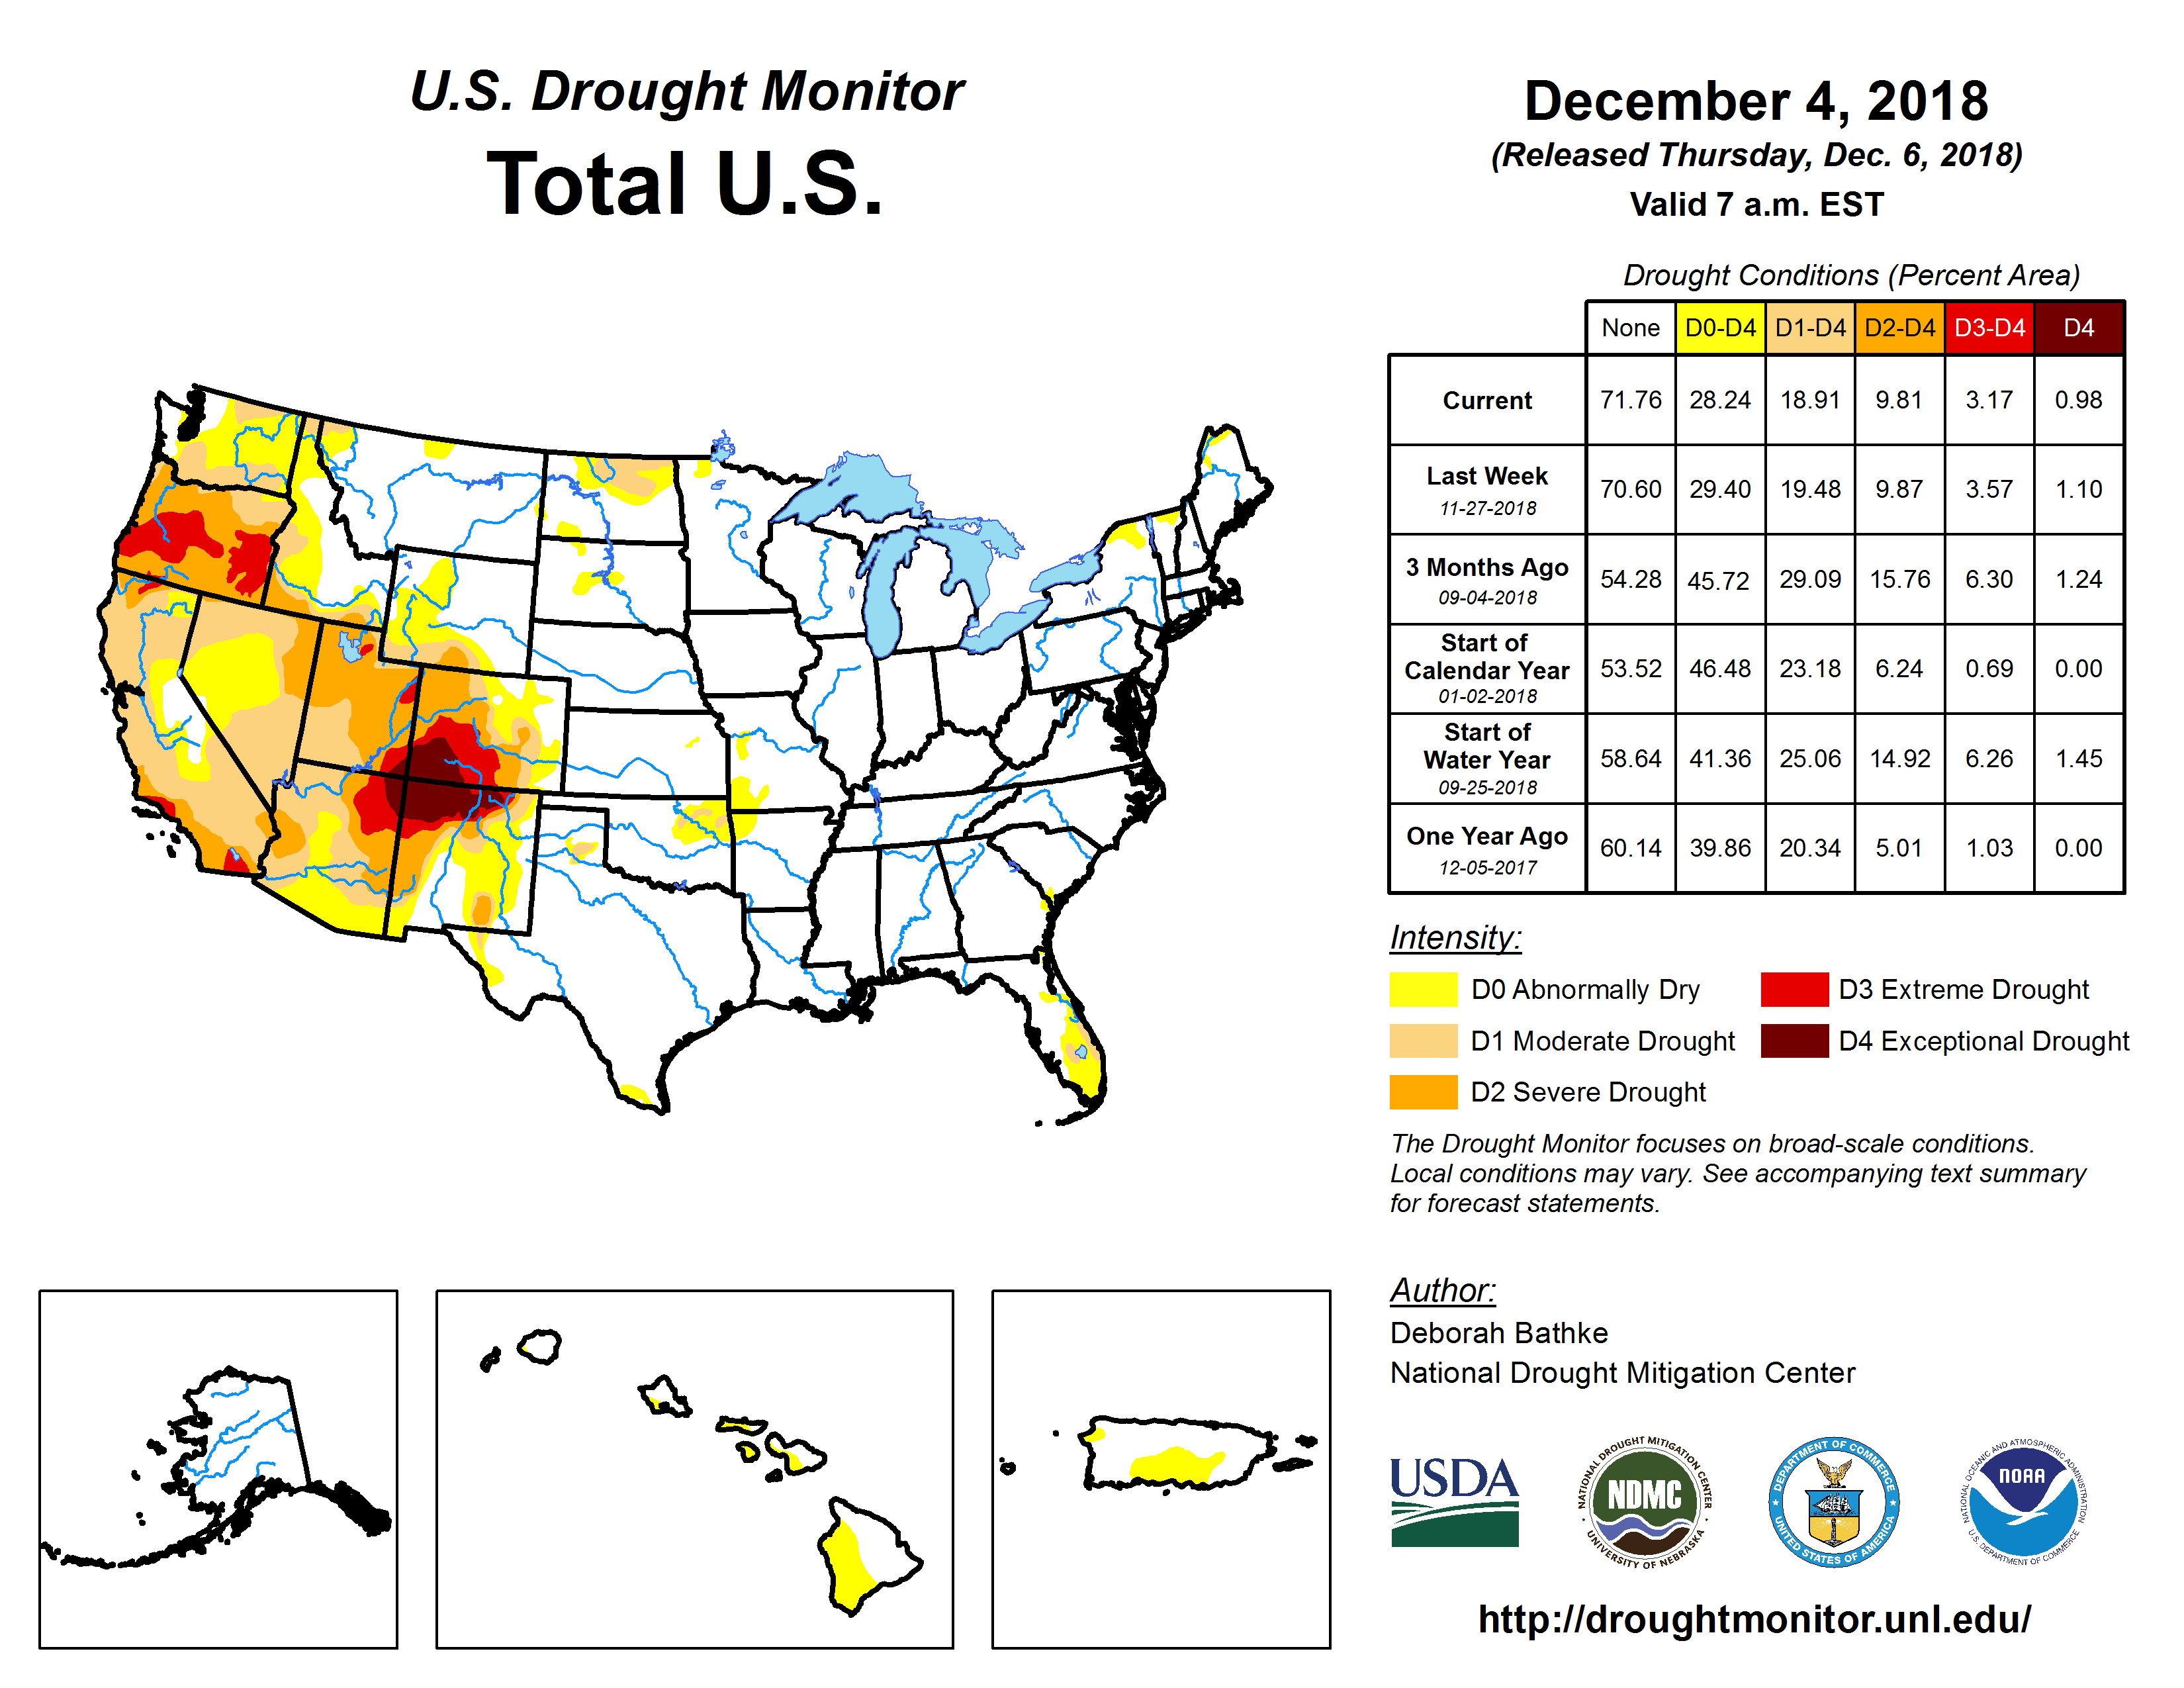
On a national scale, broadly speaking, during 2018 drought waned, then waxed, then waned again. The year began with drought in the Southwest, Plains, Mid-Mississippi Valley, South, and East Coast, covering about 27.7 percent of the CONUS according to U.S. Drought Monitor (USDM) statistics. With January dry, drought coverage increased to 38.4 percent of the CONUS (32.1 percent of the 50 States and Puerto Rico) by the end of January. But wet conditions during late winter and spring contracted drought to about 26.4 percent of the CONUS (22.1 percent of all of the U.S.) by the end of May. Drought in the East and Southeast had virtually disappeared, while the Southwest drought intensified. Dry and hot conditions during the summer expanded drought to about 34.3 percent of the CONUS by the end of August. Drought appeared in the Pacific Northwest and parts of New England, and continued in the Plains, Southwest, and Mid-Mississippi Valley. Wet conditions in the fall and early winter contracted the drought area to about 21.9 percent of the CONUS by the end of the year. Drought had contracted in the Plains, ended in the Mid-Mississippi Valley and New England, continued in the West, and appeared in southern Florida by the end of December.
| Palmer Drought Index* monthly statistics, which go back to the beginning of the 20th century, indicate that 24.7 percent of the CONUS was in moderate to extreme drought at the beginning of 2018. The percentage increased to 27.2 percent by the end of January, dropped a bit in February, but steadily increased over the spring and summer to peak at 39.4 percent by the end of August. The national drought area then contracted to 20.6 percent by the end of November, ending the year up a bit at 22.0 percent by the end of December. |
Percent area in drought of the CONUS or all of the U.S., based on the USDM and Palmer Drought Index, January-December 2018.
|

|
|
*This drought statistic is based on the Palmer Drought Index, a widely used measure of drought. The Palmer Drought Index uses numerical values derived from weather and climate data to classify moisture conditions throughout the contiguous United States and includes drought categories on a scale from mild to moderate, severe and extreme.
[top]
Regional Drought Overview
The year began with drought in several parts of the country. Wet conditions occurred east of the Rockies during several months, easing drought conditions from the Plains to East Coast, but the West was dry more than it was wet. Parts of the West began the year with drought, but other parts were abnormally dry or had near normal to wet conditions. As the year progressed, drought expanded or intensified in three general areas in the West: the Southwest, California-Nevada, and the Pacific Northwest.
Southwest:
|
|
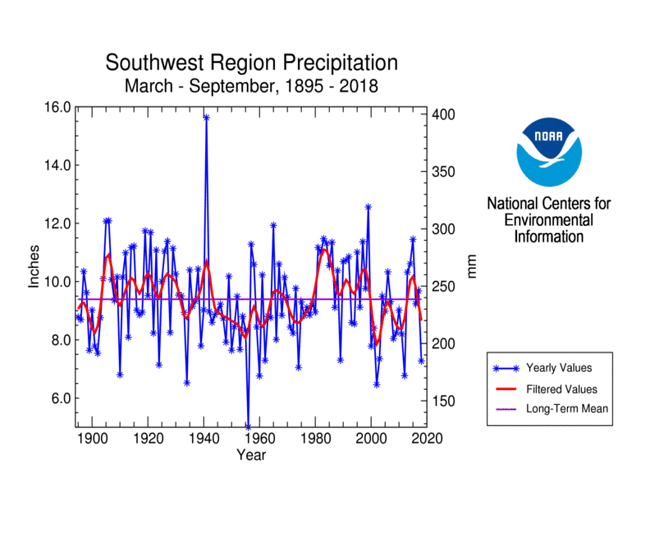
The Four Corners States began 2018 in drought, due to dry conditions which developed in late October 2017. Below-normal precipitation occurred in most months in 2018, with March-September being especially dry and unusually warm. The Southwest region experienced the warmest and ninth driest March-September in the 124-year record in 2018. If the dry conditions of late 2017 are included, the Southwest region experienced the third driest November-September. The unusual warmth of 2018 capped a marked warming trend in this region over the last 40 years.

|

|
Pacific Northwest:

|

|
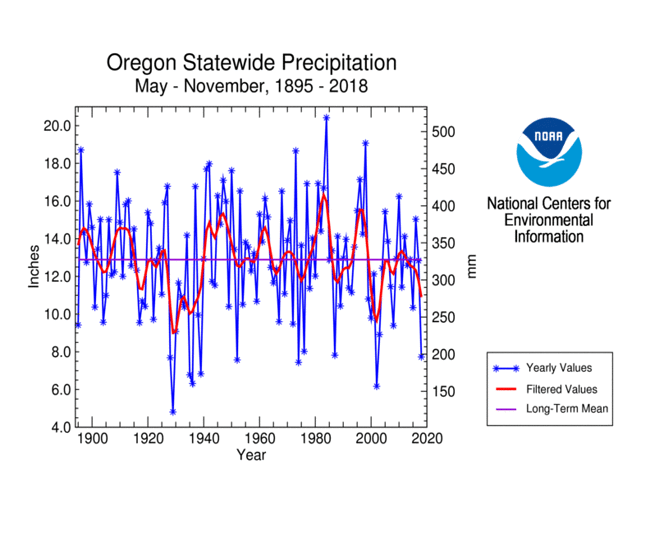
Unusually dry conditions occurred in the Pacific Northwest in January and February, but normal to wet conditions in March-April helped temper the development of drought at that time. Drier-than-normal conditions returned in late spring, summer, and fall, coupled with unusually warm temperatures, to expand drought as the year progressed. Oregon had the third driest May-September, ninth driest and eighth warmest May-November, and 13th driest year overall. Like the Southwest, Oregon has experienced a marked warming trend over the last 40 years.
California-Nevada:
Parts of the California-Nevada region experienced dry conditions during late winter (January-February) and parts of the fall (September-October). Precipitation occurred at other times during the year, especially in the northern to central sections. This helped relieve precipitation deficits that had built up over the last several years, except in the southern portions where drought persisted throughout 2018.
Southern Plains:

|

|
In 2018, the southern Plains were unusually dry during January and April-July, and unusually warmer than normal during most of March-July. Texas had the eleventh driest and sixth warmest April-July in the 1895-2018 record. Wet conditions during September-December virtually eliminated drought in the southern Plains by the end of the year.
Mid-Mississippi Valley:
Parts of the Mid-Mississippi Valley, especially Missouri, experienced drought during 2018. Drought was especially severe in southern Missouri at the beginning of the year. Wet conditions in late winter and early spring contracted drought, but dry conditions in late spring and early summer shifted the drought epicenter to northern Missouri. Late fall and early winter precipitation erased drought in the state by year's end.
Southern Florida:
Drought developed in southern Florida at the beginning of the year, reaching a peak in the spring. Rain in late spring and summer erased the drought, but dry conditions in the fall brought drought back by year's end.
Southeast Alaska:
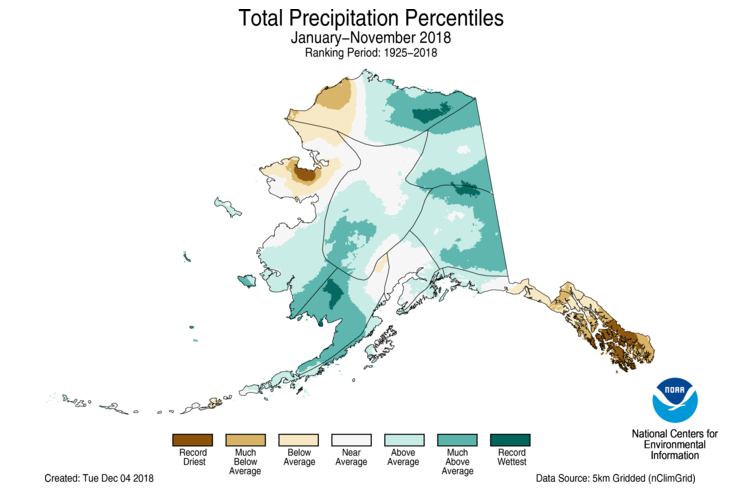
Dry conditions developed in the Alaska panhandle in late 2017, notably in November. Below-normal precipitation persisted for much of 2018, especially during the summer and fall. Record dryness occurred in parts of the southern panhandle (November 2017-October 2018, January-November 2018), with the year ending up record dry for the area. Drought developed in Alaska during the summer 2018 and persisted to the end of the year.
U.S.-Affiliated Pacific Islands:
Some U.S.-Affiliated Pacific Islands (USAPI) had an unusually wet year. These include Pohnpei in the Federated States of Micronesia (FSM), wettest in 67 years of record; Kwajalein in the Republic of the Marshall Islands (RMI), wettest in 66 years of record; Majuro (RMI), third wettest in 64 years of record; and Pago Pago in American Samoa, fourth wettest in 52 years of record. But certain months were dry — September-October 2018 was sixth driest at Kwajalein and seventh driest at Majuro; Nukuoro (FSM) had the third driest August-October in 35 years of record, fourth driest March-August, and third driest March-June; Ailinglapalap (RMI) had the fourth driest May-August in 34 years of record; Lukonor (FSM) had the second driest April-June in 34 years of record and fourth driest January-June. Lukonor also had the fourth driest year in 22 years of record (22 years with complete data).
[top]
Contacts & Questions