U.S. Drought Highlights:

- On the national scale, severe to extreme drought affected about 26 percent of the contiguous United States as of the end of November 2002
- moderate to extreme drought affected about 36 percent of the contiguous U.S.
- Short-term conditions improved across much of the western U.S. yet long-term deficits persist
- Short and long-term conditions continued to improve over the east coast
- Much of the central and southern Plains began to suffer from short-term drought
Please Note: The data presented in this drought report are preliminary. Ranks, anomalies, and percent areas may change as more complete data are received and processed.
National Overview
On the national scale,
- about 36 percent of the contiguous U.S. fell in the moderate to extreme drought categories (based on the Palmer Drought Index) at the end of November;
- severe to extreme drought affected about 26 percent of the contiguous United States as of the end of November 2002;
- this is the fourth consecutive month of decreasing areal coverage of drought
- the coverage of the current (November 1999-present) national-scale drought first peaked in August 2000 at about 36% of the contiguous U.S., which was as extensive as the major droughts of the last 40 years, but not as large as the "dust bowl" droughts of the 1930s and 1950s;
- the total drought area decreased to about 10 percent by November 2000, but has shown a general increasing trend for much of the period since then, reaching in July 2002 the peak it had first reached in August 2000 (see graph below left);
- on a broad scale, the last two decades were characterized by unusual wetness with short periods of extensive droughts, whereas the 1930s and 1950s were characterized by prolonged periods of extensive droughts with little wetness (see graph below right);
- although various parts of the U.S. have experienced unusually wet conditions during the last 37 months, little change occurred in the aggregate national wetness picture during much of this period;
- the percentage of the nation severely wet has remained below about eleven percent during this period, reaching about 5 percent by the end of November 2002 (see graph below left)
- a file containing the national monthly percent area severely dry and wet from 1900 to present is available;
- historical temperature, precipitation, and Palmer drought data from 1895 to present for climate divisions, states, and regions in the contiguous U.S. are available at the Climate Division: Temperature-Precipitation-Drought Data page in files having names that start with "drd964x" and ending with "txt" (without the quotes).
Regional Overview
November 2002 was wet across much of the southern and eastern portions of the country from southern Texas and Louisiana, throughout the Southeast, into portions of the Northeast. Beneficial rains fell in many of the drought areas, bringing short-term relief. However, long-term moisture deficits remained in parts of the east at the 24-month timescale.
The month was dry in large parts of the Northwest and Central U.S. Severe to extreme long-term drought continued from the west coast to the central Plains.
The November rainfall pattern was dry at the primary stations in Hawaii. In Puerto Rico, rainfall was below normal at many stations for November, the last 4 weeks, and the last 8 weeks. In Alaska, the precipitation pattern at the primary stations was mixed.
These overall conditions are evident in the following indicators:

- the runoff, evaporation, and soil moisture conditions as calculated by the National Weather Service,
- maps showing the percent of normal precipitation for airport stations for the current month and year-to-date,


- the percent of average precipitation map for early December for the SNOTEL stations in the western mountains provided by the USDA Water and Climate Center,
- the percent of average snow water content map for early December for the SNOTEL stations in the western mountains provided by the USDA Water and Climate Center,
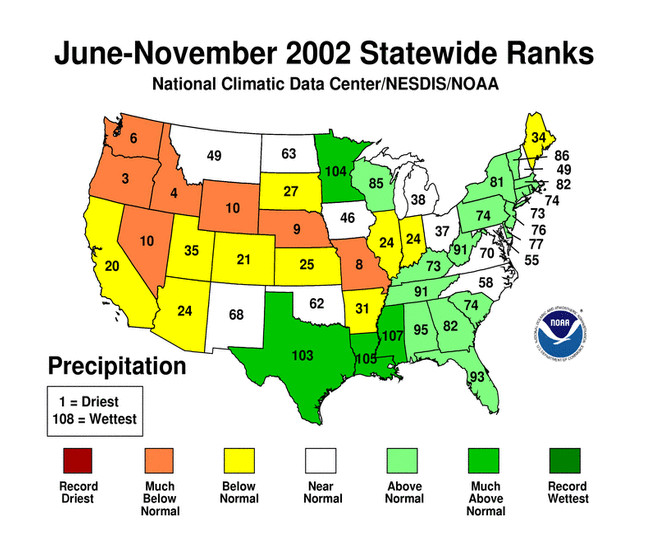
- the statewide precipitation ranks for current month (short-term) and 3-months, 6-months, year-to-date, and 12 months (longer-term),


- the short-term surface wetness anomaly map for November computed by the National Climatic Data Center from the Special Sensor Microwave Imager (SSMI), a polar orbiting satellite with global coverage, and


- the USGS November daily streamflow maps.
Western U.S. Drought
November 2002 marked the latest in a string of consecutive drier than normal months for the Northwest region. The regional dryness extends back through the normally dry summer season. For the West region, a series of Pacific fronts brought much needed rain and snow. This precipitation provided short-term relief from over 10 months of dryness which began in January, the middle of the last wet season.


Thirteen of the past 15 months have been drier than normal in the Southwest region. Despite the rains of September and October, significant long-term moisture deficits remain.
Although November 2002 brought near normal precipitation to the west and southwest, persistent moisture deficits during the previous ten months resulted in January through November being among the top ten driest for Oregon, California, Idaho, Nevada, Arizona, Utah, and Wyoming. Although portions of the state received normal to above normal precipitation, long-term moisture deficits were so severe that record dryness was still noted in Colorado (February-November).
A detailed review of drought conditions is available for the following regions and states:
- Pacific Northwest region
- West region
- Southwest region
- Arizona
- Colorado
- Idaho
- Montana
- Nevada
- New Mexico
- Oregon
- Utah
- Washington
- Wyoming
Central U.S. Drought
Below to much below normal precipitation in the central U.S. introduced new areas of severe to extreme short-term drought and expanded areas of moderate long-term drought.

A detailed discussion of drought conditions is available for the following regions and states:
Eastern U.S. Drought
November marked the third consecutive wet month for the Northeast and Southeast regions. The regional precipitation pattern for the Northeast has alternated between wet and dry for much of the last year. For the Southeast, the rains of the last three months have been a welcome change from the persistent dryness earlier in the year. Most of the east coast drought areas have experienced considerable improvement; in only a few areas of the Carolinas do significant long-term moisture deficits remain.
A detailed discussion of drought conditions is available for the following regions and states: