April Temperatures
 |
The graph to the left shows monthly mean temperature averaged across the contiguous United States based on long-term data from the U.S. Historical Climatology Network (USHCN). The value for 2003 is estimated from preliminary Climate Division data using the first difference approach. April 2003 ranked as the 38th warmest April in the 1895 to present record. The preliminary nationally averaged temperature was 52.7°F (11.5°C) which was 0.6°F (0.3°C) above the long-term mean. |
| The center of the U.S.
was generally warmer than average in April 2003 with 18 states
ranking in the above average temperature category. However, parts
of the Northeast and west coast were cooler than normal for April.
Maine
and California
ranked as 3rd and 10th coldest on record for the month
respectively. As can be seen in a map of divisional temperature (below right), significantly warmer than average temperatures occurred in divisions in Colorado, Wyoming and Ohio. Overall, however, April was not a month with many temperature extremes. The pattern of warmth and cold in the contiguous U.S. in April broadly corresponded with the mean 500mb height and anomalies chart. This shows that above normal 500mb heights extended across the central portion of the U.S., and into the Northeast. These were associated with the above average temperatures across the mid-section of the country, though the cool surface temperatures in the Northeast for April corresponded more to the trough in eastern and southeastern Candada. Below average 500mb heights existed across the western portion of the United States leading to the lower monthly average temperatures there. It was the 10th warmest April since reliable statewide records began in 1918 for Alaska , with anomalies of 3.4°F (1.9°C) above normal relative to the period 1971-2000. |
|
| Region | Rank |
|---|---|
| Northeast | 30th coldest / 80th warmest |
| East North Central | 64th coldest / 46th warmest |
| Central | 85th coldest / 25th warmest |
| Southeast | 58th coldest / 52nd warmest |
| West North Central | 91st coldest / 19th warmest |
| South | 84th coldest / 26th warmest |
| Southwest | 72nd coldest / 38th warmest |
| Northwest | 47th coldest / 63rd warmest |
| West | 18th coldest / 92nd warmest |
Temperature Departures
| The map below, based on over 500 airport stations, shows departures from the 1971-2000 normal temperatures for April 2003. In the lower 48 states, widespread positive departures (1.5-4.5°F [0.8-2.5°C]) occurred over much of the central U.S. However monthly anomalies of over 7.5°F [4.2°C] were recorded in Alaska. Cold anomalies in parts of the Great Lakes region, the Northeast and west coast averaged -1.5 to -6.0°F [-0.8 to -3.3°C]. An animation of daily temperature anomalies shows when the largest anomalies occurred throughout the month. |
| A new April minimum
daily temperature record was set in Negaunee Township, MI on April
6th when the low reached -9°F (-22.8°C) and on April 9th
a new record low maximum temperature of 46°F (7.8°C) was
set in Jackson MS, breaking the old record of 47°F
(8.3°C) set on April 12th, 1940. Numerous daily maximum temperature records were broken in April in Alaska and also in the northern Great Plains. A maximum temperature of 90°F (32.2°C) was reached in Bismarck, ND on April 13th. This is the earliest date that 90°F has been reached in Bismarck. The previous record was 92°F (33.3°C) on April 18th, 1987. At least two locations in Alaska set new all-time high temperature records for the month of April on April 26th - 76°F (24.4°C) was reached in Skagway, and maximum temperatures were 74°F (23.3°C) in Juneau. |
 |
| See NCDC's Monthly Extremes web-page for more records. |
February - April 2003
 |
The graph to the left shows mean temperature averaged across the contiguous United States based on long-term data from the U.S. Historical Climatology Network (USHCN). The value for February-April 2003 is estimated from preliminary Climate Division data using the first difference approach. February to April 2003 was marginally warmer than average and ranked as the 46th warmest such period in the 1895 to present record. The preliminary nationally averaged temperature for February-April was 43.3°F (6.3°C) which was 0.3°F (0.2° C) above the long-term mean. |
Twelve states averaged warmer than the long-term mean from February-April, and four Northeastern states were colder than average. Maine ranked as 8th coldest on record for the 3-month period, falling in the much colder than average category. |
 |
National Temperatures - May 2002-April 2003
 |
The graph to the left shows mean temperature averaged across the contiguous United States based on long-term data from the U.S. Historical Climatology Network (USHCN). May 2002-April 2003 ranked as the 17th warmest such period in the 1895 to present record. The preliminary nationally averaged temperature was 53.5°F (11.9°C) which was 0.7°F (0.4°C) above the long-term mean. |
| The western half of the contiguous U.S. was generally anomalously warm over the May 2002-April 2003 period with six states averaging much above normal. A further eight states were significantly above average temperature for the twelve months. The eastern U.S. was cooler with most states averaging near normal. Seven states were significantly cooler than normal and Maine ranked as 9th coldest May-April since 1895. |  |
April Precipitation
 |
The graph to the left is a time series depicting precipitation averaged across the contiguous U.S. Based upon preliminary precipitation data, April 2003 was slightly wetter than average, ranking 42nd wettest. |
| Many states
across the contiguous U.S. averaged wetter than the 109-year mean
for April 2003, with five states ranking as having much above
average wetness, and a further thirteen states which were
significantly wetter than the mean, including West
Virginia. One state (Texas)
received much below average precipitation while eight more states
were significantly drier than normal for April. For more details on drought across the country, please click to the U.S. drought page. |

|
| Puerto Rico also received heavy rains in April as
the trailing cold front from the system which later became Tropical Storm Ana moved across the island. At least 3 deaths were blamed on
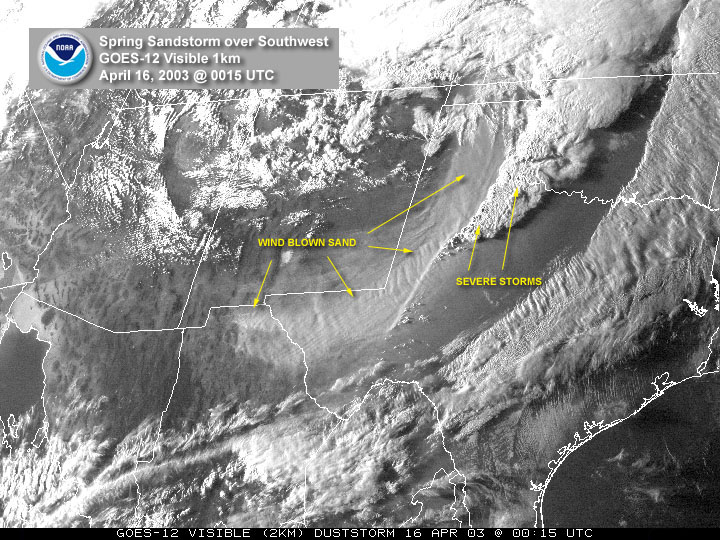
flooding in Puerto Rico resulting from the heavy rains. Significant storms occurred across parts of the country in April. Severe thunderstorms developed late on the 15th and produced 11 tornadoes in Texas and Oklahoma, along with numerous reports of damaging hail and strong winds. More severe weather including tornadoes affected the southern Plains eastward into parts of the Ohio and Tennessee Valley region during the 18th-20th Some precipitation fell as snow in April. More details of snowfall in April and the season so far can be found on the snow season page. |
| Region | Rank |
|---|---|
| Northeast | 29th driest/ 81st wettest |
| East North Central | 72nd driest/ 38th wettest |
| Central | 68th driest/ 42nd wettest |
| Southeast | 94th driest/ 16th wettest |
| West North Central | 74th driest/ 36th wettest |
| South | 17th driest/ 93rd wettest |
| Southwest | 44th driest/ 66th wettest |
| Northwest | 95th driest/ 15th wettest |
| West | 101st driest/ 9th wettest |
 |
The graph to the left is a time series depicting precipitation from March-April 2003 averaged across the Primary Corn and Soybean Belt. The growing season runs from March to September for corn and soybean and preliminary data indicate that precipitation was below average for the growing season as of the end of April 2003. |
Precipitation Departures
| The map below, based on more than 500 airport stations, shows April 2003 total precipitation as a percent of the 1971-2000 station normals. Above normal precipitation was recorded in West and Southeast. Much of the remainder of the contiguous U.S. was drier than normal including southern Alaska and Hawaii. |
| Some of the
precipitation which fell in April was in the form of snow. Click to
the snow page
for more details on April and the season-to-date. Many maximum monthly precipitation records were broken in April 2003, with cities such as Jackson, MS and Eureka, CA breaking previous monthly records by large margins (over an inch [25.4mm] for Jackson). At Willow Creek, CA a new rainfall record was set for the month of April 2003 with a total of 11.11 inches (282.2mm) of rain. This breaks the previous record of 10.47 inches (265.9mm) set in April of 1948. The normal rainfall total for April in Willow Creek is 3.16 inches(80.3mm). However, there was some record dryness in Hawaii. At Kahului airport, HI only 0.01 inches (0.25) of rain fell during the entire month, breaking the previous record of 0.06 inches (1.5mm) which occurred in April of 1990. The normal April rainfall total is 1.75 inches (44.5mm). For more records during April 2003, see NCDC's Extremes Page. |
 |
Past Three Months (February-April)
 |
The graph to the left
is a time series depicting precipitation averaged across the
contiguous U.S. Based upon preliminary precipitation data,
February-April 2003 was wetter than average, ranking 31st wettest
in the last 109 years. |
| Three states along the eastern seaboard received much above average precipitation over February-April 2003, and Colorado in the West also ranked in the top ten wettest such periods. Virginia ranked as 3rd wettest February to April on record. Twenty three other states were significantly wetter than average. Eleven states ranked slightly drier than average for the three months, predominantly in the South and around the Great Lakes. Only ten states ranked as near the long-term mean for February-April 2003. Spring precipitation, especially in the West, helped improve drought conditions, though long-term drought remains for many western areas. See NCDC's drought pages for more information on U.S. drought. | 
|
National Precipitation - May 2002-April 2003
 |
The graph to the left is a time series depicting precipitation averaged across the contiguous U.S. Based upon preliminary precipitation data, May 2002-April 2003 was near average, ranking 53rd driest in the last 108 such periods. |
| Moderate dryness occurred across most of the western half of the contiguous U.S. over the last 12 months with contrasting wetness dominating the Southeast and East (except Maine and New Hampshire). The pattern of state-averaged annual precipitation can be seen in the map to the right. Extreme dryness across the West through much of 2002 was moderated by near normal precipitation during the spring of 2003. More information on drought analysis for the U.S. can be found on NCDC's Drought Pages. |  |