National
Temperatures

larger
image
|
The graph to the left
shows monthly mean temperature averaged across the contiguous
United States based on long-term data from the U.S. Historical
Climatology Network (USHCN). The value for
2002 is estimated from preliminary Climate Division data using the
first difference approach. March 2002 ranked as the 33rd coldest March in the
1895 to present record. The preliminary nationally averaged
temperature was 40.5° F (4.7° C) which was 1.8° F
(1.0° C) below the long-term mean. The March temperature values
from 1895 through 2002 are available. |
| March 2002 marks the
first time since March 2001 that temperatures in the contigous
US averaged below normal, though March is characterized as
displaying large interannual variability throughout the 108-year
record.
The Mean 500mb
Height and Anomalies chart shows substantial negative height
anomalies across the north central plains, corresponding to below
average temperatures. Positive height anomalies existed along the
east coast and over Alaska. These were associated with warmer than
average temperatures in western Alaska and slightly above average
temperatures in several eastern states.
A more detailed analysis
including how statewide and regionwide temperatures compare to
other years is available.
|

larger
image
|
Temperature Departures
| The map to the right,
based on over 500 airport stations, shows departures from the
1971-2000 normal temperatures for March 2002. Warmer than average
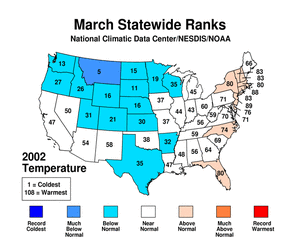
temperatures are limited to the Atlantic coast with the largest
positive departures in the contiguous U.S. (greater than 1.8° F
[1° C]) occurring in the New York City region, eastern North
Carolina and Florida. Negative temperature anomalies were evident
across the remainder of the contiguous U.S, as well as Hawaii and
eastern Alaska. The most significant negative departures occurred
in the Northern Plains where temperatures were colder than average
by more than 7.2°F (5.0°C). |

larger
image
|

larger
image
|
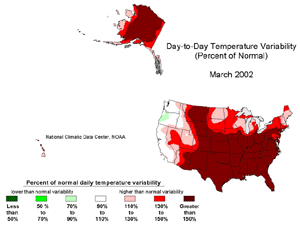
The day-to-day
variability of daily mean temperature was up to 150% of normal over
most of the contiguous U.S. in March. This is associated with a
series of cold outbreaks moving south and east across the central
plains during the month, as can be seen in an animated map of daily temperature
anomalies. |
National Precipitation

larger
image
|
The graph to the left
is a time series depicting precipitation averaged across the
contiguous U.S. Based upon preliminary precipitation data, March
2002 was slightly above average, ranking 35th wettest. However,
there was considerable regional variability in precipitation across
the country. States in the West and Southwest regions continued to
receive less rainfall than average this month, while states from
Texas to New Hampshire were wetter or much wetter than
average. |
Precipitation Anomalies
| The map to the right,
based on more than 500 airport stations, shows March 2002 total
precipitation as a percent of the 1971-2000 station normals. Above
normal precipitation generally occurred from Texas to New
Hampshire, with more than 180% of normal precipitation falling in
some locations. The rest of the country was mostly dry, including,
most notably, southern Californa and the Southwest, Florida,
southern Texas, and the Central Plains. Alaska was also mostly dry
and Hawaii and Puerto Rico received slightly below normal
precipitation for the month. |

larger
image
|
National
Snow Cover
Snow cover across the
country generally decreased throughout the month however, there were some
significant snow storms in parts of the country, including
Minnesota and Michigan (see image below).
| The map to the right
shows snow cover in the East North Central region of the US on
March 15th after a storm left portions of Minnesota, Wisconsin and
Michigan's Upper Peninsula blanketed in snow. Areas of Minnesota
received up to 18 inches (45 cm) of snow. Anchorage, Alaska also
received record
snowfall in March. Over 28 inches (71 cm) of snow fell in
Anchorage in a 24-hour period between March 16th and 17th. |

larger
image
|

 NOAA's National Centers for Environmental Information


