
 Flooding in Central Europe
|
Global
Hazards and Significant Events
August
2002
Torrential rains brought severe flooding to
central Europe during August 2002, with some of the worst flooding
in more than a century observed across parts of Germany, the Czech
Republic, the Slovak Republic and Hungary. Additional
information on flooding in Europe can be found
below.
|

Nearly half a million people in central Vietnam suffered from
water shortages caused by two consecutive months of dry weather.
The recent drought has
affected around 84,000 hectares (207,500 acres) of rice fields
across the central part of the country.

larger
image
|
Monsoon rainfall in
India remained light and intermittent during June-August 2002, with
heavier rains restricted to the northeast part of the country. In
the southeastern state of Andhra Pradesh, more than 75 percent of
the districts were declared drought affected. Drought in India is
reportedly the
worst since 1987 (World Vision). |
| Temperatures exceeding
38°C (100°F) during the
first week of the month resulted in 9 deaths across southern
Egypt. Normal daily maximum temperatures frequently exceed
35°C (95°F) during August in north Africa, although above
average temperatures have persisted across the region since July
2002. |

larger
image
|
The UN Food and Agriculture Organization reported that nearly 13
million people in southern Africa were in need of emergency food
aid. The southern African nations of Zimbabwe, Zambia, Malawi,
Mozambique, Lesotho and Swaziland experienced two consecutive poor
cereal harvests, due in part to a prolonged dry spell.

larger
image
|
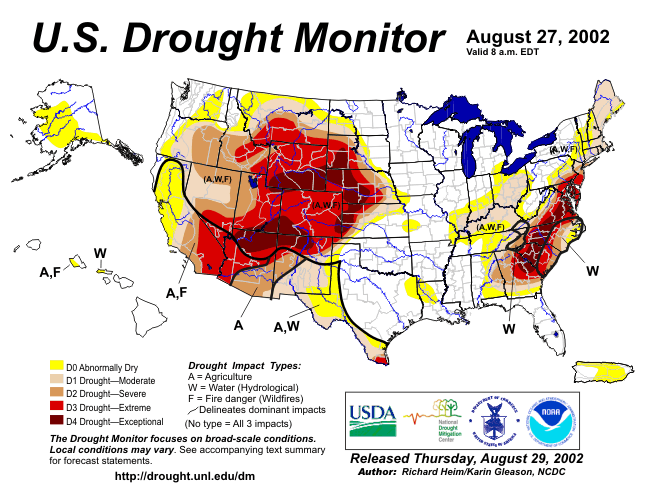
During August,
severe to
exceptional drought continued across parts of the western half
of the United States as well as the Southeast. However, beneficial
rains fell across piedmont and coastal areas of the Carolinas
northward into southern New England during the 26-29th. Detailed
U.S.
drought analysis is available for June-August. |

larger
image
|
Wildfires continued to
burn across parts of the western U.S. The largest wildfire in
August was located in
southern Oregon. The lightning-induced Biscuit fire, located
about 26 miles southwest of Grant's Pass, burned over 500,000 acres
(200,000 hectares) and was the largest fire in Oregon history
(NIFC). Additional information on wildfires in the U.S. is
available from the Wildfire Season Summary |
| Severe rainfall
deficiencies continued during June-August 2002 across parts of
Australia, as drought affected much of New South Wales, northern
and western Victoria, eastern South Australia and southwestern
Western Australia. It was the third driest austral winter
(June-August) since 1890 in Western Australia and the fourth driest
in New South Wales. Some locations in New South Wales and Western
Australia recorded the driest April to August since 1900.
Additional information is available from the Australian Bureau of
Meteorology's
drought statement. |

larger
image
|


larger
image
|
A slow moving storm
system brought torrential rainfall to parts of Germany, Austria,
the Czech Republic, Romania, Bulgaria and eastward across southern
Russia during early August resulting in over 100 deaths and damage
estimated to be over $20 billion (USD) (Associated Press). In
Austria, flooding occurred across the Upper and Lower provinces
during August 5-7. The most severely affected region was the
northern Waldviertel area of Lower Austria where the river Kamp
reached its highest level since records began in 1896 (Associated
Press). Rainfall across the mountainous terrain near the
German-Czech border locally exceeded 10 inches during the
11th-13th. In the German town of Zinnwald, rainfall during this
48-hour period was 397 mm (15.63 inches) (Czech Hydrometeorological
Institute). |
| The satellite image to
the right is a comparison picture of the Elbe River in Germany
before and after the heavy rainfall. |

European
Flooding
|
 larger
image
larger
image
|
Widespread flooding
affected hundreds of thousands of people across central Europe, as
numerous rivers rose above flood stage. The Vltava River burst its
banks on the 13th, with river levels at Prague surpassing the
record previously set in 1890. In Germany, the Elbe River brought
the worst flooding in nearly 150 years to the city of Dresden
(Reuters). Flooding continued along the Elbe River
and its tributaries during the week of the 19th. |
| On August 5th, showers
and thunderstorms developed along a frontal zone and affected much
of Korea. Up to 400 mm (15.8 inches) of rain fell across central
South Korea in less than 24 hours. Over 5,000 houses were flooded
leaving over 19,000 people homeless, mostly in the capital city of
Seoul (Associated Press/OCHA). |

larger
image
|
Thunderstorms brought heavy rain and flash flooding to parts of
Golestan, Khorasan and Semnan provinces in northeastern Iran on the
10th. The flooding cut road links between the affected areas,
washed away numerous bridges and caused at least 35 deaths
(OCHA/CIP report).
In Tajikstan, a dam in the Pamir mountains in the eastern part
of the country broke on the 7th, flooding the village of Dasht and
killing at least 24 people (Associated Press). The dam collapsed as
a result of a mudslide due to recent heavy rainfall.
In Vietnam, heavy rains during the 15th-17th caused flooding
across northern areas of the country, killing 26 people (Associated
Press). In Hanoi, high water levels along the Hong River inundated
more than 15,000 homes.
 larger
image
larger
image
|
Flooding along the
Mekong River in Cambodia displaced nearly 450,000 people and caused
14 deaths (OCHA). On August 25th, the Cambodian Prime Minister
declared a "disaster situation" for the country. |
| Flooding in the
Yangtze valley of China threatened Dongting Lake, located in Hunan
province in eastern China. Nearly 900,000 people worked to keep the
swollen lake from bursting its banks as floodwaters from the
Yangtze River brought the lake to dangerously high levels
(Reuters). |

larger
image
|
In eastern Nepal, heavy monsoon rains swept through a
mountainous village causing a landslide that resulted in up to 65
fatalities. Seasonal flooding across South Asia (Nepal, India and
Bangladesh) has been responsible for over 1,000 deaths since the
rainy season began in June (Associated Press).
| In the United States,
rain and thunderstorms affected parts of eastern Iowa, southern
Wisconsin and northern Illinois during the 21st and 22nd, where
locally 127-254 mm (5-10 inches) of rain fell. Flooding was
reported across the region, including the Chicago, IL metropolitan
area. |

larger
image
|


Radar
Animation
Courtesy of UCAR
|
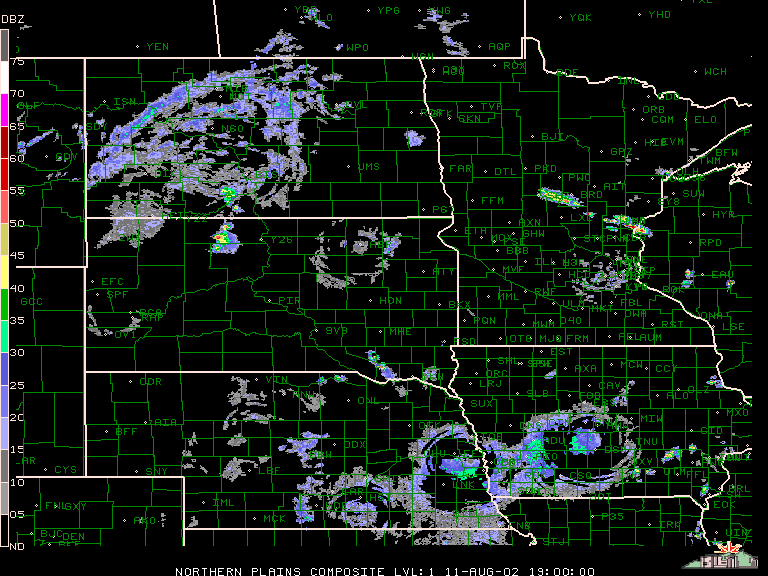
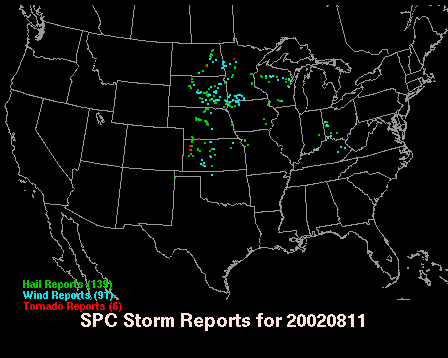
Severe thunderstorms
erupted across the northern plains during the afternoon of the 11th
as a frontal system cut across the Dakotas. There were numerous
reports
of large hail and damaging winds across the region, and winds
gusted to 124km/hr (77 mph or 67 knots) at the Sioux Falls, SD
airport as the storms pushed through. A tornado also destroyed farm
buildings near Medina, ND. Severe thunderstorms affected this same
region on the 16th.
Additional information on heavy rain and severe weather events in
the U.S. is available from the National
Precipitation page. |
In Algeria, severe thunderstorms during the 21st-28th were
responsible for at least 28 deaths (Associated Press).


larger
image
|
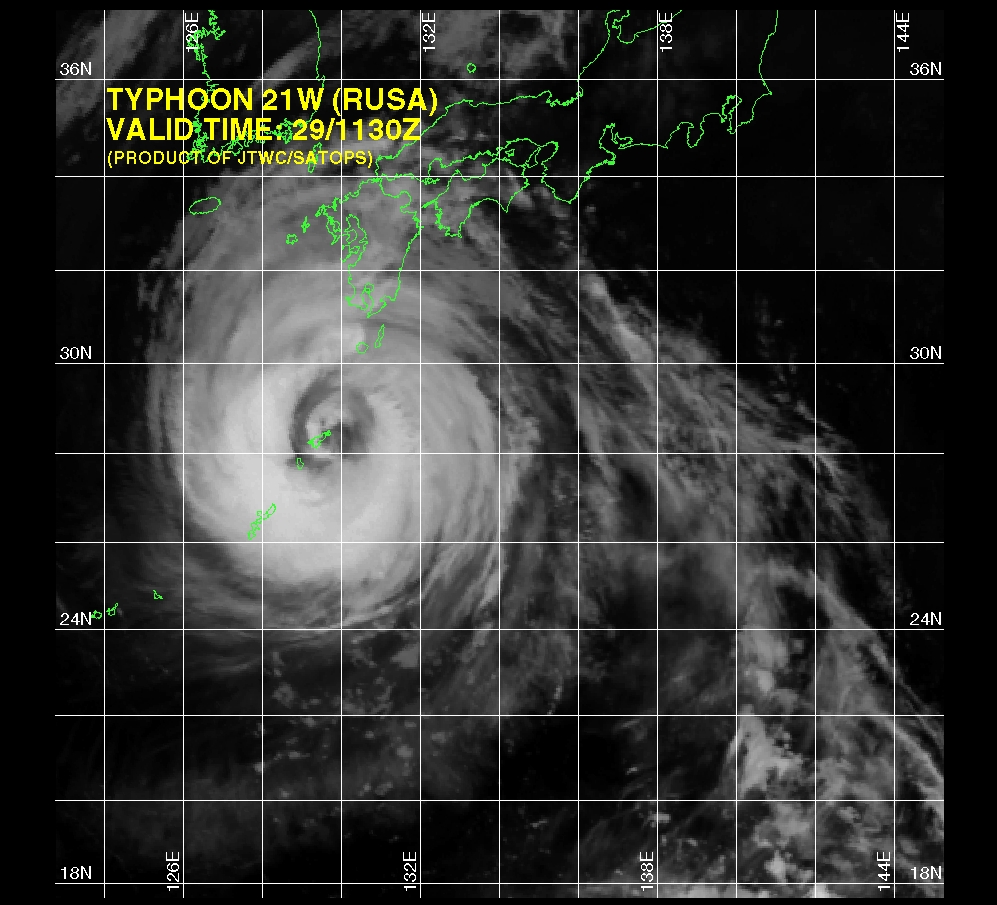
Typhoon Rusa developed in the
western Pacific Ocean on the 22nd and became a typhoon by the 24th.
Rusa was located near the Japanese island of Amami O Shima on the
29th with maximum sustained winds near 150 km/hr (~80 knots or 90
mph). |

larger
image
|
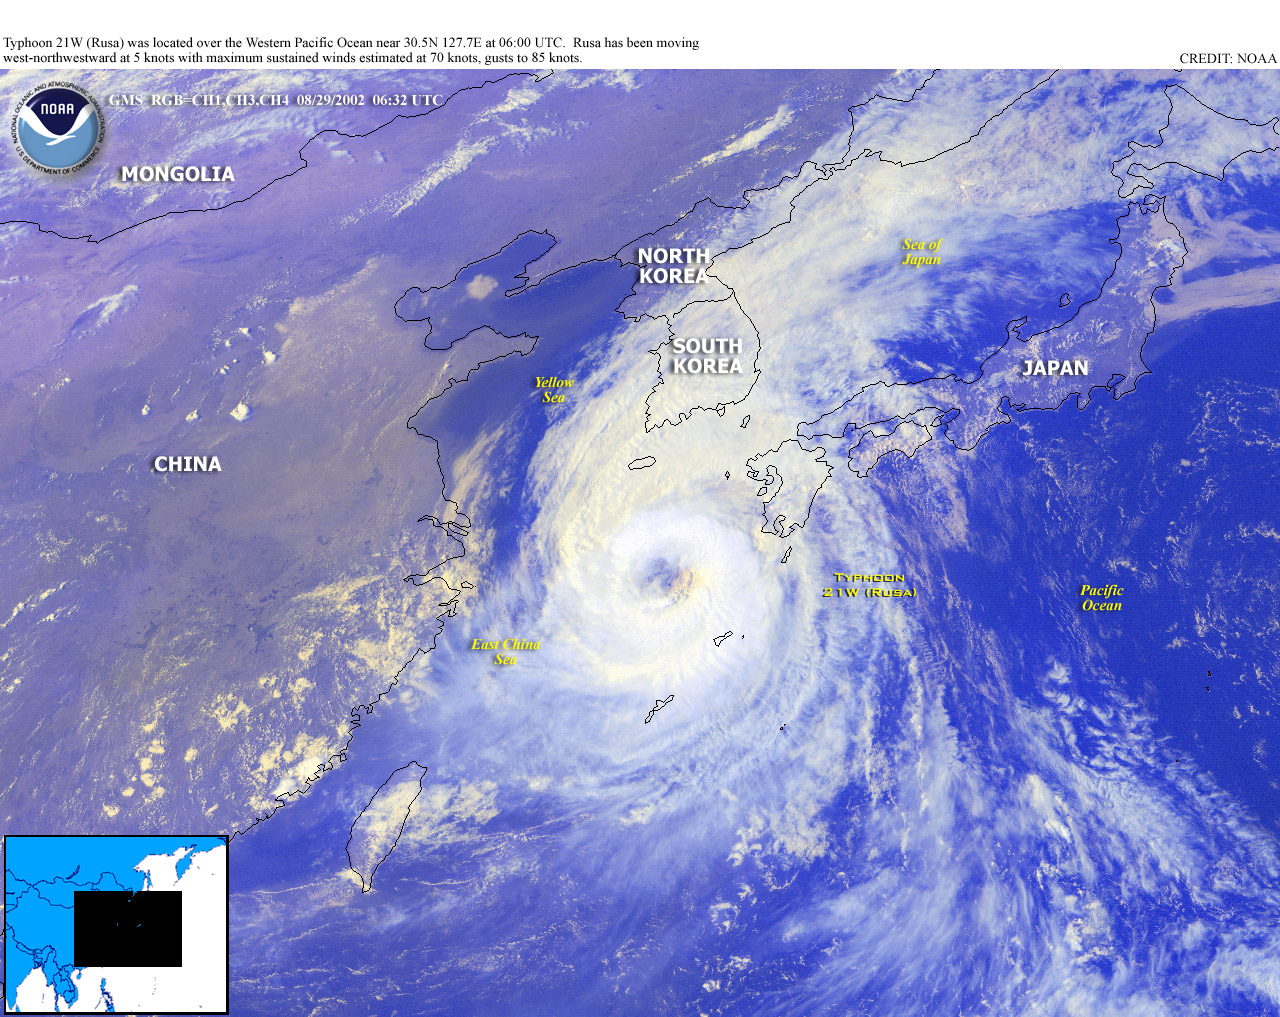
Rusa then recurved
northward across the East China Sea before making landfall along
the south coast of South Korea on the 31st with maximum sustained
winds of 130 km/hr (70 knots or 80 mph). The typhoon was the worst
to strike South Korea since 1959, causing 200 deaths and dumping
between 300 and 500 mm (11.8 and 19.7 inches) of rain on parts of
the country in less than 12 hours (ENS). |
| Typhoon Phanfone
developed in the open waters of the western Pacific Ocean on the
11th, becoming a typhoon on the 13th. Phanfone passed east of Japan
during the 19th-20th, disrupting plane, ferry and train services
and dumping heavy rainfall near the coast. |

larger
image
|
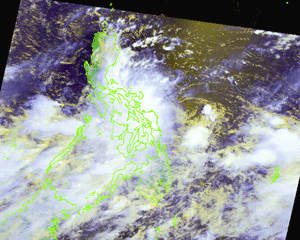
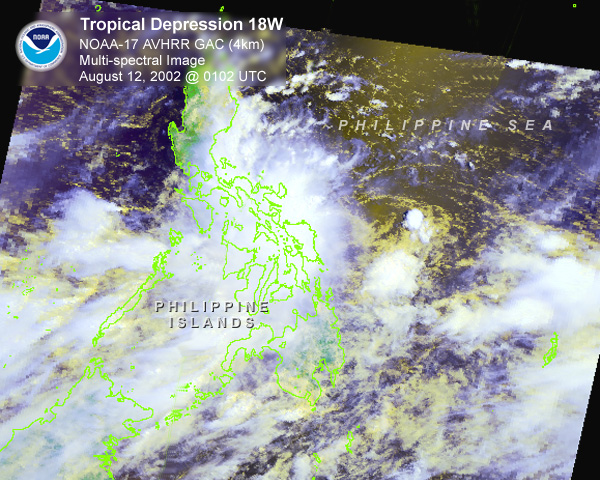
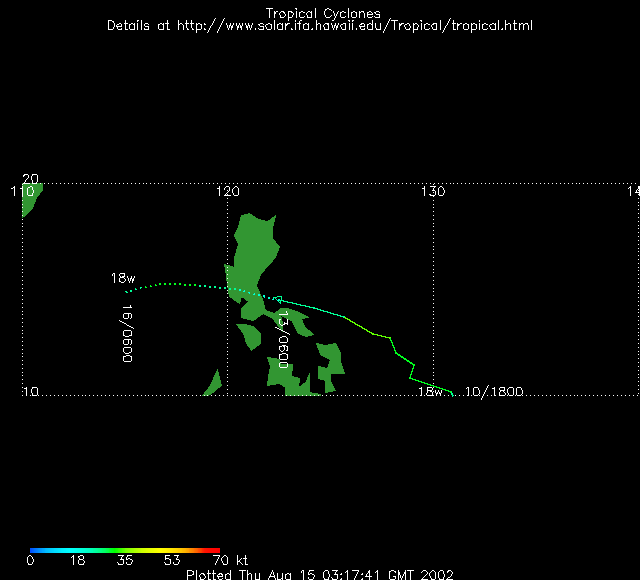
| Tropical depression
18w brought
very heavy rains to the Philippines during August 10-14. Flooding
was responsible for 22 deaths and the evacuation of 3,500 people
from their homes (CIP report). |
larger
image
|

larger
image
|
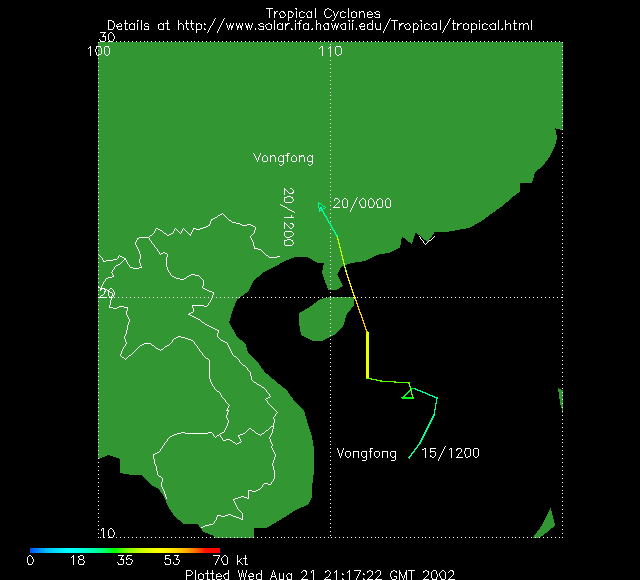
Tropical storm
Vongfong
developed in the South China Sea on the 13th and reached tropical
storm intensity on the 18th. The storm made landfall along the
southeast China coast on the 19th with maximum sustained winds near
95 km/hr (~50 knots or 55 mph) and heavy rains across the southern
Guangdong and Guangxi provinces. |

Radar Estimated
Precipitation
|
Tropical Storm
Bertha
developed in the northern Gulf of Mexico on the 4th just off the
southeast
Louisiana coast. The storm made landfall southeast of New
Orleans early on the 5th with maximum sustained winds near 65 km/hr
(~35 knots or 40 mph). The storm dumped rainfall amounts of 5-10
inches across coastal areas of Louisiana and Mississippi before
weakening. Bertha re-emerged over the Gulf of Mexico on the 7th and
was reclassified
as a tropical depression. Accompanied by heavy rains, Bertha made a
second landfall along the Texas coast early on the 9th about 60
miles south of Corpus Christi. |
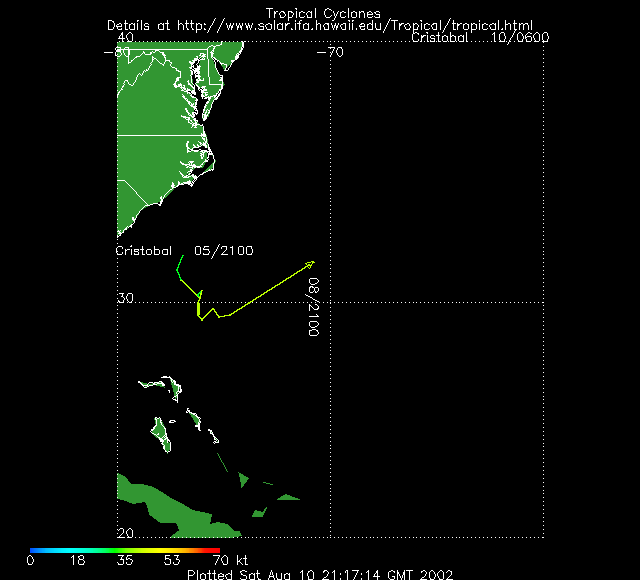
| Tropical Storm
Cristobal
developed off the southeast coast of the United States on the 5th
and reached tropical storm intensity on the 6th. The storm was
absorbed by a frontal zone as it passed over open Atlantic waters
on the 8th. |

larger
image
|

larger
image
|
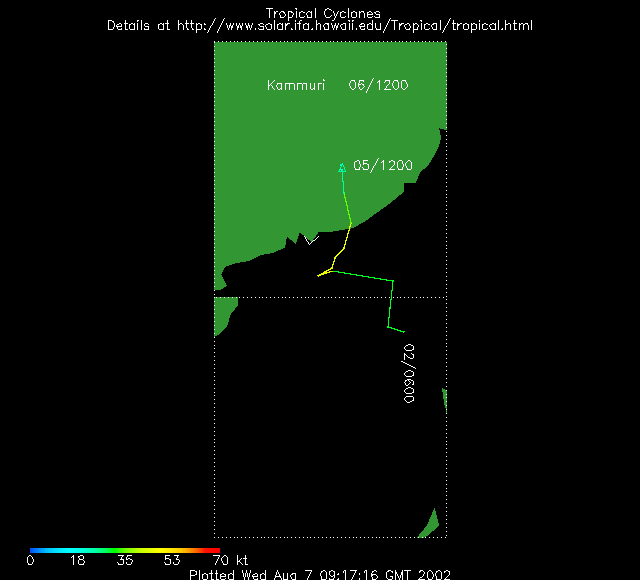
Tropical Storm
Kammuri
developed on the 2nd in the South China Sea and attained tropical
storm status on the 4th. Kammuri came ashore on the 5th in China's
Guangdong province, south of Shantou, with maximum sustained winds
near 85 km/hr (~45 knots or 50 mph). Flooding rains destroyed two
dams which resulted in 10 deaths in the city of Meizhou (Associated
Press). |
For the latest official advisories and information on tropical
systems in the western Pacific, please refer to the Joint Typhoon Warning
Center. In the central Pacific, the latest information can be
obtained from the Central Pacific Hurricane
Forecast Center, while the latest advisories on Atlantic and
eastern Pacific systems are available from the National Hurricane Center.
| A storm system brought
heavy
rain to much of South Africa during the 15th-19th, as locations
along the south and east coasts of Cape of Good Hope province
received amounts in excess of 400 mm (15.75 inches). Port Elizabeth
recorded 204 mm (8.03 inches) while the city of East London
accumulated 415 mm (16.34 inches) of rainfall. Normal rainfall for
the entire month of August in this area is generally between 65 and
80 mm (~2.5-3.2 inches). |

larger
image
|

| A series of winter
storms which affected parts of Argentina, Chile and Peru in
July
continued in early August, as above average snow cover was noted
via satellite across much of the Andes Mountains. Heavy snowfall
around the 8th prompted Peruvian officials to temporarily close the
Inca Trail to the ancient ruins of Machu Picchu. |

larger
image
|
References:
Basist, A., N.C. Grody, T.C. Peterson and C.N. Williams, 1998:
Using the Special Sensor Microwave/Imager to Monitor Land Surface
Temperatures, Wetness, and Snow Cover. Journal of Applied
Meteorology, 37, 888-911.
Peterson, Thomas C. and Russell S. Vose, 1997: An overview of
the Global Historical Climatology Network temperature data base.
Bulletin of the American Meteorological Society,
78, 2837-2849.


