Wildfire activity diminished across the U.S. in December, following a very active and destructive fire season in 2007. Long-term moisture deficits played a critical role in the severity of the 2007 wildfire season, especially in the Southeast and West which had persistent drought conditions during the year.
Early in the year, wildfires impacted portions of the Tennessee Valley and the Southeast in March, eventually spreading to northern Minnesota in April and southern Florida in May. The fire season started slowly in June across most of the West, except in central California where numerous blazes affected the Lake Tahoe area during the month.
Fire activity increased dramatically in July across the West, as large portions of the Intermountain region were affected by wildfires. The most severe fire activity occured in the Northern Rockies, where numerous large fires burned in July and August.
Fire activity persisted into September across Idaho and Montana, but eventually began to shift southward into California later in the month.
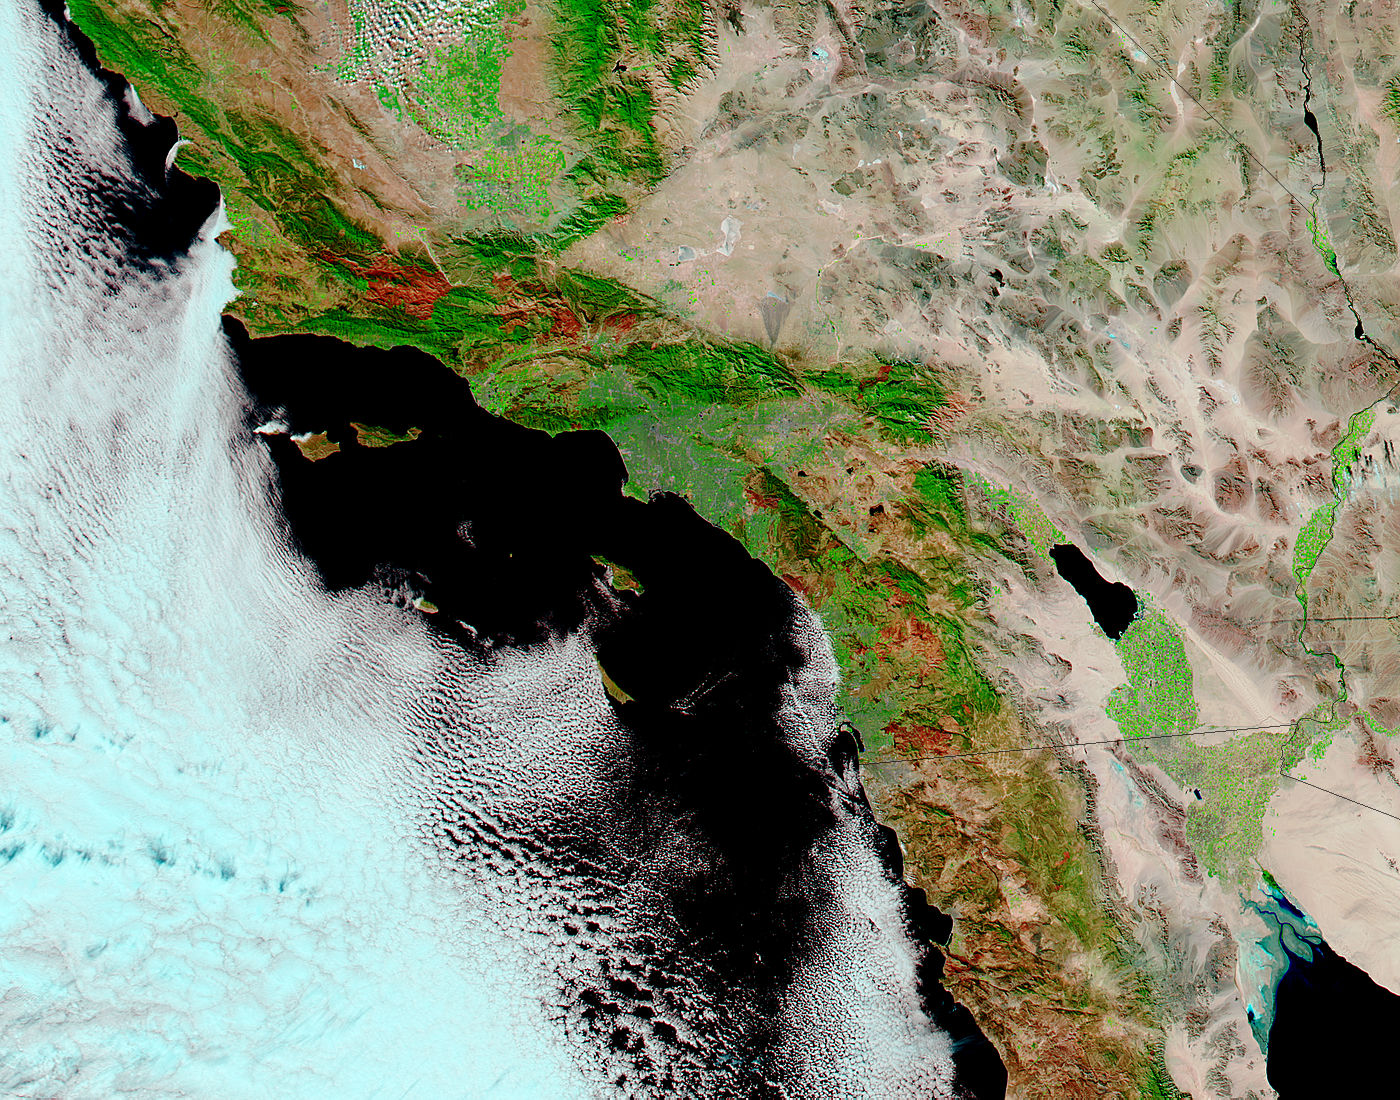
The most destructive fires of the year occurred in Southern California during the fall, as severe to exceptional drought and strong Santa Ana winds exacerbated brush and forest fires, and destroyed homes across the region in October and November.
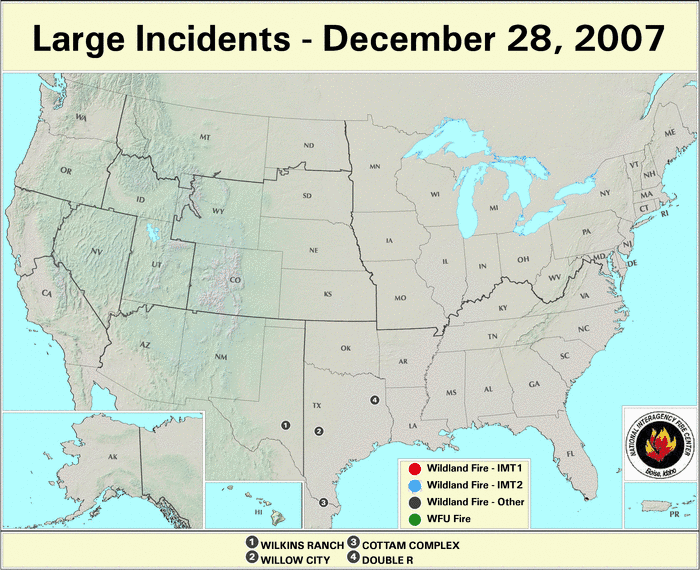
At the end of December fire danger remained elevated across parts of southern Florida, central Texas, Southern California, and a large portion of Nevada based on the Keetch–Byram Drought Index (KBDI), which was developed specifically for assessing fire potential.
For the year as a whole, over 85,000 wildland fires and more than 9.3 million acres had burned in 2007, according to the December 28th preliminary estimates from the National Interagency Fire Center (NIFC) in Boise, Idaho.
Based on annual statistics that extend back to 1960, the number of fires reported each year has shown a steady decline since the early 1980's for the entire U.S., as well as for Alaska since the early 1990's. However, the total number of acres burned each year has increased steadily since the mid-1990's. As a result, there has been an increasing trend in the size of wildfires, with six of the ten worst seasons in terms of Acres Burned having occurred since 2000.
| Totals as of December 28, 2007 | Nationwide Number of Fires | Nationwide Number of Acres Burned |
|---|---|---|
| 12/28/2007 | 85,583 | 9,318,710 |
| 12/28/2006 | 96,326 | 9,871,863 |
| 12/28/2005 | 66,020 | 8,681,252 |
| 12/28/2004 | 65,878 | 8,094,531 |
| 12/28/2003 | 63,269 | 3,959,223 |
| 12/28/2002 | 73,423 | 7,182,979 |
| 12/28/2001 | 83,996 | 3,570,225 |
| 12/28/2000 | 92,250 | 7,393,493 |
| 5–yr average (2003 – 2007) |
75,415 | 7,985,116 |
| 10–yr average (1997 – 2006) |
78,482 | 7,904,524 |
As shown in the table to the right, the 2007 fire season for the U.S. as a whole had the second most acres burned in the historical record, approximately 500,000 acres less than was reported in 2006.
The 2007 fire season was not an especially severe one in Alaska, which had just over half a million acres burned during the year. However, in September the Anaktuvuk River wildfire, which was caused by lightning, burned over 250,000 acres and set a record for the largest fire on the North Slope. After removing the number of acres burned in Alaska from the U.S. total, the total acres burned in 2007 was the second most on record once again behind 2006.